Make Line Horizontal
- Indikatoren
-
JM Highridge Global LLC
 MQL5 Developer & Trader – JM Highridge Global LLC
I’m Jason Miguel, trader and MQL5 developer at JM Highridge Global LLC.
I design practical indicators, EAs, and dashboards for MT5 that focus on risk control, clear entries, and real-world usability. - Version: 1.0
- Aktivierungen: 5
🚀 Wir stellen den ultimativen Horizontal Line Alert Indikator für MT4 vor! 🚀
Verändern Sie Ihr Trading mit dem intelligentesten Tool auf dem Markt. Unser Horizontal Line Alert Indicator ist nicht irgendein Indikator - er ist Ihr neuer Handelspartner, der Präzision, Flexibilität und intuitive Kontrolle vereint.
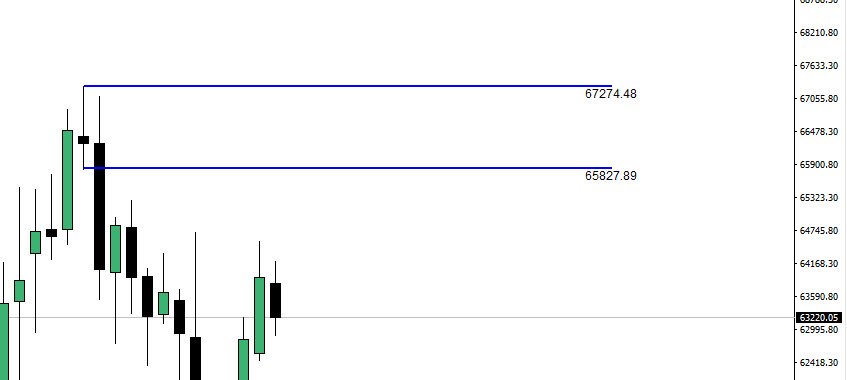
📉 Was macht er? Dieser revolutionäre MT4-Indikator passt die Trendlinien automatisch horizontal an, indem er einfach die Taste "L" drückt. Er ist perfekt für Händler, die sich auf bestimmte Kursniveaus konzentrieren wollen, um sicherzustellen, dass Ihre Analyse so scharf wie nur möglich ist.
🔔 Echtzeit-Warnungen! Aber das ist noch nicht alles - sobald Ihre Linie festgelegt ist, hält unser Indikator für Sie die Augen offen. Sie erhalten Echtzeitwarnungen, sobald der Marktpreis das von Ihnen festgelegte Niveau berührt. Es ist, als hätten Sie einen aufmerksamen Handelsassistenten, der niemals schläft und sicherstellt, dass Sie die entscheidenden Marktbewegungen nicht verpassen.
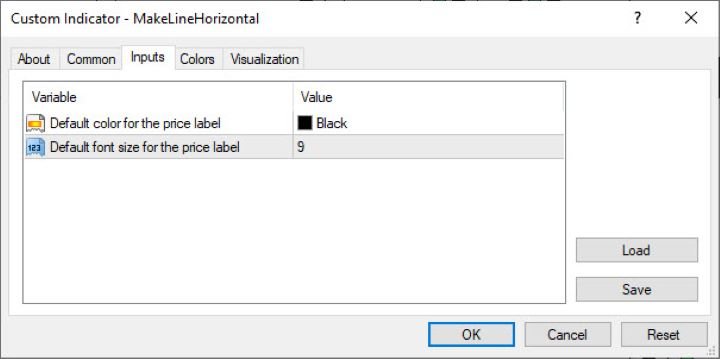
🔧 Anpassbar und benutzerfreundlich Dieses Tool wurde sowohl für Anfänger als auch für professionelle Trader entwickelt und ist unglaublich einfach zu bedienen. Eine schlanke, minimale Benutzeroberfläche ermöglicht es Ihnen, etwas einzustellen und zu vergessen, während das Backend die Märkte mit unübertroffener Genauigkeit überwacht.
Nutzen Sie die Kraft der Präzision und verpassen Sie nie wieder eine Gelegenheit. Egal, ob Sie Scalping betreiben, Daytrading betreiben oder langfristige Investitionen verwalten, dieser Indikator ist Ihr Tor zu einer höheren Handelsleistung.
🔗 Holen Sie ihn sich noch heute!