Abiroid Waddah Scanner
- Indikatoren
-
Abir Pathak
 I create MT4 and MT5 indicators. They are mainly arrows and scanner indicators and also some essential utilities.
I'm hoping they will make your trading easier and make you profitable.
You can join my Telegram channel to keep track of all products I post. - Version: 1.3
- Aktivierungen: 20
Merkmale:
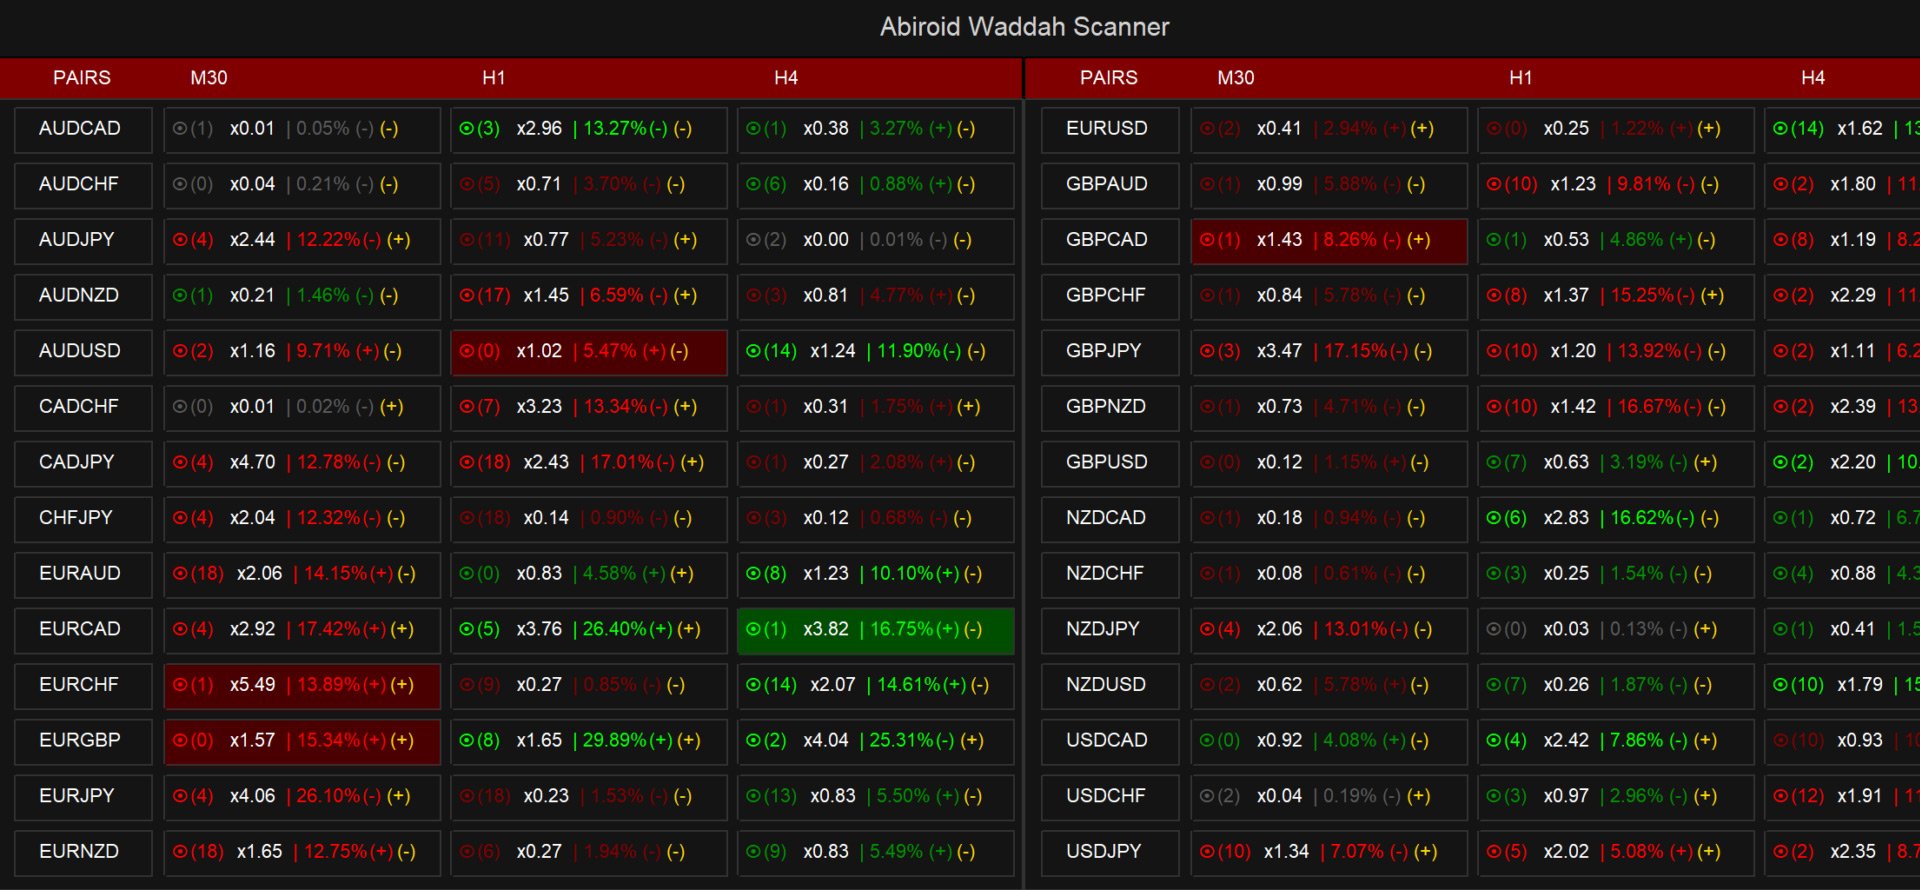
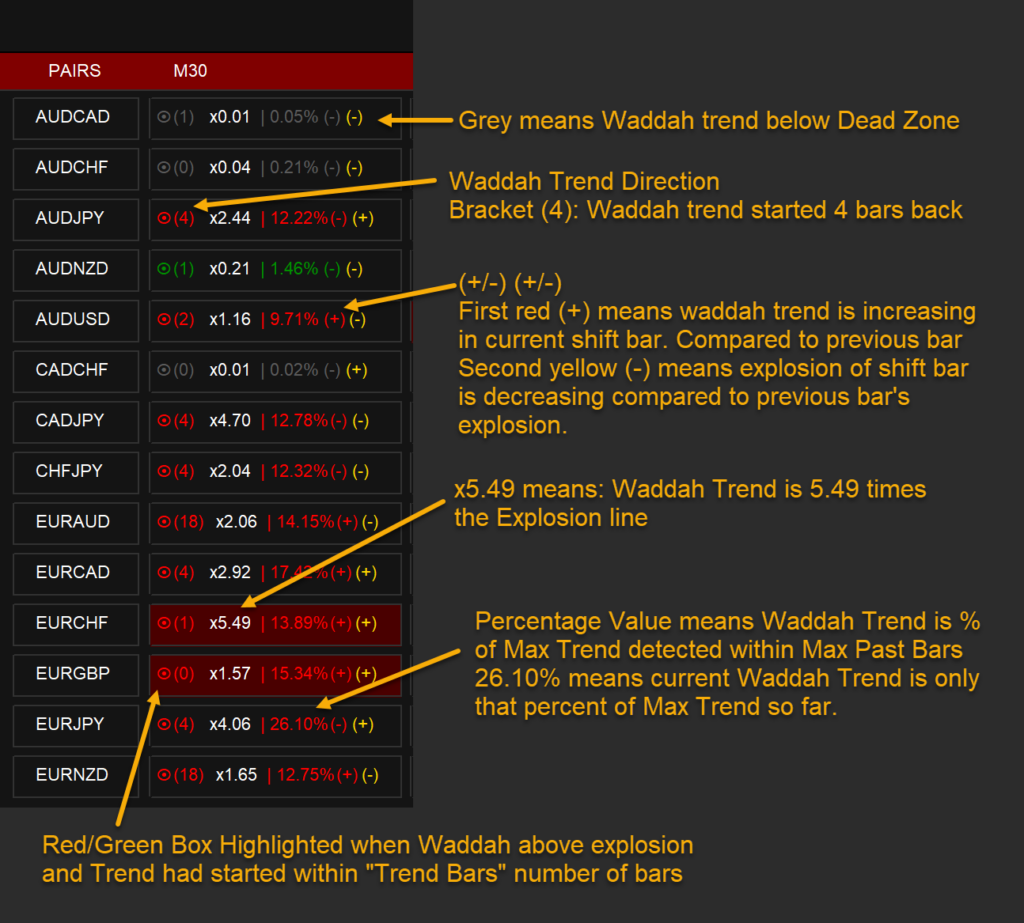
- Waddah Trend, Explosion Zunahme/Abnahme
- Trendprozentwert mit Schwellenwert
- ToteZone
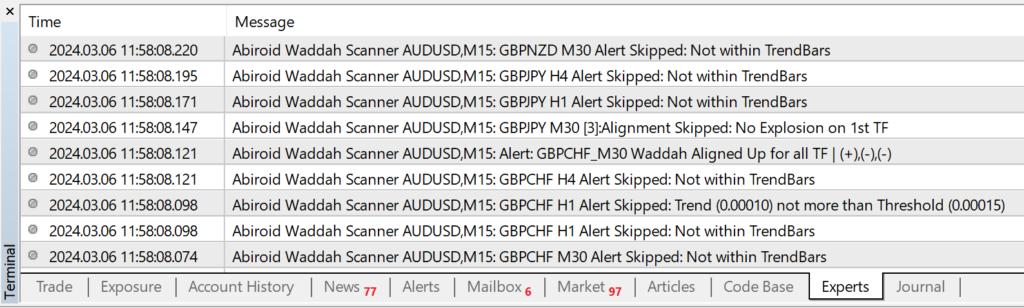
- Trendrichtung ausgerichtete Checks
- Hervorhebung und Warnungen
- Multi-Timeframe & Multi-Währung
Weitere Informationen finden Sie im Blogbeitrag:
https://www.mql5.com/en/blogs/post/758020
Mit anpassbaren Schwellenwerten können Sie die besten Handelsmöglichkeiten im volumenbasierten Handel identifizieren.
Trendhöhe verwenden (x mal Explosion): Trendhöhe im Verhältnis zum Explosionssignal
Trend-Prozent: Vergleicht die Trendhöhe mit dem maximalen Trend und wendet einen Schwellenwert für Trendprozent an.
Trend Zunahme/Abnahme: Trendzunahme oder -abnahme im Vergleich zum vorherigen Balken.
Explosion Zunahme/Abnahme: Explosionsanstieg oder -abfall im Vergleich zum vorherigen Balken.
Trend- oder Explosionsschwelle (Werte in Punkten): Der Waddah-Wert oder der Explosionswert muss über diesem Schwellenwert liegen.Warnungen:
Warnungen auf der Grundlage von Trendhöhe, Trendprozent, Trendzunahme/-abnahme und Explosionszunahme/-abnahme.