Abiroid Waddah Scanner
- Indicatori
-
Abir Pathak
 I create MT4 and MT5 indicators. They are mainly arrows and scanner indicators and also some essential utilities.
I'm hoping they will make your trading easier and make you profitable.
You can join my Telegram channel to keep track of all products I post. - Versione: 1.3
- Attivazioni: 20
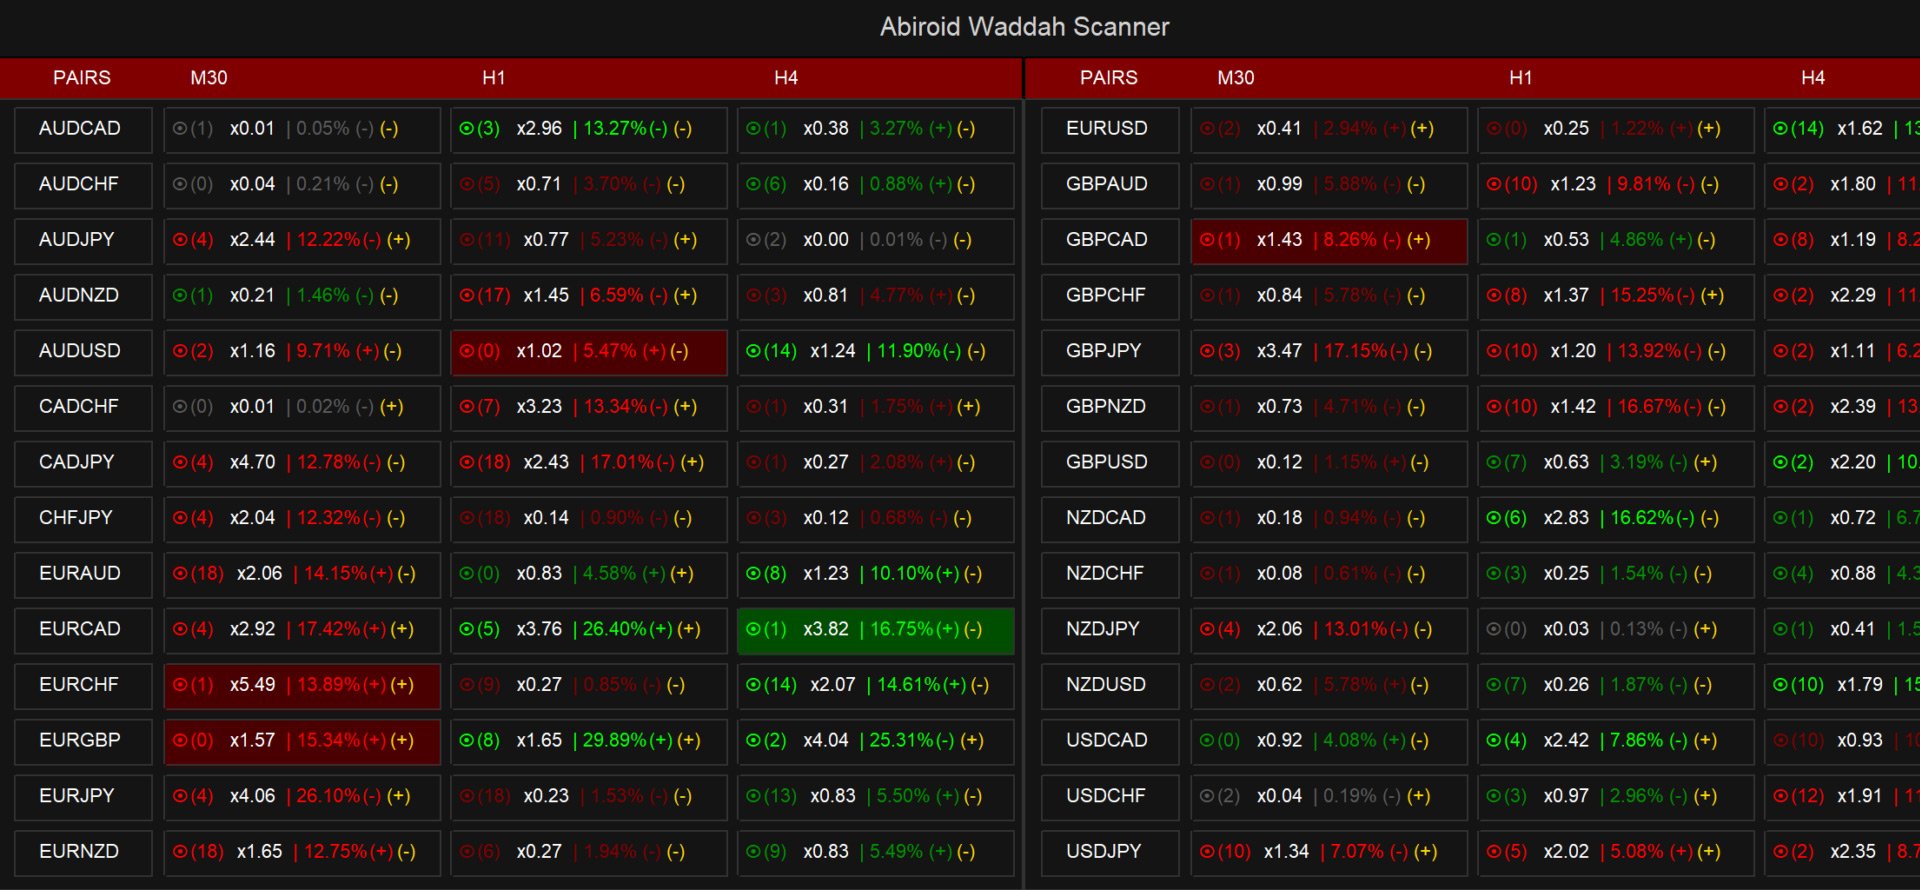
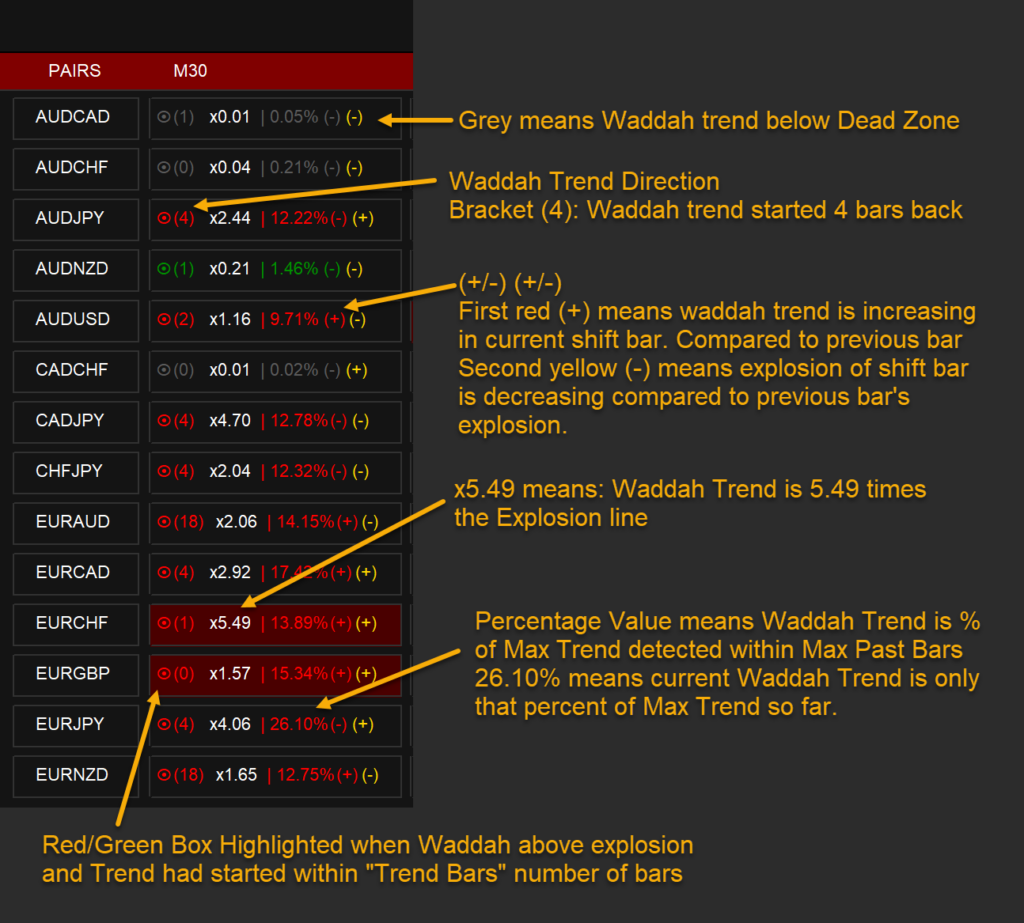
Features:
- Waddah Trend, Explosion Increase/Decrease
- Trend Percentage with Threshold
- DeadZone
- Trend Direction Aligned Checks
- Highlight and Alerts
- Multi-Timeframe & Multi-Currency
Check out the blog post for more info:
https://www.mql5.com/en/blogs/post/758020
With customizable threshold, you can identify best trading opportunities in volume-based trading.
Use Trend Height (x times Explosion): Trend height in relation to the explosion signal
Trend Percent: Compares the trend height to the maximum trend and applies a threshold for trend percent.
Trend Increase/Decrease: Trend increase or decrease compared to the previous bar.
Explosion Increase/Decrease: Explosion increase or decrease compared to the previous bar.
Trend or Explosion Threshold (Values in Points): Waddah value or explosion value needs to be above this threshold.
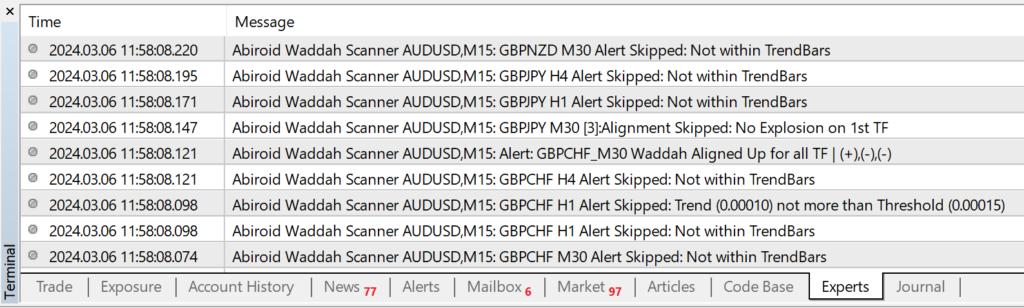
Alerts:
Alerts based on trend height, trend percent, trend increase/decrease, and explosion increase/decrease.