适用于MetaTrader 5的技术指标 - 32
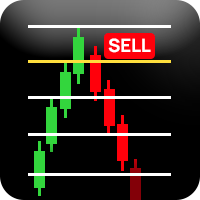
️ 重要提示:评估版本 - 限制交易品种支持 此指标目前仅供评估使用,仅支持以下交易品种: EURUSD(欧元美元) Volatility 50 (1s) Index(波动率50指数) 该指标无法在其他任何交易品种上运行。 Richchild 四分理论指标 评估版 专业市场结构分析工具 概述 这是一个专业的交易指标,旨在使用动态区间计算和基于四分位的价格分析来分析市场结构。该指标通过自动化周期分析和关键价格水平的可视化表示提供全面的市场洞察。 如何使用此指标 开始使用 品种选择 :确保您正在交易EURUSD或Volatility 50 (1s) Index 时间框架选择 :使用底部的时间框架按钮选择您的分析周期(M15, M30, H1, H4, H6, H12, D1, W1, MN1) 视觉控制 :使用控制按钮切换高/低线并在深色/浅色主题之间切换 读取仪表板 主仪表板显示多个时间框架的实时数据: TF :正在分析的时间框架 L% :当前价格从周期低点的位置(0-100%) H% :当前价格从周期高点的位置(负值表示低于高点) Quarter :您当前所在的时间四分
FREE
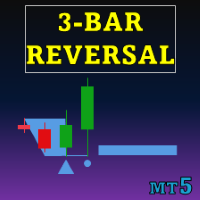
Special offer : ALL TOOLS , just $35 each! New tools will be $30 for the first week or the first 3 purchases ! Trading Tools Channel on MQL5 : Join my MQL5 channel to update the latest news from me 三条反转形态指标 为交易者提供了一个强大的工具,自动识别并在价格图上标出三条反转形态。该指标是一种有价值的资源,用于检测潜在的趋势反转,并通过集成的趋势指标提高信号准确性。 查看MT4版本: Three Bar Reversal Pattern MT4 查看更多产品: 所有产品 关键特性 自动形态识别: 该指标扫描三条反转形态,并以清晰的视觉信号显示,帮助识别潜在的趋势反转点。 基于形态的支撑和阻力水平: 当反转形态得到确认且价格走势与其一致时,指标会扩展形态的边界,建立通常上边界作为阻力,下边界作为支撑的水平。 趋势过滤选项: 此指标允许用户从多个关键指标(包括

指标 显示“支撑”和“阻力”线(这些线是使用 DRAW_LINE 绘图样式绘制的 - 也就是说,它们不是图形对象)。 对新最小值和最大值的搜索是在“信号条”的左侧和右侧执行的 - “信号条”是每个新构造的常规中间。 为什么指标名称中包含“灵活”一词?因为我们可以指定“信号条”左侧(“左条”)和右侧(“右条”)不同数量的条。 指标线在图表上从“信号条”到“右条”条的右侧绘制。 特征 : 为了在指标中显示更美观,使用了两个“支撑”缓冲区和两个“阻力”缓冲区(该技术解决方案与 MQL5 中绘制样式的限制有关)。 未来可能出现的情况 : 声音警报或(和)新指标缓冲区(箭头)。 如何使用该指标 : 该指标主要是为手动交易而创建的,因此用户只需监控两个指标缓冲区“支撑”和“阻力”以及当前价格。应特别注意价格突破指标线然后返回的时刻(几根柱线之后)。
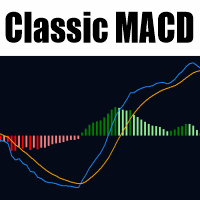
MetaTrader 5 的经典 MACD 此指标提供了 Gerald Appel 原设计经典移动平均收敛散度 (MACD) 指标的忠实实现,专为 MetaTrader 5 量身定制。它通过核心组件:MACD 线、信号线和柱状图,帮助交易者识别市场趋势、动量转变和潜在反转点。 MACD 线计算为两个指数移动平均线(通常为 12 周期和 26 周期)之间的差值,提供对价格动量的敏感度量。信号线是 MACD 本身的 9 周期 EMA,用于平滑波动,通过交叉生成买入/卖出信号。同时,多色柱状图直观地表示 MACD 和信号线之间的差距,便于一眼识别趋势的加强或减弱。 关键益处包括: 可靠检测牛市/熊市交叉,用于进入/退出时机。 分析价格行为与 MACD 之间的背离,用于发现反转。 零线定位,用于评估整体市场偏向(上方为牛市,下方为熊市)。 完全可自定义,包括可调节周期、应用价格和颜色,此指标无缝集成到任何 MT5 图表中。无论您是初学者分析基本趋势,还是高级交易者将其纳入复杂策略,它都提供永恒的技术洞见,而无需不必要的复杂性。对于支持或问题,请使用评论区或 MQL5 消息 — 无需外部链接。

隆重推出 Auto Trendline,这是一款创新的 MT5 指标,可自动执行以下过程:
在图表上绘制趋势线。告别手动绘制趋势线这项繁琐耗时的任务吧!
让 Auto Trendline 为您效劳!
*购买后请联系我,我会给您发送 使用说明和分步指南。 凭借其先进的算法,自动趋势线功能可以自动检测并绘制趋势线。
节省您的时间和精力。只需将指标附加到您的图表上,即可观看它根据价格走势的高点和低点识别并绘制趋势线。 自动趋势线具有高度可定制性,您可以调整指标的灵敏度以适应您的交易风格和偏好。
您还可以选择不同的线条样式和颜色,甚至可以设置警报,以便在趋势线被打破时通知您。 无论您是新手还是经验丰富的交易员,自动趋势线都是识别和分析任何市场趋势的重要工具。
凭借其用户友好的界面和先进的功能,该指标一定会提升您的交易体验,并帮助您做出更明智的交易决策。 主要特点: 自动绘制趋势线。 多品种和多时间周期。 高度可定制的灵敏度设置。 多种线条样式和颜色。 趋势线断裂警报通知。 用于监控符号和时间范围信息的仪表盘(GUI)。
立即体验自动趋势线分析,探索自动化趋势线分析的优势!

Simple Range Filter 是一款专为技术分析设计的指标,用于自动识别和突出显示具有 高波动性或低波动性 的蜡烛图。它通过计算指定数量蜡烛的 平均区间(高点 - 低点) ,并根据当前市场情况实时动态调整阈值,从而更清晰地展现市场节奏的变化。 主要功能包括: 动态计算 一定周期内的平均价格区间 使用颜色对蜡烛图进行 视觉高亮 ,以区分高波动与低波动 用户可自定义 色彩方案与计算周期,灵活适应不同交易风格 指标在每个市场 tick 到来时立即更新,无延迟 适用场景: 辅助识别市场进入 盘整阶段(低波动) 或 突破阶段(高波动) 适用于构建更复杂的技术分析系统,可作为 过滤器或确认工具 可与趋势类指标或区间分析工具配合使用,以提高判断精度 兼容性: 时间周期 :适用于 M1 至 D1 所有常用周期 市场工具 :外汇、股票、指数、加密货币等 请注意,该指标 不使用任何预测性算法 , 不生成自动交易信号 ,也 不承诺盈利或交易结果 。它是一个 用于增强分析判断力的技术辅助工具 ,适合日内交易者、趋势跟随者或希望了解市场结构的分析者。
FREE

Tom DeMark developed TD Sequential by hand, through a process of trial and error, in the 1970s. It never ceases to amaze me how something originally created to analyze daily price data can be applied so effectively, more than thirty years later, to any time frame—from one minute to one year—and to any market. The indicator has two components: TD Setup, which relies on momentum to define price ranges, and TD Countdown, which is trend based, and looks for low-risk opportunities to fade establishe

Daily pivot are relatively important in trading.
This indicator have options to select 5 commonly use pivot point calculations.
User input Choose Pivot Point Calculation (Method Classic, Method Camarilla, Method TomDeMark, Method Fibonacci or Method Woodies.) Choose Applied Timeframe for the calculation (M5, M15, H1, H4, D1, W1 etc) Can be attached to any timeframe Choose color of Pivot point Note:
For MT4, please refer here : https://www.mql5.com/en/market/product/22280
FREE

The MP Andean Oscillator is used to estimate the direction and also the degree of variations of trends. It contains 3 components: Bull component, Bear component and Signal component. A rising Bull component indicates that the market is up-trending while a rising Bear component indicates the presence of down-trending market. Settings: Oscillator period: Specifies the importance of the trends degree of variations measured by the indicator. Signal line per: Moving average period of the Signal line
FREE

Smart Trend Suite Pro – Advanced Trend Indicator with Dashboard & Alerts Overview: Smart Trend Suite Pro is a powerful trend-detection indicator that offers traders a complete set of tools for accurate trend analysis and actionable insights. Designed for versatility and precision, Smart Trend Suite Pro adapts seamlessly to multiple timeframes and market conditions, making it suitable for various trading styles, including scalping and swing trading. Key Features: Real-Time Trend Detection: Identi
FREE
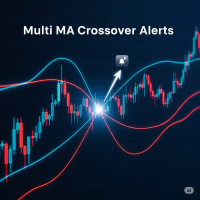
Multi MA Crossover Alerts - The Ultimate Trend Trading Tool Full Description: Tired of staring at charts for hours, afraid of missing a critical crossover signal? Do you find it difficult to analyze the trend using multiple moving averages at the same time? The Multi MA Crossover Alerts indicator is the all-in-one solution that will transform your trend trading. This powerful tool is designed to give you a complete market overview and alert you at the perfect moment, freeing you from the screen
FREE

Raymond Cloudy Day Indicator for MT5 – Pivot-Based Reversal and Trend Levels Raymond Cloudy Day Indicator is a pivot-based level indicator for MetaTrader 5 (MT5). It was developed by Ngo The Hung based on Raymond’s original idea and is designed to give a structured view of potential reversal zones, trend extensions and support/resistance levels directly on the chart. The default settings are optimised for XAUUSD on the H1 timeframe, but the indicator can be tested and adjusted for other symbols
FREE

Investment Castle Support and Resistance Indicator has the following features: 1. Dictates the direction of Buy or Sell trades based on Support and Resistance Levels automatically . 2. Candles stick colors will change to Red for Sell and Blue for Buy (Default settings, user can change from the inputs). 3. This indicator is built-in the Support & Resistance based Investment Castle EA which works with Psychological Key Levels "Support & Resistance".
FREE

Bulls and Bears trend Power
The Bulls and Bears trend Power is a no repaint versatile technical analysis tool that helps traders identify market trends and see who's in control. It features dynamic trend capture logic that adapts to market conditions for a clear visual representation of trend direction. Traders can customize the colors to suit their preferences.
Features : Trend identification Compensation of market noise by strength of sellers or buyers
Recommendations : Use H1 timeframe a
FREE

Initiated in 1995 by the physicist and technical analyst Paul Levine, PhD, and subsequently developed by Andrew Coles, PhD, and David Hawkins in a series of articles and the book MIDAS Technical Analysis: A VWAP Approach to Trading and Investing in Today's Markets.Latterly, several important contributions to the project, including new MIDAS curves and indicators, have been made by Bob English, many of them published in the book.
FREE

El Trend Detection Index (TDI) es un indicador técnico introducido por M. H. Pee. Se utiliza para detectar cuándo ha comenzado una tendencia y cuándo ha llegado a su fin. El TDI puede usarse como un indicador independiente o combinado con otros; se desempeñará bien en la detección del comienzo de las tendencias.
Los indicadores de tendencia son esenciales para detectar las tendencias de los mercados financieros. Estos indicadores ayudan a determinar la dirección que probablemente siga el activ
FREE

Price and Spread Indicator
Version: 1.0 Developer: Creative Tech Solutions Website: https://www.creativetechsolutions.co.uk
Overview The Price and Spread Indicator is a great tool for MetaTrader 5 that displays the Ask and Bid prices along with the spread directly on the chart. This indicator provides real-time updates and allows traders to make informed decisions based on accurate price information.
Features - Real-time Price Updates: Continuously updates Ask and Bid prices. - Spread Disp
FREE

Santa Donchian Indicator is an efficient way to detect support, resistence and break outs in any market.
The Donchian channel measures the high and the low of a previously defined range. Typically, a trader would look for a well-defined range and then wait for the price to break out to either one side for a trade entry trigger. Advantages Never repaints, never backpaints, never recalculates. Works in all symbols and all timeframes. Perfect trend filter for any strategy or expert advisor. Full
FREE
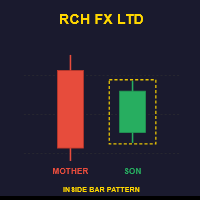
Want session filtering for your timezone? https://www.mql5.com/en/market/product/148638?source=Site +Profile Upgrade to the ADVANCED v1.40 for precise backtesting with customizable trading hours and GMT offset controls. Inside Bar Detector - Free Edition Automatically detects and marks inside bar patterns on your charts with visual rectangles. Simple, reliable, and works on all timeframes. Features: Real-time inside bar detection Customizable rectangle colors and styles Pop-up alerts for new sig
FREE

As médias coiote automatizam a leitura de analise de médias rápidas e lentas no saldo do volume e preço. Quando as médias estão em modo compra, a coloração do candle fica azul.
Quando as médias estão em modo venda, a coloração do candle fica magenta. Quando a coloração fica verde ou vermelho, temos a tomada das médias no volume mas não no preço, quando isso ocorre é um sinal de atenção.
A concepção do indicador é ser utilizado para operações em saída de consolidações na direção da tendencia do
FREE

SMC 时段指标 是一种精确工具,专为依赖 ICT 概念、流动性搜寻 和 基于时段的策略 的 智能货币交易者 而设计。它使用机构级交易者使用的最成熟和最流行的概念,无缝地绘制出关键的基于时段的交易区域。这种一体化时段指标将最有效和高概率的区间策略叠加到您的图表上,包括: ICT 亚洲区间、伦敦突破、纽约区间、ICT 伦敦开盘杀戮区、ICT 纽约开盘杀戮区、开盘区间突破 (ORB) (涵盖 伦敦、纽约、东京 )和强大的 午夜开盘区间 。它还突出显示 主要的外汇交易时段, 包括 悉尼、东京、伦敦 和 纽约 。每个区间都使用 TimeBox 方法以最高精度绘制, 有助于识别关键的 FVG(公允价值差距)、区间扫描、时段高点/低点 和潜在的 做市商操纵区域 。该指标专为严肃的 SMC 交易者设计,高度可定制,以与任何经纪商的服务器时间保持一致,从而能够在任何图表或时间范围内精确执行。
ICT 亚洲区间策略: ICT 亚洲区间 策略是智能货币和 ICT 框架下的基础策略。它识别 格林威治标准时间 23:00 至 04:00 之间的累积和盘整区域,这些区域通常会设置流动性陷阱,并使交

The indicator highlights the points that a professional trader sees in ordinary indicators. VisualVol visually displays different volatility indicators on a single scale and a common align. Highlights the excess of volume indicators in color. At the same time, Tick and Real Volume, Actual range, ATR, candle size and return (open-close difference) can be displayed. Thanks to VisualVol, you will see the market periods and the right time for different trading operations. This version is intended f
FREE

本指标可以让您享受两个最流行的产品来分析在感兴趣的价位的请求量和市场成交量: 真实市场深度图表 真实报价足迹成交量图表 本产品结合两个指标的效力,并以单个文件提供。
反危机出售。今日低价。赶紧! 真实的 COMBO 市场深度功能和报价成交量图表,完全等同于原始指标。您将享受这两款产品结合为单一超级指标的力量!下面是您将得到的功能:
真实市场深度图表 股民专用工具现已在 MetaTrader 5 上可用。 真实市场深度图表 指标在图表上以直方条的形式显示可视化的市场深度,并在实时模式下刷新。 利用 真实市场深度图表 指标您可以正确评估市场请求并从图表上看到大的市场。这可以 100% 的精确剥头皮和设置持仓止损。 指标以两种相应颜色的水平直方条形式显示买和卖的请求 (买-卖)。价格图表上给定级别的显示条和它们的长度与请求的交易量相应。此外, 它指示买卖请求的最大交易量。 此指标显示买卖请求总数量作为堆积面积图。这可以评估当经过下一价位时将会执行的请求总量。买卖请求总数量也显示在图表上。 省缺, 指标显示在图表背景上, 且它不会干扰任何其它指标。当使用指标交易时, 建议使用实际交易量。 本

The Candle High Low Exit indicator uses the highest high and the lowest low of a range to draw trailing stop lines (orange under buys, magenta over sells) that advance with the trend until the trend changes direction. Moreover, the trailing stop lines are generated to support the order’s trend direction (long or short): In an upward trend, the long trailing stop line (orange line under buy) appears and advances upward until the close crosses under the line.
In a downward trend, the short trai
FREE
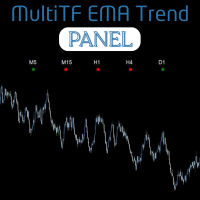
The MultiTF EMA Trend Panel is a clean, lightweight, and visually intuitive indicator designed to help traders quickly assess trend direction across multiple timeframes — all in one glance. It compares the relationship between two exponential moving averages (EMAs), typically the 50 EMA vs 200 EMA , across popular timeframes such as M5, M15, H1, H4, and D1 . You can customize the EMA settings and colors to match your own strategy or visual preferences. Key Features Multi-timeframe trend comparis
FREE

This tool is useful for indicating resistance and support levels It bases on zone in setting to identify top/bottom of candles and and draw rectangle according to those resistance/support level Beside user can edit the zone via dialog on specific timeframe and that value will be saved and loaded automatically. User can determine what strong resistance and support and make the order reasonably.
FREE

In which direction should I trade today? For “TREND followers”, we need to determine the TREND . This indicator determines the Trend based on the price High, Low and Close of every bar, for a given period and timeframe. Calculating and plotting the Trend UP and Trend DOWN lines. If the: “Trend UP” line (Green) is above the “Trend DOWN” line (Red), then it is a BULLISH Trend (see "Screenshots" tab). “Trend DOWN” line (Red) is above the “Trend UP” line (Green), then it is a BEARISH Trend (see "
FREE

The indicator measures the frequency of incoming ticks to analyze the market activity. Bullish and bearish ticks are analyzed separately, informing about the currently predominant market sentiment. According to observations, an increase in the frequency of ticks (panic) indicates the beginning of strong price changes, and an increase in the frequency of ticks in a particular direction not only accompanies a price change in this direction, but also often anticipates it. The indicator is indispens
FREE

Multset This is inte_plays indicator, which helps the trader to enter the trades appropriately it plots an arrow when there is appropriate environment which permits trading
Features 1. Sends push notification on mobile devices 2. Plots arrow on chart when the setting is found
TimeFrame Is suggested to be used on higher time frames only, especially starting 15min and above for proper moves
For more informations please Visit: https://t.me/Tz_Fx_Lab Subscribe to our Youtube channel: https:
FREE

Description This is an indicator for MT5 which has enhanced the "Fractals" indicator. "Fractals" indicator is included in MT5 by default but the draw line period is fixed at "5" and it cannot be modified. Thus I have reinvented the Fractals indicator with some useful function added. This tool will be useful especially for those who are learning how to draw good horizontal lines and wants to get some reference. Of course, those who are considering Fractals as an important horizontal line wil
FREE

簡單、直接、有效率——這就是 Bars Trend 和 Pivot Support 的全部意義所在。
有了這個系統,您就可以使用直覺的工具來方便地進行圖表分析。它會根據所選時間段自動標記重要的支撐位和阻力位,並突出顯示樞軸線,所有這些都可根據您的喜好啟動和停用選項。
儀表板也清楚顯示 D1、H4、H1 和 M30 時間範圍內的蠟燭方向,為各種交易方法提供重要的策略性見解。
此外,系統還會以實用的方式將當前的價差和形成下一個蠟燭的剩餘時間告知您,並將其整合到您的圖表中。
與我的主要指標強力趨勢一起使用: https://www.mql5.com/en/market/product/132647?source=Site +Market+My+Products+Page
FREE
WillSpread — Market Strength Indicator by Larry Williams for MetaTrader 5 !!!!!!!!!! Check out my Expert Advisor systems that also use market correlation https://www.mql5.com/ru/users/consig/seller WillSpread is a professional indicator based on Larry Williams’ proprietary methodology (a trader with decades of experience), designed to analyze the hidden strength and weakness of assets through intermarket correlations. Perfect for identifying leading signals and confirming trends. What i
FREE
Alpha Edge Pro – The Manual Trader’s Edge - If you prefer trading manually without stress, this indicator is for you. Get your copy now. Tired of missing the big moves or holding on to losing trades too long? Alpha Edge Pro is your new secret weapon. This high-performance, plug-and-play MT5 indicator gives you crystal-clear BUY and SELL signals — so you can trade with confidence, precision, and speed. If you prefer manual trading profitably , this indicator is made for you. Alpha Edge Pro does
FREE

Probability emerges to record higher prices when MACD breaks out oscillator historical resistance level. It's strongly encouraged to confirm price breakout with oscillator breakout since they have comparable effects to price breaking support and resistance levels; surely, short trades will have the same perception. As advantage, many times oscillator breakout precedes price breakout as early alert to upcoming event as illustrated by 2nd & 3rd screenshot. Furthermore, divergence is confirmed in c
FREE

his indicator automatically identifies key support and resistance levels by analyzing volume patterns. Unlike traditional S/R tools that rely only on price, Volume S/R finds levels where the market truly reacted. DETECTION LOGIC: - High Volume Zones: Price levels where strong buying/selling occurred - Low Volume Zones: Areas of weak interest - potential breakout or reversal zones
SMART FILTERING: - Nearby levels are automatically merged to avoid chart clutter - Maximum levels limit keeps yo
FREE

这个指标允许您通过在背景中应用两种可自定义颜色之间的平滑过渡来彻底改变图表的外观。通过这种方式,您可以创建出一个引人注目的渐变效果,为您的图表带来一种新鲜、现代的外观,使其在视觉上更加吸引人,增加了交易的乐趣与体验。 当您将该指标附加到图表上时,渐变效果将自动应用于当前图表上所有的指标窗口。这不仅提升了现有窗口的视觉效果,还会影响任何后续添加的新指标窗口,确保每一个窗口都能展现出一致且优雅的外观。 您可以根据自己的喜好选择渐变的颜色,使您的图表独一无二。这个简单而有效的工具使得交易者在进行市场分析时,可以更专注于图表的内容,而不会因为视觉上的繁杂而分散注意力。 快来尝试一下这个指标,给您的图表焕然一新吧!通过改变图表的外观,您将能够提升您的交易体验,让每一次交易都充满活力与灵感。
FREE
Tired of sifting through your account history to track closed trade profits? The Draw Profit indicator by Bo.Botfx is here to revolutionize how you visualize your trading performance! This intuitive and powerful indicator automatically draws the profit (or loss) of your closed orders directly onto your chart . No more guessing or tedious calculations – with Draw Profit, you can instantly see the exact outcome of each trade right where it happened. Key Features: Visual Profit Tracking: Clearly di
FREE

The Martinware Manual Trading Helper indicator is aimed at helping people start their lives in manual trading. It can be used to display both some generic images at the right side of the graph, where custom operational remarks may be displayed or just a blank rectangle hiding the chart while backtesting. Moreover, it can periodically play a list of sounds. To show a blank rectangle, let the first image name input field empty and select the desired color. To show one or more custom images inste
FREE

AZ_custom_daily_candle The indicator allows you to draw the contours of daily candles on small timeframes, plus you can customize the display of, for example, an H1 candle and see how it looks on the M5 chart (I think this is a useful setting for scalping). Further, it is possible to shift the beginning/end of drawing candles, change the background color, line thickness. Suggestions and wishes are welcome. v 1.05 (31/03/2025)
By demand, I have added the ability to turn on/off daily maximum/mini
FREE
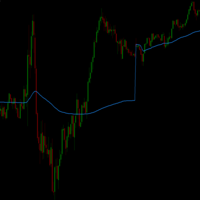
VWAP_PC_MQL5 — 一个简单的自制 VWAP 类指标,在 MT5 图表上实时显示成交量加权平均价。 时间框架:
适用于所有周期。 品种:
兼容外汇、指数、大宗商品和股票。 参数: AppliedPrice – 用于计算的价格类型(收盘价、典型价、加权价等) LineColor / Width / Style – 线条样式设置 SessionReset – 可每日重置或连续模式 工作原理(VWAP 原理):
VWAP(成交量加权平均价)计算公式为: VWAP = (价格 × 成交量之和) / (成交量之和) 它反映买卖双方的动态平衡:
价格 高于 VWAP → 多头占优;
价格 低于 VWAP → 空头占优。 简短结论:
VWAP_PC_MQL5 是一个轻量级的 VWAP 工具,结构简单但实用,帮助学习和分析成交量行为。
FREE

TrendFuze Pro Precision Manual Trading Dashboard for Clear, Confident Decisions Stop guessing the trend
Stop reacting to conflicting indicators Trade with structure, confirmation, and clarity What Is TrendFuze Pro? TrendFuze Pro is a FREE manual trading dashboard for MT5 , designed to help traders make clearer and more confident decisions by combining: Higher-timeframe trend bias (HTF) Current-timeframe trend context (CTF) Momentum conditions Candle confirmation logic This tool does not
FREE
MACD MTF 1 – Multi-Timeframe MACD A professional MACD indicator supporting all timeframes!
Displays the histogram and signal line clearly in a separate window, helping you to: Identify current market momentum. Track market reversals easily. Choose optimal entry and exit points without switching timeframes. Adjustable Settings: Timeframe for any strategy. Fast and Slow Moving Averages. Signal line sensitivity. Perfect for all trading styles: scalping, daily, and long-term trading.
FREE
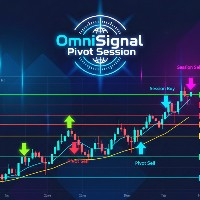
OmniSignal Pivot Session combines two powerful trading concepts— Daily Pivots and (NY, London and COMEX) Session Opening Levels —into one clean, intelligent signal indicator. It's designed to identify key market levels and provide clear, non-repainting entry signals based on a robust 3-candle confirmation pattern , helping you filter out market noise and trade with more confidence.
Suggested Symbols: XAUUSD, US30, DE40
(might have some bugs if you are using it with any Forex Pair!)
Core Fea
FREE

Magic Channel Scalper is a channel indicator for the MetaTrader 5 terminal. This indicator allows finding the most probable trend reversal points. Unlike most channel indicators, Magic Channel Scalper does not redraw. The alert system (alerts, email and push notifications) will help you to simultaneously monitor multiple trading instruments. Attach the indicator to a chart, and the alert will trigger once a signal emerges. With our alerting system, you will never miss a single position opening

Here is the full technical and strategic description for the Gann Square of 9 indicator. Full Name Gann Square of 9 - Intraday Levels (v2.0) Overview This is a mathematical Support & Resistance indicator based on W.D. Gann's "Square of 9" theory. Unlike moving averages which lag behind price, this indicator is predictive . It calculates static price levels at the very beginning of the trading day (based on the Daily Open) and projects them forward. These levels act as a "road map" for the day,
FREE

Automatic cataloging of probabilistic strategies for Binary Options.
Including: * MHI 1, 2 and 3, "MHI potencializada", M5 variation, Five Flip, "Padrão do Milhão", "Três Vizinhos", C3 and Turn Over. * Analysis by time range, date, and days of the week. * Function that brings results from other pairs. * Analysis only following trend and / or side market. * Operation analysis filtering only entries after hit. * Alert after x number of hits, after loss in martingale, or in each new quadrant entr

New Trend Stage -is a unique next-generation indicator that creates dynamic projections of market movement based on real data of the current day. These are not classical channels. This is an enhanced system of proprietary geometry built on the principles of time offsets, range dynamics, and adaptive levels.
The indicator automatically identifies and calculates the true range for the past N hours relative to each extremum and constructs precise, direction-based projections of future price moveme
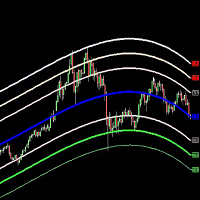
Belkhayate Gravity Center MT5 Custom
The Belkhayate center of gravity indicator is best used to confirm major turning points, and distinguish price extremes. Generally if price reaches the upper or lower levels one should expect a turn around coming soon, or at least a pull back towards the centre line if there is a strong trend. The upper and lower levels are red and green lines.
Our indicator use the same parameters as the well known trader M.Mostafa Belkhayate the inventor of the indicator

Supply or demand zones refer to price areas where a significant amount of supply or demand had previously entered the market, causing prices to either fall or rise. If the price returns to the demand or supply zone, it is likely to bounce off due to the large number of orders previously placed within the zone. These orders will be defended in these areas.
The Fair Value Gap (FVG) is a concept used to identify imbalances in the equilibrium of buying and selling. Fair Value Gaps are formed in a t
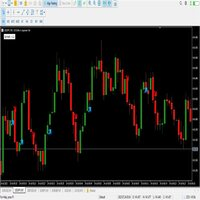
Alright. This indicator works on MT5 and is very easy to use. When you receive a signal from it, you wait for that candle with the signal to close and you enter your trade at the beginning of the next new candle. A red arrow means sell and a green arrow means buy. for easy identification of trade signal. Are you okay with that?
The indicator cost $500. We release new updates of the indicator every month and the updates are for free once you bought the indicator first time. This indicator was de
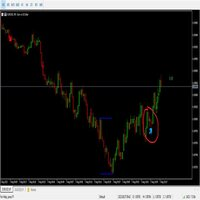
King Binary Profit System
1 minute candle
3-4 minute expire
Alright. This indicator works on MT5 and is very easy to use. When you receive a signal from it, you wait for that candle with the signal to close and you enter your trade at the beginning of the next new candle. A red arrow means sell and a green arrow means buy. All arrows comes with a long dotted like for easy identification of trade signal. Are you okay with that?
This is the Heiken Ashi Dashboard MT5. This dashboard will scan multiple timeframes and symbols in MT5 platform, from M1 chart to D1 chart. It will send the buy/sell signals by alert on the platform or sending notification to your phone or message you via a email.
The buy signal is generated when the heiken ashi bar changes its color from red to white. The sell signal is is generated when the heiken ashi bar changes its color from white to red. The up/down trend color will be displayed depend
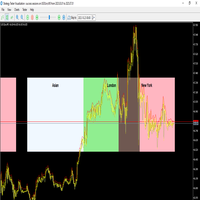
The Sessions Indicator visually highlights the major trading sessions (Asian, London, and New York) directly on the chart by drawing shaded rectangles. It helps traders quickly identify market activity zones, overlaps, and session-specific behaviors. Key Features:- Session Highlighting: Asian, London, and New York sessions are displayed using shaded rectangles with customizable colors.- Custom Session Times: Start and end times for each session can be adjusted to match broker server time.- Sessi

Description : Rainbow MT5 is a technical indicator based on Moving Average with period 34 and very easy to use. When price crosses above MA and MA changes color to green, then this is a signal to buy. When price crosses below MA and MA changes color to red, then this is a signal to sell. The Expert advisor ( Rainbow EA MT5 ) based on Rainbow MT5 indicator is now available here .
MT4 version is available here .
FREE
It is a very simple indicator to display daily loss percentage, open position loss percentage, monthly loss percentage and monthly profit percentage. MT4 version
We assure you that we welcome any suggestions to improve this indicator and make the necessary changes to improve this indicator.
You can contact us via Instagram, Telegram, WhatsApp, email or here. We are ready to answer you.

The new update makes this indicator a complete tool for studying, analyzing and operating probabilistic patterns. It includes: On-chart Multi-asset percentage monitor. Configurable martingales. Twenty-one pre-configured patterns, including Mhi patterns and C3. An advanced pattern editor to store up to 5 custom patterns. Backtest mode to test results with loss reports. Trend filter. Hit operational filter. Martingale Cycles option. Various types of strategies and alerts. Confluence between patter

This Automatic support/resistance indicator calculates various peaks and troughs of the price action, identifies relevant levels and draws support and resistance automatically. It uses the built-in "ZigZag" indicator in Metatrader as a data source hence, very much accurate indicator. The support and resistance lines are contineusely updated as new levels and formed. The indicator has only 5 parameters to set, and mostly it can be used with the default values: The description of the settings is

*Non-Repainting Indicator Arrow Indicator with Push Notification based on the Synthethic Savages strategy for synthethic indices on binary broker.
Signals will only fire when the Synthethic Savages Strategy Criteria is met BUT MUST be filtered.
Best Signals on Fresh Alerts after our Savage EMA's Cross. Synthethic Savage Alerts is an indicator that shows entry signals with the trend. A great tool to add to any chart. Best Signals occur on Fresh Alerts after our Savage EMA's Cross + Signals on

This indicator is based on a classic DeMarker indicator. Multi TimeFrame indicator MTF-DeMarker shows data from the 4 timeframes by your choice. By default this indicator has external parameters: TF1 = 1; TimeFrame2b = true; TF2 = 5; TimeFrame3b = true; TF3 = 15; TimeFrame4b = true; TF4 = 60; InpPeriod = 14; You can change TF1-TF4 in the next limits: TF1 from M1 (1) to H4 (240) TF2 from M5 (5) to D1 (1440) TF3 from M15 (15) to W1 (10080) TF4 from M30 (30) to MN1 (43200) All chosen TFs should be
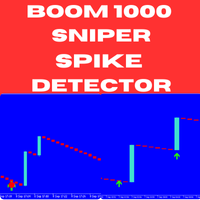
Boom and Crash Sniper Spike Detector - Boom 1000 The Boom and Crash Sniper Spike Detector is the ultimate tool for spike trading on Boom 1000, offering clear and reliable signals to help you capture high-probability trades. This advanced indicator is designed to enhance your trading strategy by simplifying spike detection and maximizing your profits. Key Features: Multi-Timeframe Compatibility : The indicator can be used on M1, M5, M15, M30, and H1 timeframes, but it works best on the M1 timefra

Highly configurable Average True Range (ATR) indicator.
Features: Highly customizable alert functions (at levels, crosses, direction changes via email, push, sound, popup) Multi timeframe ability Color customization (at levels, crosses, direction changes) Linear interpolation and histogram mode options Works on strategy tester in multi timeframe mode (at weekend without ticks also) Adjustable Levels Parameters:
ATR Timeframe: You can set the lower/higher timeframes for ATR. ATR Bar Shift: you
FREE

Definition : VPO is a Volume Price Opportunity. Instead of using bars or candles with an Open, High, Low, and Close price, each "bar" in a Market Profile is represented by horizontal bars against the price It is called Market Profile terminology.
In other words volume-price-opportunity (VPO) profiles are histograms of how many volumes were traded at each price within the span of the profile.
By using a VPO chart, you are able to analyze the amount of trading activity, based on volume, for each
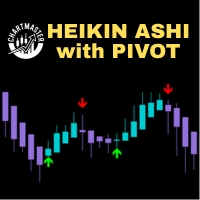
好的,这里是您的产品描述的中文翻译版本: 通过 ChartMaster Heikin Ashi with Pivot Indicator(图表大师平均K线枢轴指标) ,让您的交易迈上新台阶。这款强大的工具将 平均K线的清晰度 与 高级枢轴点分析 相结合,专为希望精准识别市场趋势、反转以及关键支撑/阻力区的交易者而设计。 主要功能: 平均K线可视化 – 平滑市场噪音,更清晰地识别趋势。
自动枢轴检测 – 在图表上用箭头标注潜在反转点。
买卖信号 – 绿色箭头提示潜在看涨枢轴,红色箭头提示看跌枢轴。
趋势确认 – 平均K线帮助过滤虚假信号,聚焦高概率交易。
多周期兼容 – 适用于所有周期(M1 至 MN1)。
用户友好界面 – 界面简洁、清晰,适合专业交易者和初学者。
无重绘信号 – 枢轴信号在K线收盘后保持不变,可靠可信。 帮助您的交易方式: 提前发现趋势延续或衰竭。 找到高概率的进场和出场点。 将趋势方向(平均K线)与枢轴反转信号结合,提升精准度。 适用于剥头皮、日内交易、波段交易和长期投资。 ️ 参数与自定义: 可调节的枢轴灵敏度。 可自定义

In the world of finance, correlation is a statistical measure of how two securities move in relation to each other. Correlations are used in advanced portfolio management. This indicator measures how different securities move in relation to a reference one, thus making portfolio management easier. [ Installation Guide | Update Guide | Troubleshooting | FAQ | All Products ] Avoid concurrent trades in highly correlated instruments Find trading opportunities among highly correlated instruments Cor
FREE
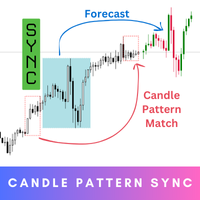
Candle Pattern Sync is your ultimate tool for precision and insight in trading. Step into the future of trading with this innovative indicator that’s designed to help you understand market behavior by analyzing historical patterns and giving you an idea of what might come next. While the forecasts provide valuable probabilities based on history, they’re not guarantees – think of them as a powerful guide to inform your decisions, not a definitive answer. MT4 Version - https://www.mql5.com/en/m

!!!This Free Version just works on EURUSD!!! Wa Previous Candle Levels MT5 shows the previous candle levels, it shows the previous candle Open High Low Close levels (OHLC Levels) in different time frame. It's designed to help the trader to analyse the market and pay attention to the previous candle levels in different time frame. We all know that the OHLC Levels in Monthly, Weekly and Daily are really strong and must of the time, the price strongly reacts at those levels. In the technical anal
FREE
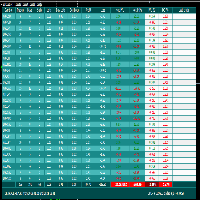
FCK Trade Report This indicator was developed by Fx Candle King. BEFORE CHOOSE CUSTOM PERIOD, GO TO TERMINAL WINDOW (ctrl+T), right click on ACCOUNT HISTORY and CHOOSE ALL HISTORY. This report searches the filtered data in your ACCOUNT CURRENT & HISTORY TRADE, Select your timespan for the report open and closed trades etc... Chose the report type - List only OPEN orders / List only CLOSED orders / List both OPEN and CLOSED orders
FREE

Hyper Force指标最初由David Weis于1984年创建,以波形形式显示符号趋势的强度。
波浪越大,趋势越强。
小浪意味着弱势的趋势或没有趋势的市场。
在波浪中,一个柱线和另一个柱线之间的差异越大,趋势越强。
当一个条形图和另一个条形图之间的距离开始减小时,这意味着该波已经开始失去其趋势。
因此,以强大的力量抓住浪潮并在浪潮减弱时走出去是理想的。
其他指标,例如移动平均线,MACD可以帮助您有力地确认这一趋势。
当一个条形图和另一个条形图之间的距离开始减小时,这意味着该波已经开始失去其趋势。
因此,以强大的力量抓住浪潮并在浪潮减弱时走出去是理想的。
其他指标,例如移动平均线,MACD可以帮助您有力地确认这一趋势。
FREE

多货币和多时间框架 Heikin Ashi 指标。 显示了当前的市场状况。 在扫描仪面板上,您可以看到当前趋势的方向、强度和条形数量。 盘整/反转蜡烛也用颜色显示。 您可以在参数中指定任何所需的货币和期间。 此外,当趋势发生变化或出现反转和盘整蜡烛(十字星)时,指标可以发送通知。 通过单击单元格,将打开该符号和句点。 这是 MTF 扫描仪. Heikin-Ashi 是日本的交易指标和金融图表,意思是“平均速度”。 Heikin-Ashi 图表类似于烛台图,但具有更平滑的外观,因为它们跟踪一系列价格变动,而不是像烛台那样跟踪每个价格变动。 Heikin-Ashi 由 Munehisa Homma 在 1700 年代创建,他还创建了烛台图。 交易者和投资者使用这些图表来帮助确定和预测价格变动.
参数 Averaging Method for Smoothing — 选择平滑蜡烛价格的方法. — Simple MA — 简单 MA
— Exponential MA — 指数 MA
— Smoothed MA — 平滑 MA
— Linear weighted MA — 线性加权 MA
—

什么是Pi周期预测 (Pi Cycle Projections)? Pi周期预测是一个专为MetaTrader 5设计的综合交易系统,它为您提供双重优势:它不仅能在当前市场中识别 高概率的入场信号 (基于移动平均线交叉),还能绘制 市场未来潜在情景的可视化地图 。 可以将其视为一个二合一的系统: 一个智能信号生成器 :它通过Pi移动平均线交叉告诉您 何时 行动。 一个战略周期预测器 :它向您展示价格可能 走向何处 。 这两个功能都基于强大的“Pi周期”概念,并辅以多个可选的过滤条件来减少噪音。(请注意:启用这些过滤器后,如果信号不满足任何一个过滤条件,预测线就会消失。) 组成部分一:Pi移动平均线交叉信号生成器(“当下”) 通常,Pi信号产生于移动平均线的交叉。而这个指标通过一个 严格的4层验证过程 , 极少 生成买入或卖出箭头: Pi移动平均线交叉 :当快速移动平均线(例如111)与乘以Pi的慢速移动平均线(例如350 * 3.14)交叉时,信号产生。 强度过滤器 (ADX) :只有当ADX确认存在足够强的趋势时,信号才有效,从而避免了弱势或横盘的移动。 参与度过滤器 (成交量) :
FREE
学习如何在MetaTrader AppStore上购买EA交易,MetaTrader平台的应用程序商店。
MQL5.community支付系统支持通过PayPay、银行卡和热门付款系统进行交易。为更好的客户体验我们强烈建议您在购买前测试EA交易。
您错过了交易机会:
- 免费交易应用程序
- 8,000+信号可供复制
- 探索金融市场的经济新闻
注册
登录