MetaTrader 5용 기술 지표 - 32

Highly configurable Adx indicator.
Features: Highly customizable alert functions (at levels, crosses, direction changes via email, push, sound, popup) Multi timeframe ability Color customization (at levels, crosses, direction changes) Linear interpolation and histogram mode options Works on strategy tester in multi timeframe mode (at weekend without ticks also) Adjustable Levels Parameters:
ADX Timeframe: You can set the lower/higher timeframes for Adx. ADX Bar Shift: you can set the of
FREE

RS Zone is an Indicator used to plot the support and resistance levels of each asset. and each time period as we determine The principle for calculating support and resistance levels is based on the price range (Range SR) to see if there are points where the price repeatedly reverses at that price level or not. The total pot will be equal to the Total SR that we set. Example If Range SR is equal to 120, the system will choose to look at data going back 120 candlesticks to find whether there is a
FREE

Alligator Window Indicator : Potencialize suas análises no MetaTrader com o Alligator Window. Este indicador coloca o clássico Alligator de Bill Williams em uma janela separada, permitindo uma visualização mais clara e organizada. Ideal para traders que buscam precisão e eficiência em suas operações, o Alligator Window proporciona insights nítidos e facilita a identificação de tendências sem poluir o gráfico principal. Experimente agora e leve suas estratégias de trading a um novo patamar!
FREE

If you like this product, please give it a 5 star rating as a token of appreciation.
This indicator calculates and draws pivot points and support/resistance levels for both daily and weekly timeframes: Pivot (central) level Support levels S1, S2, S3 Resistance levels R1, R2, R3 It allows showing daily, weekly, or both sets of pivots , giving traders visual references for potential support/resistance areas.
Pivot mode: Choose which pivots to display (weekly, daily, or both). Colors and style: C
FREE

The Stretch is a Toby Crabel price pattern which represents the minimum average price movement/deviation from the open price during a period of time, and is used to calculate two breakout levels for every single trading day. It is calculated by taking the 10 period SMA of the absolute difference between the open and either the high or low, whichever difference is smaller. This value is used to calculate breakout thresholds for the current trading session, which are displayed in the indicator as
FREE
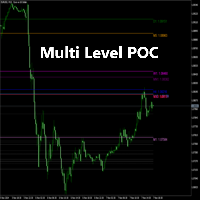
Detailed Description:
The Multi Level POC Indicator is designed for traders who want to identify critical price levels based on volume analysis across multiple timeframes. Key Features:
Multi-Timeframe POC Calculation: Automatically calculates and displays the POC from multiple timeframes, including M1, M5, H1, D1, and more. Intermediate Levels Display: In addition to the primary POC levels, the indicator also plots intermediate levels based on the POC. Custom Precision and Depth Settings: Us
FREE

Displays a USD DXY chart in a seperate window below the main chart. YOUR BROKER MUST HAVE THESE SYMBOLS FOR THE INDICATOR TO WORK Based on EUR/USD, USD/JPY, GBP/USD, USD/CAD, USD/CHF and USD/SEK All these pairs must be added to Market Watch for the indicator to work correctly As this is calculated using a formula based on the 6 pairs it will only work when the market is open.
YOUR BROKER MUST HAVE THESE SYMBOLS FOR THE INDICATOR TO WORK
Displays a USD DXY chart in a seperate window below the m
FREE
S 500 Precision Block 지표 – 무료 오더 블록 시각화 이 지표는 트레이더가 시장 움직임을 더 깊이 이해하고 전략적인 의사 결정을 내릴 수 있도록 돕는 강력한 도구입니다. 검증된 **"S 500 Precision Block" Expert Advisor (EA)**에서 직접 추출되었으며, S&P 500 M30 차트에서 강세 및 약세 오더 블록 을 정확하게 표시합니다. 순수한 프라이스 액션 분석에 중점을 두어 불필요한 추가 지표 없이 주요 지지 및 저항 수준을 시각적으로 강조합니다. 이를 통해 시장 구조를 명확하게 파악하고 거래 기회를 쉽게 찾을 수 있습니다. 중요 참고: 이 지표는 S&P 500 심볼 및 M30 시간 프레임에 특화되어 개발 및 최적화 되었습니다. 따라서 해당 신뢰할 수 있는 기능과 정확성은 이 특정 구성에서만 보장됩니다. 최적의 결과를 얻으려면 권장 설정에서 사용해 주시기 바랍니다. 자동 트레이딩에 관심 있으신가요? 이 오더 블록들을 완전 자동으로 트레
FREE

การพิจารณาคุณลักษณะ HUD ขณะนี้ผมกำลังมุ่งเน้นไปที่คำอธิบายภาษาอังกฤษสำหรับแดชบอร์ด GAPHUNTER UAD รุ่น Compact HUD ผมกำลังวิเคราะห์คุณสมบัติหลักของรุ่นนี้โดยเฉพาะ เป้าหมายของผมคือการสร้างคำอธิบายผลิตภัณฑ์ที่แสดงจุดขายและประโยชน์ที่เป็นเอกลักษณ์อย่างชัดเจนสำหรับกลุ่มเป้าหมาย เป้าหมายคือการเน้นย้ำถึงความกะทัดรัดและการใช้งาน การวิเคราะห์คุณสมบัติหลัก ตอนนี้ ผมกำลังเจาะลึกฟีเจอร์สำคัญๆ มากขึ้น โดยเฉพาะอย่างยิ่งในบริบทของผู้ใช้ MQL5 Market โดยเน้นที่การติดตามกำไร/ขาดทุนแบบเรียลไทม์ของ Compact HUD และ
FREE

Having trouble marking where the various forex sessions start and end? Or perhaps your strategy requires you trade only in a specific session, then this is for you.
The session indicator shades the session you require in a certain color so that you can identify it easily. The sessions shown include: London session, New York session, Asian Session, Asian - London overlap and London - New York Overlap.
Difference source give varying time ranges for the various session, mostly differing by not m
FREE

SuperTrend Plus Dema – Faster Trends, Less Noise SuperTrend Plus Dema is an advanced evolution of the classic trend-following indicator. Unlike standard SuperTrend indicators that rely solely on High/Low or Close prices, this tool integrates the Double Exponential Moving Average (DEMA) as a calculation source. This unique combination offers a smoother trend line with significantly reduced lag, allowing you to catch trends earlier while filtering out market noise. Why use SuperTrend Plus Dema? Re
FREE
1. Introduction The Squeeze Momentum Plus is a powerful technical analysis tool designed to help traders identify periods of low market volatility (the "squeeze" phase) and assess the direction and strength of price momentum . This indicator combines the principles of Bollinger Bands and Keltner Channels to detect changes in market volatility, along with a momentum oscillator to measure buying/selling pressure. 2. Key Components of the Indicator The Squeeze Momentum Plus is displayed in a separa
FREE

"Adaptive Moving Average Envelope" 지표는 금융 시장에서 현명한 결정을 돕는 도구입니다. 이 지표는 트레이딩에서의 트렌드 방향과 가능한 진입 및 이탈 포인트를 명확하게 제시하기 위해 설계되었습니다.
이 지표는 시장 변동성의 변화에 자동으로 적응하는 적응형 이동 평균을 기반으로 합니다. 이는 고요한 시장에서부터 변동성이 큰 시장까지 모두 유용하게 사용할 수 있습니다. 이 지표는 적응형 이동 평균을 둘러싼 두 개의 선을 표시합니다. 이러한 선은 중요한 서포트 및 저항 수준을 식별하는 데 도움을 주며, 자산을 언제 사고 팔아야 하는지에 대한 더 현명한 결정을 내릴 수 있도록 합니다.
고급 기술적인 특성을 가진 이 지표임에도 불구하고, 이해하고 사용하기 쉬워 초보자와 숙련 트레이더 모두에게 적합합니다. 이 지표의 시장 조건에 자동으로 적응하는 능력은 다양한 상황에서 다재다능하고 효과적이라고 할 수 있습니다. 시장 트렌드를 명확하게 시각화하여 충동적인 거래를 피
FREE

시장 **"고래(Whales)"**가 항상 같은 시간에, 같은 방향으로 진입하는지 궁금했던 적이 있나요? 이 지표가 그 사실을 보여줍니다. 이 지표는 진입 신호를 제공하지는 않지만, 평소에는 간과하기 쉬운 시간별 또는 일별 역사적 움직임 패턴 을 드러냅니다. 예를 들어, 목요일 15:00 에 EURUSD 가 80%의 확률로 상승 할 수 있다는 것을 발견할 수 있습니다. 시간대별 편향을 확인 하거나 자신의 전략에 맞는 고확률 시간대를 식별 하고자 하는 트레이더에게 이상적입니다. 이 지표를 통해 상승/하락 캔들 비율, 지배적인 방향, 평균 움직임을 한눈에 시각화할 수 있습니다. 이를 통해 기관들이 역사적으로 어떻게 행동했는지 를 이해하고, 빠르고 쉽게 분석을 보완할 수 있습니다. 참고: M30 (30분봉) 데이터는 시간 단위로 통합됩니다. 각 시간은 이를 구성하는 두 개의 30분봉 캔들의 움직임을 보여줍니다. 참고: 금속, 주식 및 지수 관련 일부 자산에서는 시장과 브로커가 항상 정확히
FREE

Fair Value Gaps (FVG) and Liquidity Voids are price ranges you can exploit for better entries and exits on your trades. They're similar concepts, so let's look at them from the top and break it down. Think of FVG and Liquidity voids as soft-spots in the market. They are paths of least resistance. That doesn't mean price will go through them, but price could go through them more easily.
To find and locate it is easy but tidiest to repeat the same thing all over again. This helps to boost your t
FREE

Классический индикатор фракталов является запаздывающим, т.к. для подтверждения образования фрактала необходимо ждать 2 бара. Если этого избежать, то индикатор будет перерисовывающим, т.е. при обновлении максимума/минимума в течении 2-х баров фрактал будет менять своё положение на более позднее. В данном продукте максимально нивелированы оба этих недостатка, при этом совмещены достоинства обоих подходов! Индикатор показывает фрактал сразу в момент его образования, а в случае его обновления показ
FREE

Session Range Lite is a free indicator for MetaTrader 5 (MT5) designed to automatically plot the Asian trading session High and Low on the chart. The indicator highlights the Asian session range and key price levels that are commonly used for breakout trading, retests, and intraday market structure analysis. Key features: Automatic calculation of Asian Session High and Low Clear session range visualization Horizontal High / Low levels Price labels with exact level values Stable behavior when scr
FREE
The ATR (Average True Range) Indicator is a powerful tool designed to measure market volatility. This indicator provides accurate data on price movement ranges, helping traders manage risk more effectively and make well-informed trading decisions. Based on the widely-used ATR indicator, it’s suitable for both professional and beginner traders to analyze market volatility. The ATR Indicator allows you to track the current price movement range and use this information to set stop-losses, select en
FREE

What are Donchian Channels? Donchian Channels are three lines generated by moving average calculations that comprise an indicator formed by upper and lower bands around a mid-range or median band. The upper band marks the highest price of a security over N periods while the lower band marks the lowest price of a security over N periods. The area between the upper and lower bands represents the Donchian Channel. Career futures trader Richard Donchian developed the indicator in the mid-twentieth c
FREE

Chronolines – Temporal Support and Resistance Levels for MetaTrader 5 Introduction to Chronolines
Chronolines is a graphical indicator designed to identify and visualize temporal support and resistance levels using the Highs and Lows of four predefined periods. It is compatible with all assets available on MetaTrader 5 , including stocks, currencies, commodities, indices, and cryptocurrencies, offering a logical and structured approach to tracking market behavior. Lines and Periods
Chronolines
FREE
GridLinesX is a lightweight and efficient utility for MetaTrader 5 designed to help traders visualize price levels with precision. Whether you are a Grid Trader, a Scalper, or simply need to mark psychological price levels, GridLinesX automates the process instantly. Forget about drawing manual horizontal lines one by one. Simply define your High/Low range and the grid step (in points), and the tool will generate a clean, customizable grid overlay on your chart. Key Features: Customizable Range:
FREE

Camarilla Swing Trade Indicator is an Indicator. Support and resistance points are calculated from the High Low Close of the previous TF Week's price.
What are Camarilla Pivot Points?
1.Camarilla Pivot Points is a modified version of the classic Pivot Point. 2.Camarilla Pivot Points was launched in 1989 by Nick Scott, a successful bond trader. 3.The basic idea behind Camarilla Pivot Points is that price tends to revert to its mean until it doesn't. 4.Camarilla Pivot Points is a mathematical pr
FREE
Regime Radar — Market Regimes + Bias Stops (MT5) Regime Radar shows the current market regime — Range, Weak Trend, Strong Trend, or Shock — and draws ATR-based stop lines on the chart. It also provides a compact panel with regime, direction, confidence and optional RSI/Bollinger suggestions. This is an analysis tool; it does not provide trading signals and does not guarantee any profit. Main functions Regime detection in four states (Range, Weak Trend, Strong Trend, Shock). Bias indicator with
FREE
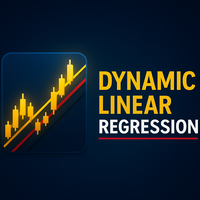
Linear Regression Channel (LRC) Indicator – Overview The Linear Regression Channel (LRC) indicator is a professional tool designed to display dynamic price channels around a regression trendline. It automatically adapts to market conditions, helping traders visualize price movement with clarity. Main Features : Regression-based central line with upper/lower channel boundaries. Fully customizable colors, styles, and levels. Optional labels and forward extensions for better chart visualizati
FREE

LongTerm — 중·장기 추세 방향 분석 지표 LongTerm 는 중·장기 추세의 강도와 질 을 해석하기 위해 설계된 방향성 분석 지표 로, 특히 롱(Long) 중심의 분석 에 초점을 맞추고 있습니다. 이 지표는 진입 신호용 지표가 아니며 , 운용 타이밍을 위한 도구도 아닙니다 .
단기 가격 변동에서 발생하는 노이즈를 줄이면서, 시장이 중·장기 롱 트렌드에 유리한지 불리한지 를 이해하도록 돕는 분석 도구입니다. 목적 LongTerm 의 주요 목적은 다음과 같습니다. 강하고 구조화된 롱 트렌드 식별 트렌드의 확장, 둔화, 소진 단계 구분 지배적인 방향성 컨텍스트 를 명확하게 제공 이는 스윙 트레이딩 과 중·장기 추세 분석 을 지향하는 트레이더에게 이상적인 도구입니다. 색상 해석 및 시장 상태 LongTerm 는 롱 트렌드의 다양한 단계를 직관적으로 읽을 수 있도록 설계된 색상 구조를 사용하여, 시장의 최적·최악의 조건 을 명확히 구분합니다. 녹색 라인 (상승 기울기
FREE
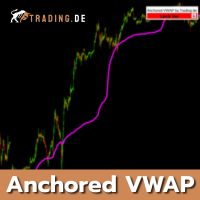
Specially developed Anchored VWAP for MetaTrader 5 (MT5) from Trading.de. To match our day trading strategy, you can place an Anchored VWAP in your chart. The Volume Weighted Average Price indicator can be adjusted in color and also fixed on the chart. It is possible to choose real volume as well as no real volume in the settings. The indicator is best suited for day trading in a 1-minute chart, as you learn in training at Trading.de.
You can use "E" on your Keyboad to lock/unlock the AVWAP, to

Crash 1000 Scalping Indicator for the Crash 1000 Deriv Synthetic Index. Introduction The Crash 1000 Scalping Indicator is a specialized tool designed for the Crash 1000 index on the Deriv Synthetic market. This indicator is particularly useful for scalping on the M1 timeframe, helping traders to identify precise entry and exit points for buy positions. It is designed to be non-repainting, providing clear signals with audible alerts and push notifications, and is compatible with mobile devices th

MACD is probably one of the most popular technical indicators out there. When the market is trending, it actually does a pretty good job, but when the market starts consolidating and moving sideways, the MACD performs not so well. SX Impulse MACD for MT4 is available here . Impulse MACD is a modified version of MACD that works very well for trading Forex, stocks, and cryptocurrencies. It has its own unique feature which perfectly filters out the values in a moving average range and enables it

The Quantitative Qualitative Estimation (QQE) indicator is derived from Wilder’s famous Relative Strength Index (RSI). In essence, the QQE is a heavily smoothed RSI.
Modification of this version: ( converted from tradingview script by Mihkell00, original from Glaz, 100% identical output)
So there are Two QQEs. One that is shown on the chart as columns, and the other "hidden" in the background which also has a 50 MA bollinger band acting as a zero line.
When both of them agree - you get a b

Good old UT BOT converted from TradingView script by ' QuantNomad ', initially by ' Yo_adriiiiaan ' and ' HPotter ' - so you can bet this is powerful tool. If you know, you know. This is top of the line, while keeping it really simple.
Main function: trend identification with trend switch points , created by EMA(source) and ATR -source is CLOSE PRICE with option to use HEIKEN ASHI chart instead, for this you need "Heiken Ashi" indicator - its available as free download by MetaQuotes
One of th
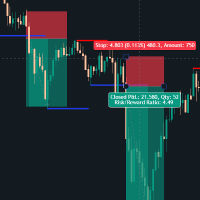
Support & Resistance Breakout Indicator This custom-built MT5 indicator automatically identifies key price levels where the market has historically reversed (support and resistance zones) and alerts traders when these levels are broken with conviction. What it does: The indicator scans price action to detect significant swing highs and lows, then draws dynamic support and resistance lines that extend forward until they're either replaced by a new level or broken by price. When a breakout occurs,

거래의 브레이크아웃을 강화하기 위해 Trendlines with Breaks by LuxAlgo MT5를 사용하세요. 이는 피벗 기반의 혁신적인 지표로, 동적 추세선을 자동으로 그리고 실시간 브레이크아웃을 강조하며, TradingView의 인기 LuxAlgo 스위트에서 유래하여 100,000회 이상 사용되고 긍정적인 리뷰를 받은 지지/저항 수준 탐색 정확성으로 평가됩니다. Reddit 및 YouTube와 같은 거래 커뮤니티에서 비재도색 옵션과 사용자 정의 기울기로 찬사를 받는 이 도구는 외환, 주식, 암호 트레이더에게 추세 반전과 지속을 포착하는 힘을 부여하며, 사용자들은 진입 타이밍 개선과 거짓 신호 감소를 보고—변동성 시장에서 승률을 10-20% 향상시키는 경우가 많습니다, 투기적 이동이 아닌 확인된 브레이크아웃에 집중함으로써. 그 이점에는 공격적 진입을 위한 브레이크아웃 포인트의 정확한 식별, 시장 조건에 맞는 적응형 추세선 경사, 지속 모니터링 없이 앞서 나가기 위한 통합 경
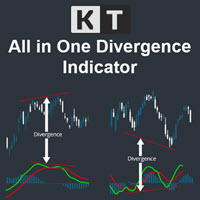
The KT All-In-One Divergence is designed to identify regular and hidden divergences between the price and 11 widely recognized oscillators. This powerful tool is indispensable for swiftly and accurately spotting market reversals. Its a must-have tool in any trader's arsenal, providing clear and accurate divergence patterns. Its accuracy and speed in identifying market reversals are remarkable, allowing traders to seize profitable opportunities confidently.
Features No Interference: You can ad

An indicator to draw a graph of account current and historical state such as Balance, Equity, Margin, Free Margin, Margin Level, Drawdown, Account Profit, Deposit and Withdrawals.
Indicator Inputs : Draw Balance Graph Draw Equity Graph Draw Margin Graph Draw Free Margin Graph Draw Margin Level Graph Draw Drawdown Graph Draw Account Profit Graph Hide Data on Chart and Buffers Connect Gaps by Lines Sign of DDs on Profit Sign of DDs on Loss
Tips : The Indicator will draw historical balance graph

Half-Trend Indicator for MetaTrader5
To download all of our products, you can click this link: LINK
Introduction The Half-Trend Indicator is one of the leading indicators in the market, which helps you enter your trades through the high, low, moving average and ATR.
Specifications platform metatrader5 (MT5) type custom technical trading indicator level beginner timeframes all timeframes from weekly to trading styles scalping - day trading - swing trading - position trading markets forex - cr

KT Custom High Low shows the most recent highs/lows by fetching the data points from multi-timeframes and then projecting them on a single chart. If two or more highs/lows are found at the same price, they are merged into a single level to declutter the charts.
Features
It is built with a sorting algorithm that declutters the charts by merging the duplicate values into a single value. Get Highs/Lows from multiple timeframes on a single chart without any fuss. Provide alerts when the current pri

Eabotpro Signals v3.0
A professional MetaTrader 5 indicator designed to deliver high-precision trading signals with real-time notifications, trade management tools, and a clean interface. "Recommended Base time frame is 4H Fibo From input . and trade time frame 1 mint , and 5 mint " Key Features: High-Accuracy Signals : Optimized for precision and consistency across different market conditions. Smart Trade Panel : Displays entry price, targets, stop levels, performance stats, and profit trackin
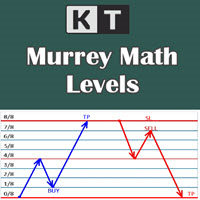
It shows the Murrey Math levels on chart and also provides an alert when price touch a particular level. T. Henning Murrey, in 1995, presented a trading system called Murrey Math Trading System, which is based on the observations made by W.D Gann.
Applications
For Murrey Math lovers, this is a must-have indicator in their arsenal. There is no need to be present on the screen all the time. Whenever the price touches a level, it will send an alert. Spot upcoming reversals in advance by speculatin

TickVelocity with Smart Alert : Real-Time Buyer vs Seller Speed Dominance **️ Discover the raw energy of the market with the TickVelocity with Smart Alert indicator. Go beyond standard volume and price action to measure the speed and momentum of price changes, revealing the true underlying dominance of buyers or sellers in real-time. This essential tool provides a clear, separate-window view of market dynamics and features a sophisticated Smart Alert System to catch explosive moves early!
FREE

Easy Correlations Indicator The Easy Correlations Indicator is designed to help traders analyze the relationship between two correlated instruments. By monitoring the distance between their Relative Strength Index (RSI) values, the indicator highlights situations where one instrument has moved significantly further than the other. This creates potential trading opportunities: Sell the stronger instrument (overstretched RSI) Buy the weaker instrument (lagging RSI) Because the positions are opened
FREE

Burning Scalper - Advanced MFI Trading System
Indicator Description
Burning Scalper is a comprehensive trading system based on an enhanced Money Flow Index (MFI) indicator, designed for precise identification of market entry and exit points. The indicator combines volume and price analysis, providing traders with a complete picture of market dynamics.
Key Features
Intelligent Trading Signals
The indicator automatically identifies optimal market entry points by analyzing extre
FREE

MT5 Version Dashboard: Free scanner to monitor All pairs and timeframes. Please contact me after purchase, i will send it to you! MT4 version indicator: https://www.mql5.com/en/market/product/59127 Tip: This is an indicator for real-time signal display. When the indicator is loaded and running on the chart, the past signal cannot be displayed Market structure changes as price reverses And filter with all import features built inside one tool. Breaker's smart algorithm detects the reverses,
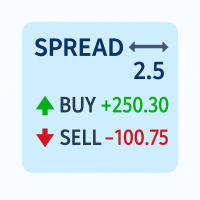
Track your spread and all position PnLs (Buy & Sell) in real-time – stay in control of your trades at a glance!
Features: Real-time spread display (in pips) Total Buy position PnL Total Sell position PnL Clean, non-intrusive display layout Works with all symbols and timeframes Perfect for: Scalpers needing quick spread awareness Day traders monitoring long/short performance Risk managers optimizing exposure No need to switch tabs or rely on external tools — everything you need is visible at
FREE
Spike Detector Rider – Intelligent Trading in Volatile Markets Introduction
The Spike Detector Rider is an advanced system for MetaTrader 5 designed to detect explosive price movements in high-volatility assets such as synthetic indices and commodities.
It combines volatility filters, trend analysis, and automated risk management to provide intelligent trade confirmations. After purchase, please send me a private message via MQL5 to receive the installation manual and setup instructions. Asset

Heikin Ashi RSI Indicator for MT5 (HARSI) Overview
The Heikin Ashi RSI (HARSI) indicator combines Heikin Ashi candle smoothing with RSI momentum analysis, providing a dual-layer view of price action and relative strength. It offers a clear visualization of market direction, RSI-based overbought and oversold conditions, and optional backtesting and alert systems for strategy validation and trade signal automation. How It Works
The indicator applies RSI values to Heikin Ashi calculations, creati

MT4 Version MA Ribbon MT5 MA Ribbon is an enhanced indicator with 8 moving averages of increasing periods. MA Ribbon is useful to recognize trend direction, reversals and continuation points in the market as well as potential entry, partial take profit and exit points. Entry points for long and shorts position can be found when the price entries or leaves the Ribbon, at retest or a defined number of MA crossovers. It offers a good combination with mostly any volume or momentun indicators to

QuantumAlert CCI Navigator is a free indicator available for MT4/MT5 platforms, its work is to provide "alerts" when the market is inside "overbought and oversold" regions in the form of "buy or sell" signals. This indicator comes with many customization options mentioned in the parameter section below, user can customise these parameters as needful. Join our MQL5 group , where we share important news and updates. You are also welcome to join our private channel as well, contact me for the pri
FREE

Super Strike — The Ultimate Trend Precision System
Super Strike is an advanced trend-following system that combines the proven accuracy of the SuperTrend algorithm with the filtering power of a dynamic Moving Average . Built for traders who demand precision and confidence, this indicator transforms raw price action into a clean, intuitive, and highly informative visual system — a complete framework for making smarter trading decisions.
At the heart of Super Strike lies a dynamic calculation o
FREE

이 지표는 사용자가 원하는 두 가지 색상 간의 부드러운 전환을 적용하여 차트의 외관을 완전히 변화시킬 수 있도록 설계되었습니다. 이 기능을 통해 차트의 배경에 매력적인 그래디언트를 추가하면 차트가 더욱 신선하고 현대적인 느낌을 주게 됩니다. 시각적으로 더 매력적인 차트를 만들어 거래를 할 때 더욱 쾌적한 경험을 제공할 것입니다. 지표가 차트에 첨부되면 현재 차트에 있는 모든 지표 창에 그래디언트가 자동으로 적용됩니다. 이후에 추가되는 새로운 지표 창에도 동일한 그래디언트 효과가 적용되므로, 모든 지표가 일관된 외관을 유지하게 됩니다. 이 지표를 한 번 사용해 보세요! 차트의 외관을 새롭게 변화시켜 더 매력적이고 눈에 띄는 거래 환경을 만들어 보세요. 그래픽적으로 개선된 차트는 거래에 대한 집중력을 높이고 더 나은 결정을 내리는 데 도움이 될 것입니다.
FREE

Free for now, price is going to be 30 USD at Jan 1. 2025.
Features: Pin Bar Detection : The indicator is designed to identify bullish and bearish pin bars based on specific criteria, including the relative size of the candle’s body and shadow, as well as the position of the candle's body in relation to the 38.2% Fibonacci level. Customizable Labels : Custom text is displayed above each identified bullish or bearish pin bar, such as "[38.2]" for bullish and "[-38.2]" for bearish, helping traders
FREE

This MT5 chart trend checker cuts through the noise of market volatility to provide a clearer picture of trends and price movements. It includes the following features that can provide more clarity during market assessments: 1 customizable multi-period moving average Optional Heikin-Ashi candles 3 switchable focus modes Distinct colors for easy analysis
Link to MT4 version: https://www.mql5.com/en/market/product/106708/
This indicator shows your preferred moving average from multiple time fram
FREE

The index makes it easy for traders to know the opening and closing times of global markets :
- Sidney - Tokyo - London - New York
Where it misleads each time zone and enables us to know the times of overlapping the markets when the liquidity is high.
To get more indicators and signals, follow us on the Telegram channel link
https://t.me/tuq98
Or our YouTube channel, which has explanations in Arabic and a technical analysis course
https://www.youtube.com/@SSFX1
FREE

This Supertrend strategy will allow you to enter a long or short from a supertrend trend change. Both ATR period and ATR multiplier are adjustable. If you check off "Change ATR Calculation Method" it will base the calculation off the S MA and give you slightly different results, which may work better depending on the asset. Be sure to enter slippage and commission into the properties to give you realistic results. If you want automatic trade with Supertrend indicator, please buy following pr
FREE

Description The Profit and Loss Indicator by Creative Tech Solutions is a robust and comprehensive tool designed to help traders monitor their trading performance in real-time. This indicator provides detailed metrics on profits and drawdowns, ensuring traders are always informed about their trading activities and performance. With customisable alerts and display settings, this indicator is an essential tool for any serious trader. Features Real-Time Metrics : Monitor profit and drawdown percent
FREE

The Hyper Force indicator, originally created in 1984 by David Weis, indicates in wave form the strength of a symbol's trend.
The bigger the wave, the stronger the trend.
Small waves mean weak trend or market without trend.
In a wave, the greater the difference between one bar and another, the stronger the trend.
When the distance between one bar and another begins to decrease, it means that the wave has started to lose its tendency.
So catching the wave with a strong force and going out w
FREE
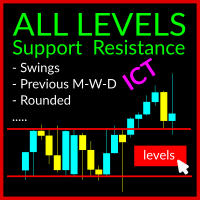
The Swing Levels Support and Resistance Indicator is a robust tool designed for MetaTrader 5 traders (also available for MT4). It aids in identifying crucial market levels where price direction may change by showcasing: Swing High and Swing Lows across all timeframes Previous Highs and Lows for Day, Week, and Month US Midnight level and Yesterday Midnight Level US Preopen 8:30 AM Level Rounded Levels This indicator features a toggle button, enabling you to display or hide these levels on the ch

분석 대시보드는 과거 및 현재 거래를 분석하고, 추가 원형 차트를 통해 세부 정보 보기로 볼 수 있는 분석 대시보드를 제공하는 지표입니다.
주로 네 가지 분석 범주가 고려됩니다. 1) 성과 지표 2) 거래 행동 지표 3) 실행 품질 지표 4) 포지션 수준 지표.
네 가지 일반적인 분석 지표는 아래와 같이 더욱 구체적인 지표로 세분화됩니다.
성과 지표:
총이익 총손실 전체 이익률 전체 기대수익률 전체 승률 평균 위험 보상률 최대 손실률 최대 상승률 이 모든 지표는 원형 차트를 통해 표시되는 차트별 지표도 있습니다.
거래 행동 지표:
총 거래 총 수익 총 손실 총 평균 보유 시간 사용된 평균 거래 규모 손절매로 중단된 총 거래 손절매로 중단된 총 거래 총 수동 손절매 이러한 지표는 사용된 평균 거래 규모를 제외하고 차트별로 표시됩니다.
실행 품질 지표:
평균 슬리피지 평균 진입 스프레드 평균 청산 스프레드 총 수수료 + 스왑 수수료 총 이익에 미치는 영향 총 손실에 미치
FREE

Moving Average Color
Moving Average (MA) is a trend indicator, which is a curved line that is calculated based on price changes. Accordingly, the moving average is the trader’s assistant, which confirms the trend. On the chart it looks like a bending line that repeats the price movement, but more smoothly. Moving Average Color it is a standard moving average indicator with a color change when the trend direction changes. The ability to set additional levels has also been added. It is a handy too
FREE

Keltner Channels Enhanced - Professional Indicator with Alerts
Full Description:
Keltner Channels Enhanced is a professional-grade technical indicator that brings the classic Keltner Channels to a new level with advanced features and complete customization.
KEY FEATURES
Advanced Calculation Exponential Moving Average (EMA) based middle line. Average True Range (ATR) for dynamic channel width. Customizable price type (Close, Open, High, Low, Median, Typical, Weighted). Horizontal shift o
FREE

This indicator is a straight port of a well known MetaTrader 4 indicator that is freely available on the Internet. It does not redraw at all. It implements a type of breakout strategy. The arrows indicate market direction. Use the indicator on M15 charts and higher. The indicator draws two bands near price action and generates signals when the price closes below the lower band and also above the upper band. The indicator uses periodic highs and lows to calculate upper and lower threshold bands.
FREE
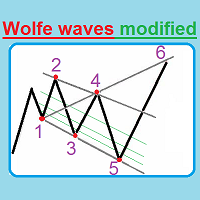
This unique indicator automatically builds Wolfe Waves and features a highly efficient trading strategy. Use If number 5 appears, wait till the first candle is closed behind Moving Average, then look at the three center lines showing what lot volume should be used if the fifth dot crossed the line 25%. The candle is closed behind Moving Average, and then we open a trade with the lot: = (Let's apply the lot of, say, (0.40), divide it into four parts and open a quarter of the lot (0.10)). If the

There is a science, named Quantitative Finance, that allows to study the financial derivative pricing models using the methods of theoretical and mathematical physics.
Lately I came across a paper that describes a new indicator for technical analysis that combines ideas from quantum physics and brings them to finance. I got interested in it and decided I would teach how to implement indicators based on a scientific papers in MQL5.
The original Moving Mini-Max paper [2] is written by Z.K. Silaga
FREE
Eight indicator for 3 day/session/week setups. Check out our other products for fxer.net:
https://www.mql5.com/en/market/product/114888
https://www.mql5.com/en/market/product/114890
Indicator daily features: Daily close/high/low Weekly open/high/low/close Tokyo/London/New York sessions Alerts Signals and alerts for First Green days First Red days Inside days Outside days 3x days of breakout up 3x days of breakouts down Do not be stupid and take every signal. Learn 3day setups first.
FREE

ICT, SMC, 스마트 머니 컨셉트(Smart Money Concept), 지지 및 저항(Support and Resistance), 추세 분석(Trend Analysis), 가격 행동(Price Action), 시장 구조(Market Structure), 주문 블록(Order Blocks), 브레이커 블록(Breaker Blocks), 모멘텀 변화(Momentum Shift), 강한 불균형(Strong Imbalance), HH/LL/HL/LH, 공정 가치 격차(Fair Value Gap), FVG, 프리미엄 및 디스카운트 영역(Premium & Discount Zones), 피보나치 리트레이스먼트(Fibonacci Retracement), OTE, 매수 측 유동성(Buyside Liquidity), 매도 측 유동성(Sellside Liquidity), 유동성 공백(Liquidity Voids), 시장 세션(Market Sessions), NDOG, NWOG, 실버 불릿(Silv

수익성 있는 시장 동향을 놓치는 데 지쳤습니까? 정확하고 정확하게 추세 지속을 식별할 수 있는 신뢰할 수 있는 도구를 원하십니까?
더 이상 보지 마세요! 당사의 Trend Continuation Indicator는 귀하의 거래 전략을 강화하고 게임에서 앞서 나갈 수 있도록 도와드립니다.
추세 지속 지표는 트레이더가 다양한 금융 시장에서 추세 지속 패턴을 식별하고 확인하는 데 도움을 주기 위해 특별히 제작된 강력한 도구입니다.
주식, 통화, 원자재 또는 지수를 거래할 때 이 지표는 거래 결정을 향상시키는 최고의 동반자입니다. MT4 버전 : WH Trend Continuation MT4
특징:
정확한 추세 확인. 사용자 정의 가능한 매개변수. 사용하기 쉬운 인터페이스. 실시간 알림. 포괄적인 지원. MT5용 Trend Continuation Indicator를 사용하여 거래 전략을 새로운 차원으로 끌어올리십시오. 추세 분석의 힘을 받아들이고 정보에 입각

The Hydra Multi Trend Dashboard is a powerful market scanning tool designed for MetaTrader 4 and MetaTrader 5. It monitors up to 25 currency pairs or assets simultaneously across all 9 standard timeframes (M1 to Monthly). Using a proprietary Special Trend Formula , the dashboard filters out market noise and provides clear, visual Bullish or Bearish signals, allowing traders to identify trend alignments at a glance without switching charts. Setup & Guide:
Download MT4 Version here. Follow our

Indicator for manual trading and technical analysis for Forex.
It consists of a trend indicator with the opening level of the trading day and a arrow indicator for determining entry points.
The indicator does not recolor; it works when the candle closes.
Contains several types of alerts for signal arrows.
Can be configured to work on any chart, trading instrument or time frame.
The work strategy is based on searching for price movements along the trend.
To make " Buy " transactions: The tre
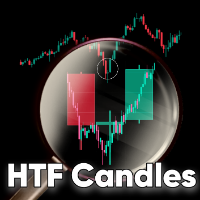
HTF Candles is an indicator which plots the outline of the higher time-frame candles on the lower candle. The indicator gives you the option to choose whether or not to view live current HTF candle, with no lag or repainting. Features No objects drawn on chart: The indicator does not plot any lines or rectangle objects on the chart, it simply draws the htf candles. This keeps your chart simple and clean. MTF Selection: The indicator allows you to choose all the different higher time-frames for e

CANDLESTICK_MT5
A very interesting indicator of candlestick patterns, converted from the free version of the CANDLESTICK indicator for the MetaTrader4 terminal to the version for the MetaTrader5 terminal. In addition to candlestick patterns, it draws support and resistance lines, which are perfectly worked out by the price on the chart. It can work on any timeframe. Has simple settings. When converting, the logic of work and the design of the original CANDLESTICK indicator for the MT4 terminal
FREE

I recommend you to read the product's blog (manual) from start to end so that it is clear from the beginning what the indicactor offers. This multi time frame and multi symbol indicator identifies double or triple top/bottom formations or a following neckline breakout (confirmed top/bottom). It offers RSI, pin bar, engulfing, tweezer, morning/evening star filters as well divergence filter options which makes it possible to filter out only the strongest setups. The indicator can also be used
MetaTrader 마켓은 개발자들이 거래 애플리케이션을 판매할 수 있는 간단하고 편리한 사이트이다.
제품을 게시하고 마켓용 제품 설명을 어떻게 준비하는가를 설명하는 데 도움이 됩니다. 마켓의 모든 애플리케이션은 암호화로 보호되며 구매자의 컴퓨터에서만 실행할 수 있습니다. 불법 복제는 불가능합니다.
트레이딩 기회를 놓치고 있어요:
- 무료 트레이딩 앱
- 복사용 8,000 이상의 시그널
- 금융 시장 개척을 위한 경제 뉴스
등록
로그인
계정이 없으시면, 가입하십시오
MQL5.com 웹사이트에 로그인을 하기 위해 쿠키를 허용하십시오.
브라우저에서 필요한 설정을 활성화하시지 않으면, 로그인할 수 없습니다.