YouTubeにあるマーケットチュートリアルビデオをご覧ください
ロボットや指標を購入する
仮想ホスティングで
EAを実行
EAを実行
ロボットや指標を購入前にテストする
マーケットで収入を得る
販売のためにプロダクトをプレゼンテーションする方法
MetaTrader 5のためのテクニカル指標 - 32

Good old UT BOT converted from TradingView script by ' QuantNomad ', initially by ' Yo_adriiiiaan ' and ' HPotter ' - so you can bet this is powerful tool. If you know, you know. This is top of the line, while keeping it really simple.
Main function: trend identification with trend switch points , created by EMA(source) and ATR -source is CLOSE PRICE with option to use HEIKEN ASHI chart instead, for this you need "Heiken Ashi" indicator - its available as free download by MetaQuotes
One of th
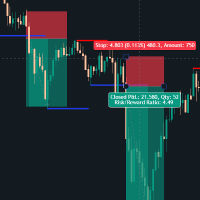
Support & Resistance Breakout Indicator This custom-built MT5 indicator automatically identifies key price levels where the market has historically reversed (support and resistance zones) and alerts traders when these levels are broken with conviction. What it does: The indicator scans price action to detect significant swing highs and lows, then draws dynamic support and resistance lines that extend forward until they're either replaced by a new level or broken by price. When a breakout occurs,
VWAP (Volume Weighted Average Price) is a technical analysis indicator that shows the average price of an asset, weighted by trading volume, over a specified time period. It is calculated by dividing the total dollar value traded (price × volume) by the total volume. Formula: VWAP = sum(PRICE*VOLUME)/sum(VOLUME)
MM vwap have 4 options to set anchor:
Month Week Day Session Indicator will be updated in future.
FREE
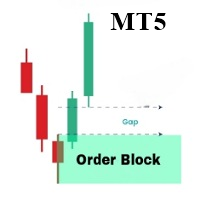
OrderBlock Analyzer は、MetaTrader 5 (MT5) 用にカスタマイズされたインジケーターで、価格チャート上のオーダーブロック(Order Blocks)を検出し、ハイライトします。このインジケーターは、市場の主要な構造を特定するのに役立ち、反転や継続の可能性のある領域を示します。OrderBlock Analyzer は、マーケットの動きに基づいて、自動的にオーダーブロックを描画し、上昇と下降のブロックを異なる色で区別します。 主な機能: 上昇および下降オーダーブロックの検出とマーキング。 グラフ上でリアルタイムにオーダーブロックを更新し、トレーディングのチャンスを迅速に特定します。 オーダーブロックの色、ボーダーライン、ラインスタイルのカスタマイズが可能です。 ボーダーラインの色と厚さの柔軟な設定。 このインジケーターは、トレンドや反転に基づいたトレーディング戦略を使用するすべてのタイプのトレーダーに最適です。

取引のブレイクアウトを強化するために、Trendlines with Breaks by LuxAlgo MT5を使用してください。これは、ピボットベースの革新的なインジケーターで、動的なトレンドラインを自動的に描画し、リアルタイムのブレイクアウトを強調します。TradingViewの人気LuxAlgoスイートから派生し、そこで100,000以上の使用とポジティブレビューを集め、サポート/レジスタンスレベルの検出精度で評価されています。RedditやYouTubeなどの取引コミュニティで、非再描画オプションとカスタマイズ可能なスロープで称賛され、このツールは外汇、株式、暗号トレーダーにトレンド反転と継続を捉える力を与え、ユーザーはエントリータイミングの改善と偽信号の減少を報告—ボラティル市場で勝率を10-20%向上させることが多いです、スペキュラティブな動きではなく確認されたブレイクアウトに焦点を当てることで。その利点には、アグレッシブなエントリーのためのブレイクアウトポイントの正確な識別、市場条件に適合する適応型トレンドラインの急峻度、常時監視なしで先を行く統合アラートが含まれ、スキ
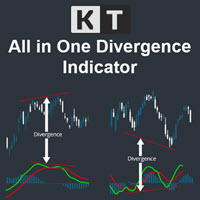
The KT All-In-One Divergence is designed to identify regular and hidden divergences between the price and 11 widely recognized oscillators. This powerful tool is indispensable for swiftly and accurately spotting market reversals. Its a must-have tool in any trader's arsenal, providing clear and accurate divergence patterns. Its accuracy and speed in identifying market reversals are remarkable, allowing traders to seize profitable opportunities confidently.
Features No Interference: You can ad

An indicator to draw a graph of account current and historical state such as Balance, Equity, Margin, Free Margin, Margin Level, Drawdown, Account Profit, Deposit and Withdrawals.
Indicator Inputs : Draw Balance Graph Draw Equity Graph Draw Margin Graph Draw Free Margin Graph Draw Margin Level Graph Draw Drawdown Graph Draw Account Profit Graph Hide Data on Chart and Buffers Connect Gaps by Lines Sign of DDs on Profit Sign of DDs on Loss
Tips : The Indicator will draw historical balance graph

KT Custom High Low shows the most recent highs/lows by fetching the data points from multi-timeframes and then projecting them on a single chart. If two or more highs/lows are found at the same price, they are merged into a single level to declutter the charts.
Features
It is built with a sorting algorithm that declutters the charts by merging the duplicate values into a single value. Get Highs/Lows from multiple timeframes on a single chart without any fuss. Provide alerts when the current pri

Golden_Star MT5 は、プロのトレーダーのグループによって開発されたMT5プラットフォームのプロのトレンドインジケーターです。 その作業のアルゴリズムは、元の著者の方法に基づいています。これにより、潜在的なトレンド反転ポイントを高い確率で見つけ、トレンド形成の開始時に市場に参入するためのシグナルを受信できます。 このインジケーターは、外国為替で金、暗号通貨、通貨ペアを処理するのに適しています。 アラートシステム(アラート、電子メール、モバイル通知)は、複数の取引商品を同時に監視するのに役立ちます。 チャートにインジケーターをインストールするだけで、インジケーター信号が表示されるとアラートがトリガーされます。 私たちのアラートシステムを使用すると、ポジションを開くためのシグナルを見逃すことはありません! Golden Starインジケーターを使用して取引するのは非常に簡単です。インジケーターラインが緑色の場合、買いポジションを開きます。 インジケーターラインが赤の場合は、売りポジションを開きます。
このインジケーターを購入すると、次のようになります。
優れたインジケーター信

Introduction to Double Harmonic Volatility Indicator Use of the Fibonacci analysis for financial trading can nearly go back to 85 years from today since the birth of Elliott Wave Theory by R. N. Elliott. Until now, traders use the Fibonacci analysis to identify the patterns in the price series. Yet, we could not find any one attempted to use Fibonacci analysis for the Volatility. Harmonic Volatility Indicator was the first technical analysis applying the Fibonacci analysis to the financial Volat
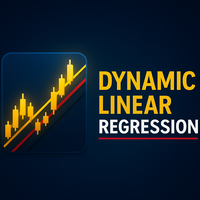
Linear Regression Channel (LRC) Indicator – Overview The Linear Regression Channel (LRC) indicator is a professional tool designed to display dynamic price channels around a regression trendline. It automatically adapts to market conditions, helping traders visualize price movement with clarity. Main Features : Regression-based central line with upper/lower channel boundaries. Fully customizable colors, styles, and levels. Optional labels and forward extensions for better chart visualizati
FREE
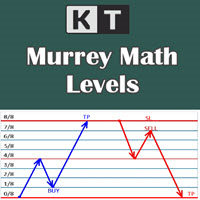
It shows the Murrey Math levels on chart and also provides an alert when price touch a particular level. T. Henning Murrey, in 1995, presented a trading system called Murrey Math Trading System, which is based on the observations made by W.D Gann.
Applications
For Murrey Math lovers, this is a must-have indicator in their arsenal. There is no need to be present on the screen all the time. Whenever the price touches a level, it will send an alert. Spot upcoming reversals in advance by speculatin

SummarySignalLine is an intelligent multi-indicator for MetaTrader 5 that combines signals from five classical technical indicators into a single smoothed signal line. The indicator visualizes overall market sentiment in a simple, intuitive format with color coding. Key Features Composite Analysis — combines MA, RSI, Bollinger Bands, Stochastic, and ATR Smoothed Signal — reduces market noise with configurable smoothing Visual Clarity — color gradient from green (bullish) to red (bearish)
FREE
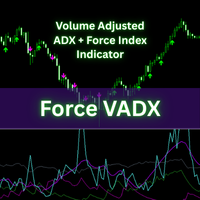
Force VADX Indicator Force VADX is an advanced, multi-factor indicator that fuses volume-adjusted trend strength, normalized force index, and adaptive directional signals. Designed for modern traders, it pinpoints high-confidence buy and sell zones, offering a robust technical foundation for both discretionary and automated trading.
Use this indicator in conjuntion with other tools for confirmation and confluene. This indicator is not intended to be a complete trading system but rather a tool
FREE

MT5 Version Dashboard: Free scanner to monitor All pairs and timeframes. Please contact me after purchase, i will send it to you! MT4 version indicator: https://www.mql5.com/en/market/product/59127 Tip: This is an indicator for real-time signal display. When the indicator is loaded and running on the chart, the past signal cannot be displayed Market structure changes as price reverses And filter with all import features built inside one tool. Breaker's smart algorithm detects the reverses,

Moving Average Sentiment "Transform Raw Market Data into Clear Sentiment Vision" Moving Average Sentiment is a next-generation adaptive trend sentiment indicator that visualizes the true bias of the market — bullish, bearish, or neutral — in real time. It combines Moving Average dynamics with ATR-based volatility zones , creating a fluid, self-adjusting sentiment curve that reacts instantly to price structure and volatility shifts. This tool goes beyond a simple MA — it reads the behavior of th
FREE

Spike Detector Rider – Intelligent Trading in Volatile Markets Introduction
The Spike Detector Rider is an advanced system for MetaTrader 5 designed to detect explosive price movements in high-volatility assets such as synthetic indices and commodities.
It combines volatility filters, trend analysis, and automated risk management to provide intelligent trade confirmations. After purchase, please send me a private message via MQL5 to receive the installation manual and setup instructions. Asset

前書き インベストメントキャッスルインジケーターは、以下の問題を解決することを期待して作成されました。
1.さまざまな時間枠でトレンドの正しい方向を決定します。
2.ヒット率、勝率をチャートに表示します。
3.このインジケーターはチャートを再描画しません。
4.このインジケーターは Investment Castle EA に組み込まれています。
*設定されたファイル、更新などについては、Webサイトをチェックしてください: https://www.investmentcastle.com
免責事項 「インベストメントキャッスルインジケーター」とその名前が付いたすべての製品は、トレーダーが取引をサポートするために使用できるツールとして明確に見なされるべきです。これを念頭に置いて、このツールがどれだけうまく機能するか、または効果的であるかは、トレーダーの入力や最適化に完全に依存します。
トレーダーとして、投資キャッスルインジケーターを使用する前に、まずデモまたはトライアルアカウントのさまざまなパラメーターの入力設定を徹底的にバックテストすることにより、投資キャッスルインジ
FREE

Heikin Ashi RSI Indicator for MT5 (HARSI) Overview
The Heikin Ashi RSI (HARSI) indicator combines Heikin Ashi candle smoothing with RSI momentum analysis, providing a dual-layer view of price action and relative strength. It offers a clear visualization of market direction, RSI-based overbought and oversold conditions, and optional backtesting and alert systems for strategy validation and trade signal automation. How It Works
The indicator applies RSI values to Heikin Ashi calculations, creati

Do you want to see the most relevant supports and resistances at a glance? Tired of tracing the levels by hand? Multi Levels Detector is an indicator for MetaTrader that will draw supports and resistances according to the parameters entered, and also offers the possibility of executing an alert every time the price reaches any of its levels.
SETTINGS UsePercentage: Allows you to configure whether the distances between levels will be measured in points, or by a percentage of the asset.
TimeFram
FREE

Volume Weighted Average Price (VWAP) is a trading benchmark commonly used by Big Players that gives the average price a Symbol has traded throughout the day. It is based on both Volume and price. This indicator contains Daily VWAP and MIDAS' VWAP, which means you are able to anchor the beggining of MIDAS' calculations and, therefore you will be able to use this methodology to study price versus volume moves after anchor point. You will be able to anchor up to 3 HIGH MIDAS VWAP's and 3 LOW.
Wish
FREE

Identification of support and resistance areas
A useful indicator for traders
completely free
Can be used in all symbols
Can be used in all time frames
It has three different trends: short term, medium term, long term
Settings:
Clr1,2: You can change the color of the lines
Type Trend: You can determine the trend
Message me for questions, criticism and suggestions
FREE

Quantopro Plus: Skyrocket Your Trading Success Unleash the power of precision with Quantopro , the ultimate trading indicator for MetaTrader 5 that transforms market chaos into profitable opportunities. Engineered with a cutting-edge proprietary formula, Quantopro delivers crystal-clear buy and sell signals, empowering traders of all levels to dominate the markets with confidence. Why Choose Quantopro? Dynamic Signal Painting : Instantly spot high-probability trades with vivid, real-time signals
FREE

Key Takeaways This timer does not lag like other timer indicators Show the time end of candlesticks and spread Hide or Show Spread depending on user needs Works on all timeframes Adjust Text Size Adjust Text Color Adjust Text Font
If you love this indicator, please leave a positive rating and comment, it will be a source of motivation to help me create more products <3
FREE

If you love this indicator, please leave a positive rating and comment, it will be a source of motivation to help me create more products <3 How to use Slope Direction Line Uptrend: When the SDL line slopes up and turns from red to green, it shows that the price is trending up. This is also considered a buy signal. Downtrend: When the SDL line slopes down and turns from green to red, it shows that the price is trending down. This is also considered a sell signal. Sideways: When the SDL line mo
FREE
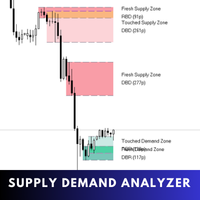
Supply Demand Analyzer is an advanced trading indicator meticulously designed for the precise identification, analysis, and management of supply and demand zones. By integrating real-time data and advanced algorithms, this tool enables traders to recognize market phases, price movements, and structural patterns with unparalleled accuracy. It simplifies complex market dynamics into actionable insights, empowering traders to anticipate market behavior, identify trading opportunities, and make in

Magnified Price Experience trading like never before with our Magnified Price indicator by BokaroTraderFx , designed exclusively for MetaTrader 5. This revolutionary tool provides traders with instant insights into price movements, offering a clear advantage in today's fast-paced markets.
Key Features: 1. Real-time Precision: Instantly magnify price action to uncover hidden trends and patterns. 2. Enhanced Visibility: Clear visualization of price movements with adjustable zoom levels. 3. User
FREE

This is the latest offering from tr1cky.com. This is a session time indicator with customisable start and finish times. The indicator draws a vertical coloured line at the start and finish of the three institutional trading time zones. The session colours are as follows: Tokyo - Red London - Green New York - Blue Times are in Coordinated Universal Time (UTC)
FREE

The Supertrend indicator is a very versatile and and accurate trend detection system. It can also be used an an reversal indicator. Therefor you can use it either as entry or as an exit signal. Depending on your settings it is also good for trend confirmation. This version is slightly enhanced from the original version from mladen. The Supertrend of Averages Histogram Version contains: 11 different price options Averaging period
18 different averaging types ATR period and ATR multiplier Shows re
FREE

BullBear Strength Meter The BullBear Strength Meter is a dynamic market sentiment and momentum indicator that quantifies the real balance of power between buyers and sellers. Instead of relying on a single formula, it fuses multiple proven analytical engines into one comprehensive strength model — giving traders an accurate visual readout of bullish and bearish dominance in real time. This tool measures, compares, and displays the intensity of market forces using advanced statistical and trend-b
FREE

This indicator will show a vertical representation of the volume distribution within a selected user range.
This is a free version of the full product. It is limited to use on a week old data or older. Find the full product at https://www.mql5.com/en/market/product/42234 .
Main features: This Indicator will create an image that will allow viewing the tick volume per price level in a graphical form. The indicator will work on any range size in any time-frame, limited only by your computer mem
FREE
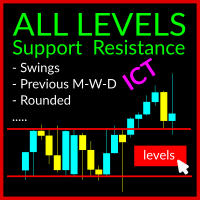
The Swing Levels Support and Resistance Indicator is a robust tool designed for MetaTrader 5 traders (also available for MT4). It aids in identifying crucial market levels where price direction may change by showcasing: Swing High and Swing Lows across all timeframes Previous Highs and Lows for Day, Week, and Month US Midnight level and Yesterday Midnight Level US Preopen 8:30 AM Level Rounded Levels This indicator features a toggle button, enabling you to display or hide these levels on the ch

This indicator displays the remaining time of the current candle, providing a visual representation of the time left until the candle closes and a new one begins, helping traders to make more informed decisions and stay on top of market fluctuations with precise timing, enhancing their overall trading experience and strategy execution, and allowing them to optimize their trades and maximize their profits.
FREE
Time Dashboard MT5 is a powerful and user-friendly MetaTrader 5 indicator designed to provide real-time time zone and clock information directly on your trading chart. Ideal for forex traders and global market participants, this tool displays server time, local time, and the time difference between them, enhancing your ability to manage trades across different time zones. Key Features : Real-Time Time Display : Shows current server time, local time, and their respective time zones with precise o
FREE

The Multi Pairs Forex Indicator is an advanced trading too l that allows traders to track and analyze the performance of multiple currency pairs in real-time on a single chart. It consolidates data from various Forex pairs, providing an at-a-glance overview of market conditions across different currencies and helps you save time. Useful for various trading styles, including scalping, day trading, and swing trading. Whether you're monitoring major pairs like EUR/USD, GBP/USD, or more exoti

Ulimate MTF Support & Resistance - 5 Star Best Seller New Year Sale - save $20 (normal price $79) Beginner or Professional our best selling multi-timeframe Pivot Prof will enhance your trading and bring you great trade opportunities with the Support and Resistance levels that professionals use. Pivot trading is a simple effective method for entering and exiting the market at key levels and has been used by professionals for decades and works on all symbols: Forex, Crypto, Stocks, Indicies et
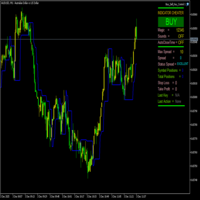
FractalBreakoutLevels 概要:
このインジケーターは、価格変動の分析に基づいて動的な価格レベルをプロットします。過去の価格データを組み合わせて、取引の参考となる重要なレベルを特定します。 動作原理:
このインジケーターは、現在および過去の価格データの関係を分析して市場構造を調べます。変化する市場条件に適応する連続的なラインを描画し、動的なサポート/レジスタンスレベルとして機能します。 レベル形成の原理: インジケーターは複数の連続したバーにわたる分析を組み合わせて使用します レベルは特定の価格関係の下で形成されます 明確なシグナルがない場合、インジケーターは以前の値を保持して連続的なラインを作成します 技術仕様: 価格チャート上で直接動作します 連続的なレベル(青いライン)をプロットします 外部設定はなく、標準的な価格データで動作します 過去の値を再描画しません 応用:
このインジケーターは次の目的で使用できます: 潜在的なサポート/レジスタンスレベルの特定 可能性のあるトレンド反転ポイントの検出 プロットされたレベルに対するストップロスレベルの設定 ブレイク
FREE
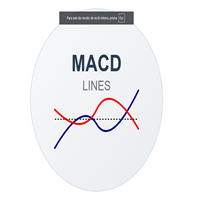
MACD Lines - Indicador MACD com Visualização em Linhas Descrição Este é um indicador MACD (Moving Average Convergence Divergence) modificado que apresenta uma visualização mais limpa e elegante em comparação com o MACD padrão do MT5. A principal diferença é que ele remove o histograma tradicional e mantém apenas as linhas MACD e Signal, permitindo uma melhor visualização dos cruzamentos e tendências. Características Principais Linha MACD em azul escuro com espessura 2 Linha Signal em vermelho co
FREE

If you like this product, please give it a 5 star rating as a token of appreciation.
This indicator calculates and draws pivot points and support/resistance levels for both daily and weekly timeframes: Pivot (central) level Support levels S1, S2, S3 Resistance levels R1, R2, R3 It allows showing daily, weekly, or both sets of pivots , giving traders visual references for potential support/resistance areas.
Pivot mode: Choose which pivots to display (weekly, daily, or both). Colors and style: C
FREE

ICT(情報通信技術)、SMC(スマートマネーコンセプト)、サポートとレジスタンス、トレンド分析、価格アクション、市場構造、オーダーブロック、ブレーカーブロック、モメンタムシフト、強い不均衡、HH/LL/HL/LH、公正な価値ギャップ、FVG、プレミアム&ディスカウントゾーン、フィボナッチリトレースメント、OTE、バイサイド流動性、セルサイド流動性、流動性の空白、市場セッション、NDOG、NWOG、シルバーバレット、ICTテンプレート
金融市場では、正確な市場分析は投資家にとって重要です。市場のトレンドや流動性をより良く理解するために、高度な市場分析のためのユーザーマニュアルを提供しています。以下は、いくつかの機能とその実装方法の簡単な紹介です:
1. 高時間枠の市場構造の表示:
パラメータを設定することで、チャート上に高時間枠の市場構造を表示することができます。これにより、全体的な市場のトレンドと構造をより良く理解することができます。必要に応じて時間枠をカスタマイズし、市場構造をチャート上に表示することができます。
2. 流動性の表示:
流動性は市場で重要な指

収益性の高い市場トレンドを逃すことにうんざりしていませんか?トレンドの継続を正確に識別できる信頼できるツールがあればいいのにと思いませんか?
これ以上探さない!私たちのトレンド継続インジケーターは、あなたの取引戦略を強化し、ゲームの先を行くのに役立ちます。
トレンド継続インジケーターは、トレーダーがさまざまな金融市場におけるトレンド継続パターンを特定して確認できるようにするために特別に作成された強力なツールです。
株、通貨、商品、指数のいずれを取引する場合でも、このインジケーターは取引の意思決定を強化するための究極の相棒です。
MT4バージョン: WH Trend Continuation MT4
特徴:
正確な トレンド確認. カスタマイズ可能な パラメータ. 使い やすい インターフェイス. リアルタイム アラート. 包括的な サポート . MT5 のトレンド継続インジケーターを使用して、取引戦略を新たな高みに引き上げましょう。トレンド分析の力を活用し、情報に基づいた取引の意思決定を行い、潜在的な利益の世界を解き放ちます。チャンスを逃さないように – 今すぐトレンド継

The Hydra Multi Trend Dashboard is a powerful market scanning tool designed for MetaTrader 4 and MetaTrader 5. It monitors up to 25 currency pairs or assets simultaneously across all 9 standard timeframes (M1 to Monthly). Using a proprietary Special Trend Formula , the dashboard filters out market noise and provides clear, visual Bullish or Bearish signals, allowing traders to identify trend alignments at a glance without switching charts. Setup & Guide:
Download MT4 Version here. Follow our

Indicator for manual trading and technical analysis for Forex.
It consists of a trend indicator with the opening level of the trading day and a arrow indicator for determining entry points.
The indicator does not recolor; it works when the candle closes.
Contains several types of alerts for signal arrows.
Can be configured to work on any chart, trading instrument or time frame.
The work strategy is based on searching for price movements along the trend.
To make " Buy " transactions: The tre

Mouse Calculation は、マウスで指した価格で決済した場合の各注文の損益を素早く計算します。 グリッド、マーチン、分割エントリーなど、複数注文の運用で素早い判断に最適です。回本価格(損益分岐)や目標価格がひと目で分かります。 主な機能 Mouse PnL (M) :注文ごとの損益と合計損益を表示(swap を含む)。 Break even Price (B) :全体の回本価格/損益分岐ラインを表示。 Time_Sync_Lines (T) :直近 N 日の同時刻を揃えて比較;ドラッグで重要局面を振り返り。 Panel (P) :操作パネルの表示/非表示。 About (A) :使い方と情報。 チャート上の表示 B / S :注文の現在損益 M :マウス価格で決済した場合の「決済損益」推定 T :合計損益 おすすめの場面 グリッド :全体の利確水準を素早く決定。 マーチン :どこまで戻れば回本/プラスになるかを素早く確認。 複数注文 :部分決済や調整が直感的に。 パラメータ sync_lines :Time_Sync_Lines の縦線本数(初期値 8)
(その他は色/表
FREE
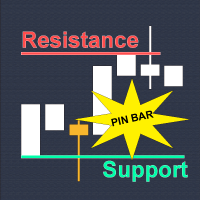
Why Technical Indicators Don't Work?
Many traders lose money because of lagging indicator crossovers and fake breakouts. Indicators are rearview mirrors. They're all just pretty math equations of PAST data. Would you drive forward while staring at your rearview mirror? Absolutely NO. The "Holy Grail" indicator doesn't exist. Price Action Decoding: How Smart Money REALLY Trades?
The market don't care about your indicators, analyze price action instead, e.g. the principles of ICT, SMC, and other
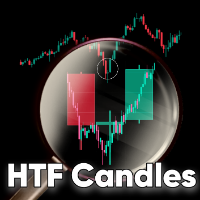
HTF Candles is an indicator which plots the outline of the higher time-frame candles on the lower candle. The indicator gives you the option to choose whether or not to view live current HTF candle, with no lag or repainting. Features No objects drawn on chart: The indicator does not plot any lines or rectangle objects on the chart, it simply draws the htf candles. This keeps your chart simple and clean. MTF Selection: The indicator allows you to choose all the different higher time-frames for e
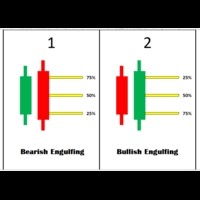
Engulfing Levels Indicator – Smart Entry Zones for High-Probability Trades Overview:
The Engulfing Levels Indicator is designed to help traders identify key price levels where potential reversals or trend continuations can occur. This powerful tool combines Engulfing Candle Patterns , Percentage-Based Levels (25%, 50%, 75%) , and Daily Bias Analysis to create high-probability trading zones . Key Features:
Engulfing Pattern Detection – Automatically identifies Bullish and Bearish Engulf
FREE
The MTF Support/Resistance & Trendline Analyzer is a powerful multi-timeframe indicator that automatically detects key support and resistance levels , draws dynamic trendlines , and provides a real-time market structure dashboard — all in one clean, lightweight display. It combines fractal logic and price action detection across three timeframes to give you a unified view of market direction and structure. Whether you trade reversals, breakouts, or trends, this tool highlights the zones that mat
FREE

O Indicador valida a força da tendência utilizando o volume negociado. Os candles são mostrados na cor verde indicando força compradora e cor vermelha na força vendedora. O movimento é encerrado pelo SAR parabólico. Vantagens: Filtra distorções de preço sem volume financeiro; Filtra consolidações e movimentos laterais; Filtra divergências de volume pelo indicador Money Flow. Desvantagens: Não filtra todos os falsos rompimentos, visto que rompimentos importantes geram altos volumes financeiros; N
FREE

The Fisher Transform is a technical indicator created by John F. Ehlers that converts prices into a Gaussian normal distribution. The indicator highlights when prices have moved to an extreme, based on recent prices. This may help in spotting turning points in the price of an asset. It also helps show the trend and isolate the price waves within a trend. The Fisher Transform is a technical indicator that normalizes asset prices, thus making turning points in price clearer. Takeaways Turning poi
FREE

I recommend you to read the product's blog (manual) from start to end so that it is clear from the beginning what the indicactor offers. This multi time frame and multi symbol indicator identifies double or triple top/bottom formations or a following neckline breakout (confirmed top/bottom). It offers RSI, pin bar, engulfing, tweezer, morning/evening star filters as well divergence filter options which makes it possible to filter out only the strongest setups. The indicator can also be used

Revolution Martingale is an indicator designed for trading binary options on the M5 timeframe. Features: M5 Timeframe: It is recommended to use the indicator on the M5 timeframe for optimal trading. Trade Entry: Trades should only be opened on the first candle after a signal appears. Signals: A blue diamond indicates a buying opportunity for upward movement, while a red diamond indicates a buying opportunity for downward movement. Configured for Effective Binary Options Trading: The indicator i
FREE

MACD Pro – MACD Indicator for MetaTrader 5 Description
MACD Pro is a Moving Average Convergence Divergence (MACD) indicator for MetaTrader 5. It follows the standard MACD calculation method and displays trend direction and momentum in a separate indicator window. Indicator Elements MACD line based on the difference between fast and slow exponential moving averages Signal line calculated as an exponential moving average of the MACD line Histogram showing the difference between the MACD and signa
FREE

Crypto_Forex インジケーター「平滑化トレンドヒストグラム」MT5 用、再描画なし。
- 平滑化トレンドヒストグラムインジケーターは、標準的な移動平均クロスよりもはるかに効率的です。 - 特に大きなトレンドの検出に重点を置いています。 - インジケーターには 2 つの色があります。赤は弱気の下降トレンド、緑は強気の上昇トレンドです (色は設定で変更できます)。 - モバイルおよび PC アラート付き。 - このインジケーターを他の取引方法と組み合わせるのは素晴らしいアイデアです。プライスアクション、スキャルピング、モメンタム取引、その他のインジケーター。
高品質のトレーディングロボットとインジケーターをご覧になるにはここをクリックしてください! これは、このMQL5ウェブサイトでのみ提供されるオリジナル製品です。

Currency Strength Meter is the easiest way to identify strong and weak currencies. This indicator shows the relative strength of 8 major currencies + Gold: AUD, CAD, CHF, EUR, GBP, JPY, NZD, USD, XAU. Gold symbol can be changed to other symbols like XAG, XAU etc.
By default the strength value is normalised to the range from 0 to 100 for RSI algorithm: The value above 60 means strong currency; The value below 40 means weak currency;
This indicator needs the history data of all 28 major currency

PipVenom - Advanced ATR Trailing Stop Signal Indicator for MT5 Professional Visual Trading System with Real-Time Dashboard OVERVIEW PipVenom is a sophisticated visual trading indicator designed for MT5 that combines ATR Trailing Stop methodology with EMA crossover signals to identify high-probability trade entries. Built with precision and clarity in mind, this indicator provides crystal-clear visual signals with automatic Stop Loss and Take Profit levels displayed directly on your chart. P
FREE
トレンド取引とは、トレーダーが価格の主要な動きの方向にポジションに入り、トレンドが変化するまでそれを維持する戦略です。 Anti EMA は、このような取引で役立つツールになる可能性があります。なぜなら、それは長期的な価格データに焦点を当て、持続的な動きを見つけ、短期的な変動による偽のシグナルを避けるからです。
Anti EMAの通常の移動平均線(SMAやEMAなど)との主な違いの一つは、ウェイトの分布にあります。標準的な移動平均線では、ウェイトが均等に分布したり、過去に向かって減少したりして、最近の価格に敏感になります。一方、Anti EMAは古い価格に大きなウェイトを、新しい価格に小さなウェイトを割り当てます。これにより、市場のノイズにあまり反応せず、歴史的な文脈をより良く反映したラインが作成されます。例えば、トレンドが形成され始めたばかりの場合、通常のEMAはスパイクに素早く反応しますが、このインジケーターは過去をより考慮して、動きが本当に持続的であることを確認します。
実践では、これはインジケーターがノイズをフィルタリングし、真のトレンドを強調することを意味します。価格が
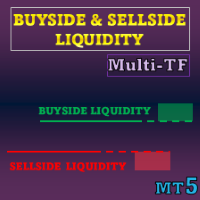
特別オファー : すべてのツール 、各 $35 。 新ツール は 最初の1週間 または 最初の3件の購入 まで $30 です! MQL5 の Trading Tools チャンネル :最新情報を受け取るには私の MQL5 チャンネルに参加してください 本インジケーターは 流動性レベル および 流動性ゾーン を ICT コンセプト に基づいて可視化し、さらに一方向の価格変動を強調する Liquidity Voids を表示します。ストップ注文や指値注文が集まりやすい箇所と、価格がそこを通過した後の推移に焦点を当てます。
MT5 版はこちら: Buyside and Sellside Liquidity MT5 Multi Timeframe MT4 版はこちら: Buyside and Sellside Liquidity MT4 Multi Timeframe その他の製品: All P roducts 主なポイント • カラー分けされたレベルとゾーンにより、双方向の流動性構造(buyside/sellside)を明確化 • レベル

**Experience Smarter Trading with FVG Super Signal**
Unlock simpler, more decisive trading with **FVG Super Signal**, an advanced MT5 indicator from the WinWiFi Robot Series. This powerful tool uniquely combines the Fair Value Gap (FVG) technique with robust trend-following logic.
* **Clear Signals:** Delivers intuitive Buy/Sell alerts, simplifying your trading decisions. * **Universal Compatibility:** Works seamlessly across all assets and timeframes. * **Highly Versatile:** Ideal for all tr
FREE

Convenient drawing of parabolic channels by four points (two lower and two upper extremums). Additional control keys: N (New) - Start drawing a new channel. C (Clear) - Deletes the current channel. By default, the current channel is the last channel. But you can click on the line of any channel to make it current. Click on the gear in the upper right corner to set some parameters for all channels or the current channel. All work is visible from the animated Gif.
Do not forget to express your w
FREE

Introducing the Fair Value Gap Indicator : A Simple and Effective Trading Tool The Fair Value Gap Indicator is designed to help traders easily identify and utilize Fair Value Gaps (FVGs) in their trading strategies. FVGs highlight price imbalances that the market often revisits, offering potential trade entry or exit opportunities. Whether you're a beginner or an experienced trader, this indicator simplifies the process of spotting these valuable zones, allowing you to trade with clarity and co
FREE

HiperCube VIX へようこそ Darwinex Zero 25%割引コード: DWZ2328770MGM この指標は、sp500 / us500 の市場のボリュームに関する実際の情報を提供します
定義 CBOE ボラティリティ インデックスとして知られる HiperCube VIX は、市場の恐怖やストレスを測る広く認知された指標です。株式市場の不確実性とボラティリティのレベルを示し、S&P 500 インデックスを広範な市場の代理として使用します。VIX インデックスは、S&P 500 インデックスのオプション契約の価格に基づいて計算されます。
機能: カスタムカラー カスタムチャートカラー メイングラフを明瞭に保つためにサブウィンドウにインジケーターを表示 解釈が簡単 完全にカスタマイズ可能 Chat gptとAIが開発に使用されました
使用例: VIX は実際の市場に関する優れた情報を提供するボリュームインジケーターです。このインジケーターの値が高いということは、ボラティリティが高いことを意味します ボラティリティが高いということは、市場の動きにアプローチし、市場
FREE
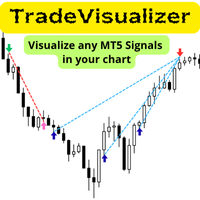
Trade Visualizer インジケーターは、取引データを視覚化し、MT5チャート上にすべての取引履歴を直接表示します。自分のパフォーマンスを分析する場合も、MQL5のシグナル提供者の取引を研究する場合も、このツールは生データを分かりやすいビジュアルに変換します。各トレードはエントリーとエグジットの矢印、接続ライン、価格・利益・ロット数・pipsなどのツールチップで示されます。 注: インジケーターをダウンロードした方は、メールアドレスを添えてご連絡ください。 Trade Visualizer Template を無料でお送りします。 特徴:
• 最新版 ProTrading Analytics Excel Template v1.7 と完全連携。
• 複数トレーダー・戦略を同一銘柄上で比較可能。
• 売買ごとの色・線のスタイル・矢印サイズを自由に設定。
• CSVとブローカーのGMT差を自動調整。
• 複数ブローカーのシンボル接尾辞に対応。
• 戦略ロジックやエントリー精度の可視分析に最適。
FREE
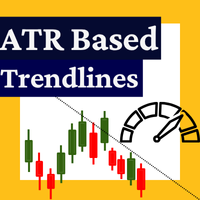
このインジケーターは、TradingViewの「ATR Based Trendlines - JD」by DuyckをMetaTrader 5用に変換したバージョンです。 特徴:
価格だけでなくATRで測定したボラティリティも考慮してトレンドラインを自動的に描画します。トレンドラインの角度はATR(の一定割合)によって決定されます。 ライン角度は、ピボットポイントが検出された時点のATR値に基づいて価格変動に追随します。ATRパーセンテージ設定により、ATR変化率(100%)、その分数(<100%)、または倍数(>100%)を追従します。 入力パラメータ:
・Lookback depth:ピボット検出に使用するローソク足の数
・ATR target percentage:トレンドライン方向へのATR感度
・Draw lines from wicks or real bodies:ピボット計算に実体/ヒゲのどちらを使用するか
・トレンドライン方向(上昇/下降/両方)
・全トレンドライン表示の有無
・表示ライン最大数('Show all trendlines'無効時)
・上昇/下降トレンド
FREE

A simple volume indicator according to the color of the candle!
- Custom background!
- Supports Volume by Ticks or Real Volume.
The original Metatrader Volume indicator does not show the colors of the bar according to the color of the Candle, it only changes color when the volume of a candle is greater than the previous one, this sometimes creates confusion for beginners and does not know the real reason for the color change.
Free indicator, support may take a while to respond!
FREE

Kindly rate and comment about the product for upgradation & Support
The 5 EMA is plotted in green color ( Lime ).
The 14 EMA is plotted in red color ( Red ).
The 20 EMA is plotted in blue color ( Blue ).
The 200 EMA is plotted in yellow color ( Yellow ).
The Quarter EMA that provided calculates and plots four Exponential Moving Averages (EMAs) on the chart using different periods: 5, 14, 20, and 200. Each EMA is represented by a different color on the chart. Here's a description of each EMA:
FREE
MrGoldTrend is a sophisticated trend-following indicator designed exclusively for XAUUSD (Gold) traders on the MQL5 platform. With clear, easy-to-interpret visual signals, this indicator helps you quickly identify the prevailing trend and make informed trading decisions on the H1 timeframe. MrGoldTrend’s gold lines indicate an uptrend, while blue lines signify a downtrend, providing immediate visual clarity for trend direction. Key Features: Clear Trend Visualization : Gold lines for uptrends, b
FREE

Smart Market Structure & Momentum Suite Professional Trading Indicator – Price Will Increase Soon This indicator is a high-end market structure and momentum analysis system built for serious traders who want precision, logic, and consistency in their trading decisions. ️ The current price is temporary and will increase very soon. Core Features Momentum & MACD Intelligence MACD High & Low Fractals Momentum shifts aligned with price action Early detection of trend continuation and rever
FREE

指数移動平均(ダブルまたはトリプル)エンベロープインジケーターは、金融市場でのトレンドと潜在的な反転ポイントを特定するのに役立つ技術分析ツールです。このインジケーターは、トレーダーがダブル指数移動平均(DEMA)またはトリプル指数移動平均(TEMA)の2つのタイプの指数移動平均から選択できる柔軟性を提供します。
主要な特徴:
ダブルまたはトリプル指数:DEMAとTEMAを選択して、分析の好みやニーズに基づいて切り替えます。 カスタマイズ可能なエンベロープ:バンド幅のパラメータを定義し、トレーディングスタイルに合わせてエンベロープの外観を調整できます。 トレンドの識別:エンベロープは市場トレンドを視覚化するのに役立ち、上昇トレンドと下降トレンドを特定しやすくします。 潜在的な反転ポイント:価格がエンベロープに触れることで、潜在的な反転ポイントを示すことがあり、情報を元に判断できます。 ユーザーフレンドリー:このインジケーターはMetaTrader 5プラットフォームで簡単にインストールおよび使用できます。 このインジケーターを今すぐ無料でダウンロードして、MetaTrader 5でのテ
FREE

Multi-timeframe trend indicator based on the ADX / ADXWilder indicator with Fibonacci levels
The indicator shows trend areas using ADX or ADXWilder indicator data from multiple timeframes. The impulse mode of the indicator allows you to catch the beginning of a trend, and several "Screens" with different timeframes allow you to filter out market noise. Fibonacci levels are added to the price chart, which have flexible settings.
How the indicator works: if PDI is greater than NDI, then it`s
FREE
MetaTraderマーケットが取引戦略とテクニカル指標を販売するための最適な場所である理由をご存じですか?宣伝もソフトウェア保護も必要なく、支払いのトラブルもないことです。これらはすべて、MetaTraderマーケットで提供されます。
取引の機会を逃しています。
- 無料取引アプリ
- 8千を超えるシグナルをコピー
- 金融ニュースで金融マーケットを探索
新規登録
ログイン