VWAP Level
- Indikatoren
-
Francesco Lenza
 Zero DrawDown is a community of non-professional traders who didactically analyze the financial markets under the guidance of Frankie Lenza.
Join our DISCORD community for free from this link: - Version: 1.0
Der VWAP-Level-Indikator ist ein technisches Analyseinstrument, das den gewichteten Durchschnittspreis für das gehandelte Volumen eines bestimmten Vermögenswerts berechnet. Der VWAP liefert Händlern und Anlegern den Durchschnittspreis eines Vermögenswerts über einen bestimmten Zeitraum.
Er wird häufig von Anlegern verwendet, um Daten zu "passiven" Handelsgeschäften wie Pensionsfonds und Investmentfonds zu vergleichen, aber auch von Händlern, die überprüfen wollen, ob ein Vermögenswert zu einem guten Marktpreis gekauft oder verkauft wurde.
Zur Berechnung des VWAP-Niveaus wird folgende Gleichung verwendet:
VWAP = ∑ (Anzahl der gekauften Vermögenswerte x Preis des Vermögenswerts) / Anzahl der an einem einzigen Handelstag gekauften Aktien.
Der VWAP wird in der Regel berechnet, um das Gesamtvolumen der Intraday-Geschäfte zu messen, kann aber auch für die Analyse längerer Zeiträume verwendet werden.
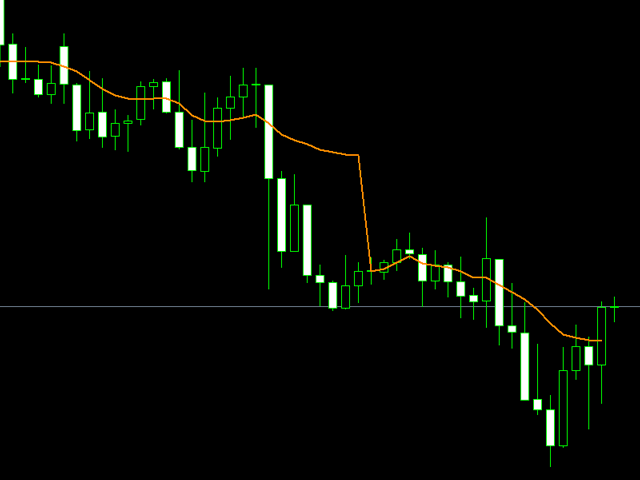
Der VWAP-Durchschnitt wird in den Diagrammen durch eine Linie dargestellt.
Da es sich um einen Intraday-Indikator handelt, wird er nur bei niedrigen Zeitrahmen angezeigt.
VWAP-Durchschnitte werden im algorithmischen oder automatisierten Handel verwendet, um Händlern und Anlegern zu helfen, den günstigsten Kauf- oder Verkaufspreis eines Vermögenswerts auf der Grundlage des Handelsvolumens des Marktes zu ermitteln. Je höher das Liquiditätsniveau eines Vermögenswerts ist, desto geringer sind die Handelskosten und desto besser ist die Ausführung.
Der VWAP-Level-Indikator wird in der Intraday-Strategie Zero DrawDown als Preis verwendet, um den Handel kostendeckend zu gestalten oder einen Teilgewinn mitzunehmen.


TOP