Смотри обучающее видео по маркету на YouTube
Как купить торгового робота или индикатор
Запусти робота на
виртуальном хостинге
виртуальном хостинге
Протестируй индикатор/робота перед покупкой
Хочешь зарабатывать в Маркете?
Как подать продукт, чтобы его покупали
Технические индикаторы для MetaTrader 4 - 11
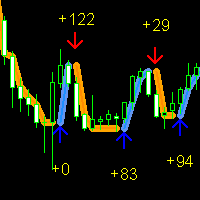
Forex Gump Signal - новый индикатор из серии ForexGump. Этот индикатор, в отличии от других, определяет точки разворота цены с помощью математического вычисления скорости стандартного мувинга. Когда скорость мувинга замедляется, индикатор интерпретирует это как сигнал на разворот тренда. Это позволяет индикатору улавливать даже самые незначительные точки разворота цены. Для того, чтобы индикатор начал анализировать более крупные точки разворота, необходимо уменьшить параметр "first_slowdown" и у

MP Squeeze Momentum is a volatility and momentum indicator derivated of "TTM Squeeze" volatility indicator introduced by John Carter. It capitalizes on the tendency for price to break out strongly after consolidating in a tight range. Introduction: The volatility component of MP Squeeze Momentum measures price compression using Bollinger Bands and Keltner Channels. If the Bollinger Bands are completely enclosed within the Keltner Channels, that indicates a period of very low volatility. This st
FREE

BREAKOUT-SESSION-BOX ЛОНДОН ЕС США АЗИЯ Открытый
Ожидание волатильного движения выше или ниже диапазона открытия Мы берем максимум диапазона в качестве входа в длинную сделку, а стоп-лосс будет минимумом диапазона. и наоборот, минимум диапазона как вход для короткой сделки и максимум для SL. Размер диапазона - это расстояние до TP (Take Profit) Диапазон часов работы не должен превышать примерно 1/3 среднего дневного диапазона. 4 примера прорыва уже предопределены: Азия, Франкфурт, Лондон, США.
FREE

Calculation of Lot Size for many traders is a big challenge.
A case that is very important in money management. What many traders ignore.
Choosing an appropriate Lot Size in trades can improve results and it will ultimately lead to success.
This indicator calculates the authorized Lot Size for your trades.
The indicator uses the following values to get the appropriate Lot Size for positioning:
The distance of Stop Loss.
The Pip Value.
The amount of Risk Allowed For Each Trade.
The amoun
FREE

Этот индикатор может отправлять предупреждения, когда происходит изменение цвета Heiken Ashi Smoothed. В сочетании с вашими собственными правилами и методами этот индикатор позволит вам создать (или улучшить) вашу собственную мощную систему. Функции Может отправлять все типы предупреждений. Возможность отложить оповещение на один бар, чтобы подтвердить изменение цвета (тренда). Входные параметры Дождитесь закрытия свечи: 'правда или ложь'. Установка для него значения «истина» задержит пред
FREE

Long-Term Supply Demand Indicator – Description
The Long-Term Supply Demand Indicator is a professional MT4 tool designed for traders who want to track higher-timeframe support and resistance zones on lower timeframes. It identifies supply and demand areas formed on the H4 timeframe and displays them clearly on M15, M5, and M1 charts, giving traders a precise view of key market zones across multiple timeframes.
The indicator provides alerts when a new supply or demand zone is formed, allowing
FREE
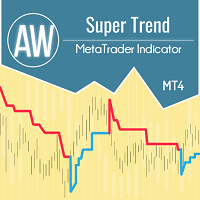
AW Super Trend - Это один из наиболее популярных классических трендовых индикаторов. Имеет простую настройку, позволяет работать не только по тренду, но и отображает уровень стоплосса, который рассчитывается данным индикатором.
Преимущества:
Инструменты: Валютные пары , акции, сырьевые товары, индексы, криптовалюты. Таймфрейм: М15 и выше. Время торговли: Круглосуточно. Показывает направление текущей тенденции. Ведет расчет стоплосса. Может быть использован при работе с трейдингом. Три
FREE
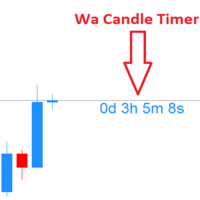
Wa Candle Timer MT4 — это мощный и удобный индикатор, предназначенный для отображения оставшегося времени до формирования следующей свечи на графике MT4. Этот инструмент помогает трейдерам отслеживать время закрытия свечей и принимать более точные торговые решения. Ключевые функции :
Отображение обратного отсчета текущей свечи
Изменение цвета при снижении оставшегося времени ниже заданного порога
Новое в версии 3.00: Настраиваемое оповещение при достижении определенного процента
Полн
FREE
This is a powerful, session-aware breakout indicator designed for serious traders who thrive on volatility and structure. Engineered for precision, it identifies high-probability breakout zones during the London and New York trading sessions—where the market moves with intent. Key Features: Session Range Detection
Automatically detects and highlights the key price range of London and New York sessions. Breakout Confirmation
Identifies breakout candles after the session range, with cl
FREE

EZ Risk Reward Ratio — это простой в использовании индикатор MT4, который позволяет пользователю автоматически изменять соотношение риска и вознаграждения для открытой сделки, просто перетаскивая линии тейк-профита или стоп-лосса в желаемые позиции на любом графике. Соотношение риска и вознаграждения отображается в любом углу, и его можно изменить, просто перетащив линии TP и SL. Сначала поместите индикатор EZ Risk Reward Ratio на график MT4, где должна быть размещена сделка. Во-вторых, откройте
FREE

The Pipsometer Pro Indicator is an essential, minimalist tool designed for the disciplined trader who requires immediate, at-a-glance financial feedback. It functions as a dedicated, real-time display that continuously calculates and shows your current floating profit or loss, measured exclusively in **pips**, for every open trade on the active chart. This focus on pips rather than monetary value allows traders to assess market performance and price movement directly, stripping away the emotion
FREE

Модифицированный осциллятор MACD. Классический индикатор, соединяющий в себе трендовый индикатор с осциллятором для обнаружения точек входа. Имеет мультитаймфреймовую панель, а также 3 типа уведомлений
Преимущества:
Работает на всех инструментах и таймсериях Трендовый индикатор с осциллятором для входов Мультипериодная панель на всех таймфреймах Подключаемые стрелки при появлении сигналов Три типа уведомлений: push, email, alert
MT5 версия -> ЗДЕСЬ / Наши новости -> ЗДЕСЬ
Как работать:
FREE
Вариант знаменитых полос Боллинджера, следующих за трендом и использующих скользящую среднюю и стандартное отклонение, чтобы определить направление тренда и момент его смены. Полосы Боллинджера обычно используются только как индикатор перекупленности/перепроданности, но, на мой взгляд, их можно применять и в стратегии выхода. Простота торговли Настраиваемые цвета и размеры Не перерисовывается, не меняет значений Отлично подходит в качестве трейлинг-стопа Доступны все типы алертов
Настройки При
FREE

KT Quick Risk Calculator is a professional utility tool for MetaTrader 4. It is designed to improve your workflow by providing instant calculations using an interactive measuring tool.
[Main Function] This tool allows you to interactively measure the distance between two points on the chart and immediately see the potential result in your account currency based on a fixed lot size.
[Key Features] 1. Smart Interaction: Hold [Ctrl] + Drag Left Mouse Button to measure. 2. Instant Data: Displays
FREE
Other profitable programs https://www.mql5.com/en/users/ifyjava/seller Индикатор FNCD представляет собой продвинутый инструмент технического анализа, который объединяет преобразование Фишера со статистической нормализацией цен для создания сложного осциллятора. Основа начинается с Z-оценки нормализации, где ценовые данные стандартизируются путем вычисления того, на сколько стандартных отклонений текущая цена отстоит от своего скользящего среднего за определенный период. Этот процесс нормализац
FREE

Flag Pattern Indicator - Your Guide to Flagging Profitable Trade Setups Welcome to the world of precision trading with the "Flag Pattern Indicator." Designed for MetaTrader, this powerful tool is your go-to solution for identifying one of the most reliable and versatile chart patterns in technical analysis: the flag pattern. Whether you're a seasoned trader or just starting, this indicator simplifies the process of spotting flag patterns, giving you an edge in your trading decisions. Key Feature
FREE
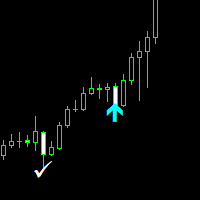
Nasdaq Savages Non-repaint indicator works on all timeframes 1 minute to 15 minutes timeframe for scalpers. 30 Minutes to Monthly timeframe for swing traders The Nasdaq Savages indicator comes with a top right info tab which tells you about the current buy or sell signal, Profit in pips, Stop loss and Target Red arrow is your sell entry signal the white right tick is your exit signal and take profit hit signal Light blue arrow is your buy entry signal the white right tick is your exit signal an
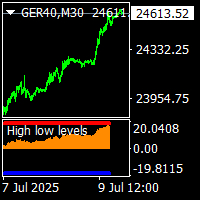
on demo mode, use date for testing. for people purchase thise indicator, there is bonus price chanell indicator . high low levels indicator is non repaint trend reversal indicator.and works all pairs and all timeframes. there is a histogram move up and down. and there is a level red and blue. when histogram reach the up red level that is top.and reversal is possible. when histogram down and reach blue level that is prices oversold and possible reversal up. this indicator suitable for beginners a

The Supreme HmaSignal indicator is an indicator for trend trading , its main character is the hull moving average colored line , and secondary is buy and sell arrows , arrows are fair but the main focus is on the colored hma , this indicator does not repaint or back paint or delay its signals. if you like this indicator please check my Supreme Trendhisto: here , and my Supreme Diamond indicator : here
Parameters: HMA Period HMA Smoothing HMA Price (close/open) Signal Period (Arrows)
FREE

Super Entry — это универсальный индикатор стрелочного типа, в котором он дает только длинные и короткие сигналы, а также уровни tp и sl, которые основаны на значении ATR и могут быть изменены и настроены. Этот индикатор предоставляет панель тестирования на истории, которая показывает винрейт и другую статистику для дать четкое представление о том, какой точности следует ожидать.
этот индикатор не перерисовывается и не перерисовывается, и сигнал об открытии бара поступает без задержки.
Парамет

Tipu Heikin-Ashi Panel - это модифицированная версия оригинального индикатора Heiken Ashi, опубликованного MetaQuotes здесь . Профессиональная версия индикатора доступна здесь .
Особенности Это простая в использовании панель, которая отображает тренд Heiken Ashi на выбранном таймфрейме. Настраиваемые алерты Buy/Sell, push-уведомления, сообщения по email и визуальные оповещения на экране. Настраиваемая Панель. Панель можно разместить в любом месте графика или свернуть, чтобы освободить пространс
FREE
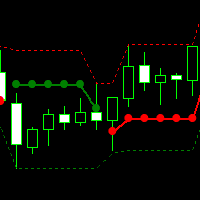
This technical indicator is particularly suitable for short-term traders, as it can quickly reflect the starting point and reversal of the trend. The red beads represent the rise and the green beads represent the fall, which can clearly and timely reflect the current market situation. The source code price can be calculated separately. If you need it, please contact us

CONGESTION BREAKOUT PRO
This indicator scans the breakout of congestion zones . This indicator unlike any other congestion indicator you will find in the market right now, it uses an advanced algorithm not peculiar to most traditional congestion indicators available today . The advanced algorithm used to define the congestions is greatly responsible for the high rate real congestion zones and low rate fake congestion zones spotted by this product.
UNDERSTANDING CONGESTION
Congestion are ar

Индикатор отображает профили объёма по принципу вложенности. Периоды профилей предустановлены так, что каждый последующий профиль имеет протяжённость вдвое большую, чем протяжённость предыдущего профиля. Помимо профилей индикатор отображает кластеры объёма, отсортированные по цвету, в зависимости от содержащегося в них объёма.
Особенности работы индикатора Индикатор работает на типовых таймфреймах от M5 до MN, но для вычислений использует исторические данные меньших таймфреймов: M1 - для таймфр
FREE

BeST Oscillators Collection is a Composite MT4 Indicator including the Chaikin,Chande and TRIX Oscillators which by default are contained in MT5 but not in MT4 platform. It also provides the option of displaying or not a Mov. Avg. as a Signal Line and the resulting Signals as Arrows in a Normal (all arrows) or in a Reverse Mode (without showing up any resulting successive and of same type arrows). Analytically for each one of the specific Oscillators: The Chaikin Oscillator ( CHO ) is
FREE

Accurate Signal ARC is a non-repainting trend & reversal signal indicator designed for MT4 .
It uses ATR-weighted volatility logic combined with adaptive price channels to detect high-probability BUY and SELL points directly on the chart. How It Works Calculates a dynamic volatility channel using weighted ATR Detects trend direction (river state) and switches only when price decisively breaks the channel Filters noise using spread-aware true range Draws clear arrows : Lime Arrow → BUY si
FREE
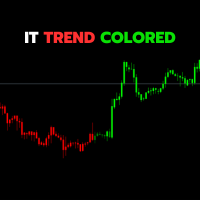
The IT Trend Colored indicator is a powerful tool designed by IT Trading (InfiniteTrades Software Corp) to assist traders in visually and effectively identifying market trends. This version is a custom indicator for the MetaTrader 4 trading platform.
Key Features:
• Trend Identification: The indicator uses a combination of simple moving averages (SMA) to determine the direction of the market trend.
• Intuitive Coloring: Upward trends are represented by bold green histograms, downward trends
FREE
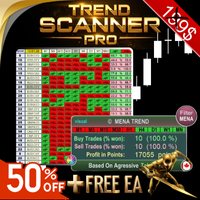
Trend Scanner PRO First of all, it’s worth emphasizing that this trading system is 100% Non-Repainting, Non-Redrawing, and Non-Lagging ,
which makes it ideal for both manual and algorithmic trading setups. Online course, user manual, and downloadable presets included. The Trend Scanner Dashboard is a professional multi pair scanner that analyzes multiple symbols and timeframes at once, giving you an instant market scanner view of the real trend direction. Instead of switching ch

Trading System Double Trend - самостоятельная торговая ситема, состоящая из нескольких индикаторов. Определяет направление общего тренда и дает сигналы в направлении движения цены.
Можно использовать для скальпинга, торговли внутри дня или недели.
Возможности
Работает на любых тайм-фреймах и торговых инструментах(форекс, криптовалюты, металлы, акции, индексы.) Простое визуальное чтение информации не загружающей график Индикатор не перерисовывается и не достраивает сигналы Работает только по з

RT_TrendlineTool : Semi-AutoTrendline Tool on MT4 2 easy steps, just press the [T] button on your keyboard and click on the Swing High/Low that you're interested.
Then the indicator will try to draw a trendline that runs through only the wick, not cut through candlestick's body
and try to cross the swing point as much as possible with the least slope of the trendline. You can draw up to 10 trendlines.
You are able to get alert when price breakout these trendlines. Additional Hotkey : Press [M]
FREE

Gorilla Channel VZ – это канальный индикатор, доработанный на основе многолетних наблюдений . Сигнальный торговый индикатор можно использовать как в качестве индикатора, отображающего трендовый канал, так и в качестве одного из источника сигналов на вход, при условии дополнительной фильтрации. При должном подходе минимум 80% успешных сделок. Основные характеристики Gorilla Channel VZ : Аналитические функции Может использоваться на любых валютных парах и тайм-фреймах; Индикатор не пер
FREE
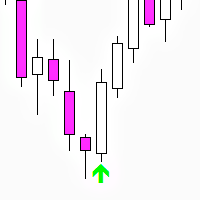
Three Bar Reversal (MT4) — бесплатный индикатор Three Bar Reversal — это простой и эффективный индикатор для MetaTrader 4, распознающий классическую разворотную свечную формацию из трёх баров с дополнительной фильтрацией по ATR и размерам тел свечей.
Стрелки отображаются на последней закрытой свече паттерна, а также отправляются push-уведомления. На основе этого индикатора разработан автоматический советник Three Bar Reversal EA . Индикатор работает на всех валютных парах и таймфреймах, н
FREE
MTF Chart PRO: Мульти-таймфреймовый анализ с паттернами, уровнями S/R и алертами Обзор MTF Chart PRO — это продвинутый индикатор для MetaTrader 4, который накладывает на текущий график настраиваемые свечи из разных таймфреймов, позволяя выполнять мульти-таймфреймовый (MTF) анализ без переключения окон. Идеально подходит для трейдеров на форексе, фондовом рынке и в криптовалютах. Индикатор сочетает визуальное отображение свечей с встроенными уровнями поддержки/сопротивления (S/R), автоматическими
ALGO BOX – Advanced Day Trading System ALGO BOX is a powerful day trading indicator designed for serious traders who demand precision and reliability in breakout trading. Combining advanced price action analysis with real-time data, it helps you spot high-probability trades while keeping risk under control. Why ALGO BOX Stands Out Identify clear, profitable breakout opportunities Reduce false signals for better trade accuracy Track your trading performance with live stats Make smart, data-driven
FREE

Ваш успех как трейдера зависит от умения определять состояния перекупленности и перепроданности валюты или символа. То есть их силу или слабость. Именно этот подход и лежит в основе торговли на рынке Forex. Сделать это быстро и просто самому было бы практически невозможно, не будь индикатора Quantum Currency Strength - слишком много валют и символов. Вам определенно понадобится помощь! Индикатор Quantum Currency Strength был создан с единственной целью: дать вам глобальную картину по восьми осно

Market Profile 3 MetaTrader 4 indicator — is a classic Market Profile implementation that can show the price density over time, outlining the most important price levels, value area, and control value of a given trading session. This indicator can be attached to timeframes between M1 and D1 and will show the Market Profile for daily, weekly, monthly, or even intraday sessions. Lower timeframes offer higher precision. Higher timeframes are recommended for better visibility. It is also possible t
FREE

BeST_Gann Hi-Lo Strategy is an MT4 indicator that is based on the Gann Hi-Lo Activator the famous trend-following indicator that allow us to to enter a trade quite early while also stay in a trade as longer as we can for taking profit.While it is built of a moving average it helps traders determine the direction of the trends and to produce with-trend trading signals.
This indicator is in fact a simple moving average of the highs and lows of the previous period. It follows the trends in the mark
FREE

УР Моментер
UR Momenter отлично рассчитывает моментум цены в зависимости от исчерпания ценового движения, представленного в виде осциллятора. Следовательно, это дает нам действительно ранние сигналы потенциальных разворотов или откатов. Эта формула была открыта в 2018 году после того, как лопнул рыночный пузырь.
Преимущества использования UR Momenter:
Нет параметров У вас есть 2 линии, которые описывают движение цены - Белая линия, которая представляет собой моментум цены в соотношении с о

The MACD Signal Candle indicator changes color according to the MACD trends. Colored Candles, based on MACD.
HOW IT WORKS
For a Buy: -If the indicator is above zero, the market is bullish. -If the market is bullish, you can take a stand with green candle signals. For a Sell: -If the indicator is below zero, the market is bearish. -If the market is bearish, you can take a stand with the red candles.
FREE

Показывает стрелками точки разворота цены. Работает на всех таймфреймах и всех валютных парах. Подходит как для скальпинга, так и для долгосрочной торговли. Когда появляется синяя стрелка, нужно открывать ордер на покупку. Когда появляется красная стрелка, нужно открывать ордер на продажу. Рекомендуемые таймфреймы M5, M15, H1, H4. Лучшие результаты индикатор показывает на GBPUSD, XAUUSD, EURUSD, USDJPY, AUDUSD, USDCHF, EURGBP, EURJPY, EURCHF и другие основные пары. Этот индикатор хорошо подходи

Индикатор EasyWay TradePanel для МТ4 - это торговые помощники для ручной торговли любой валютой на Форекс и Криптовалутой как Биткойн, Етериум, Лайткойн и другими. Также EasyWay можно использовать для Золата,Сребра и Акции,Петрол . При установке на график в выбранном вами таймфрейме и торговом инструменте индикатор автоматически рисует следующие пользовательские индикаторы, используемые в торговой стратегии EasyWayTradePanel.
1) Zigzag_Extreme_Indicator, 2) Regression_Channel_Indicator, 3) Buy
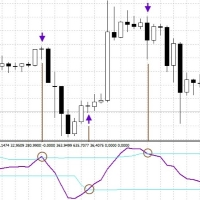
Cyclic Smoothed Relative Strength Indicator
The cyclic smoothed RSI indicator is an enhancement of the classic RSI, adding
additional smoothing according to the market vibration,
adaptive upper and lower bands according to the cyclic memory and
using the current dominant cycle length as input for the indicator. The cRSI is used like a standard indicator. The chart highlights trading signals where the signal line crosses above or below the adaptive lower/upper bands. It is much more responsive
FREE

Ranging Market Detector scans the market for momentum and price to check whether the price is range- bound and the direction to which it will breakout. It works with all the all assets and visually shows you the instances when the market is either ranging or trending. Informs when the price has finished a retracement, an opportune time to re-enter the trend early. This will help you in position management. It works very well for Scalping, Day trading, and Swing trading. Helpful in all timefra
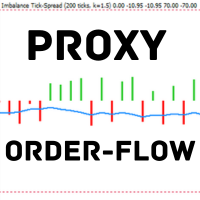
Индикатор на основе дисбаланса тик-спреда. TF:
Работает на всех таймфреймах (от M1 до D1). Пары:
Совместим с Forex, индексами, золотом и CFD (автоматическая настройка для инструментов JPY, Gold, CFD). Параметры: TickWindow (200) – окно наблюдения тиков SpreadWeight (1.5) – вес спреда NormalizationPeriod (20) – период нормализации (z-score) Overbought / Oversold (±3.0) – уровни оповещения AlertCooldown (300s) – интервал между оповещениями Заключение:
Proxy Order Flow – Imbalance Tick-Spread v2
Double top and bottom indicator is a pattern scanning indicator which scans the tops and bottoms using zig zag pattern. When it find price bouncing back from the same point twice after a long trend then it generate arrow signals whenever the last resistance points is broken for double bottom and last support price broken for double top. Unlike other top bottom scanner it does not give only 1 signal. it alerts user when ever the last support /resistance is broker from double top/bottom pattern un
FREE

Индикатор анализирует указанное количество свечей и строит уровни Фибоначчи на основе максимума-минимума. Поскольку уровни перестраиваются, то нас интересует правая часть диапазона. Цена магнитит к уровням и реагирует на касание. Используйте этот инструмент для поиска точки входа по тренду после коррекции. Если слева мы видим, что уровни идеально встали, то мы можем предположить, что нашли окончание движения в крайней точке. Все линии прорисовываются через буферы или объекты (на выбор).
Входные
FREE
What Is the Currency Strength Meter? The Currency Strength Meter is an advanced yet easy-to-use indicator that measures the relative strength of 8 major currencies by analyzing their real-time performance across 28 currency pairs .
It visually ranks currencies from strongest to weakest, helping you: Spot high-probability trading opportunities
Match strong currencies against weak ones
Trade with confidence and precision
With just a glance at the dashboard, you'll know which currencies to trade –

Unlock Precision Trading with Pinpoint Extreme Swing! Are you tired of missing out on crucial market reversals? Do you wish you had a reliable tool to spot high-probability swing trading opportunities? Look no further! The Pinpoint Extreme Swing indicator is your ultimate partner in navigating the dynamic world of trading, designed to give you the edge you need to succeed. This powerful MQL4 indicator is engineered to identify significant market turning points by intelligently combining the Mon
FREE
Индикатор " Signal histogram scalper" это повальный индикатор в виде гистограммы и сигналов без перерисовки и запаздывания. Индикатор " Signal histogram scalper" показывает на графике наиболее лучшие точки входа по тренду. Лучше его использовать в паре с другими трендовыми индикаторами в качестве фильтра. Индикатор показывает хорошие результаты на таймфрейме М5 Сигнал генерируется после закрытия свечи и появляется в виде кругляшков зелёного и красного цвета. Индикатор " Signal histogram scalper

MTF Fair Value Gaps Alerts indicator is based on Fair Value Gaps (FVG), Volume imbalance (VI) and Gaps. This indicator will create 2 arrows pointing to the left showing the area of the FVG, VI and Gaps and will never repaint after the candle has been closed .
Inputs: TF (Timeframe of the Alert For Current timeframe use CURRENT)
barshilft : the barshift needs to be the same timeframe as the above TF. barshift format (CURRENT, M1, M5, M15, M30, H1, H4, D1, W1, MN) Send Email: Audible Alert Push N
FREE

Stochastic RSI Indicator - Master the Art of Timing Elevate your trading game with the "Stochastic RSI Indicator." This powerful tool marries the Stochastic oscillator with the Relative Strength Index (RSI), offering precise insights into market dynamics. It's your key to mastering the art of timing in trading. About the Indicator : The Stochastic RSI Indicator combines two robust indicators - Stochastic and RSI - to provide traders with an exceptional tool for identifying entry and exit points
FREE

Умная торговая система . Все таймфреймы, валюты, криптовалюты, металлы... Весь MT4, любые экраны и шаблоны настраиваются автоматически. Новичок просто будет торговать по сигналу. Параметры уникального гибкого алгоритма открыты в настройках.
Идея 1: Помимо «КУПИТЬ/ПРОДАТЬ», в экстремумах подаются сигналы «ПОЛУЧИТЬ ПРИБЫЛЬ». Такая тактика увеличивает результат – вы получаете максимальную прибыль и совершаете больше сделок. Если сработал «Тейк-профит» или «Стоп-лосс», или если вы закрыли сд
Custom Spread Indicator *Please write a review, thanks!
Also MT5 version is available
Spread Indicator show the current spread in pips with color codes. Handle 3 levels, Low, Medium, High. You can set levels and colors for each level (eg. Low: Green, Medium: Orange, High: Red), and can choose display position on the chart.
There is two spread calculation mode: -> Server spread value -> Ask - Bid value
Can set opacity, for better customization. When spread jump bigger, then display do not
FREE
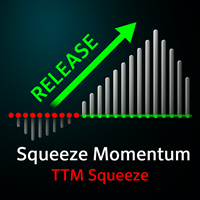
MT5 Version TTM Squeeze Momentum
TTM Squeeze Momentum is an enhanced indicator ideal for recognizing consolidation periods in the market and the start of the next explosive move. This improved version is a volatility indicator based on John Carter's "TTM Squeeze" in which the histogram is based on a linear regression rather than a simple momentum indicator. Red dots on the middle line indicate that the market has entered a "Squeeze" zone or consolidation period, indicated in this enhanced versi

Pips Hunter PRO разрабатывался в течение нескольких лет и является улучшенной версией своего предшественника. Этот мощный индикатор анализирует рынок и историю цен, чтобы генерировать входы на покупку и продажу. Для расчета этих входов он использует различные индикаторы, которые работают вместе, а также сложный статистический логарифм, который отфильтровывает менее благоприятные входы и устраняет их / MT5 версия .
Особенности Отсутствие перерисовки
Данный индикатор не меняет свои значения при
FREE
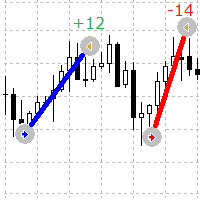
Простой но полезный индикатор, который визуализирует точки входа и выхода ордеров на графике Данный индикатор показывает как текущие открытые ордера на выбранном инструменте, так и завершенные оредра
Параметры индикатора Lines Buy color - определяет цвет для ордеров покупки
Lines Sell color - определяет цвет для ордеров продаж
Lines Width - определяет толщину линии, работает только для стили Solid
Lines style - определяет стиль линии
Lines positive profit color - определяет цвет для отображения
FREE

Индикатор Laguerre VIX Trend Extrema (LVTE) находит вершины и впадины рынка. Как следует из названия, LVTE - это процентный ценовой осциллятор, который распознает крайние диапазоны рыночной цены. Согласно описанию в книге Джона Элерса "Кибернетический анализ фондового и фьючерсного рынков," внедрение уравнение Лагерра может способствовать более продвинутому распознаванию трендов и более сглаженным фильтрам, требуя при этом меньше данных. Здесь используется несколько вариантов уравнения Лагерра д

Gold Targets – это лучший трендовый индикатор. Уникальный алгоритм индикатора анализирует движение цены актива, учитывая факторы технического и математического анализа, определяет самые прибыльные точки входа, выдает сигнал в виде стрелки и ценовой уровень ( BUY Entry / SELL Entry ) для открытия ордера . Также сразу же индикатор выдает ценовой уровень для Stop Loss и пять ценовых уровней для Take Profit. ВНИМАНИЕ: Индикатор очень прост в применении. Установите индикатор на график одним кл

Индикатор вычисляет профиль объёма и выставляет метки, соответствующие уровням VAL, VAH и POC, для каждой свечи индивидуально.
Особенности работы индикатора Индикатор работает на периодах от M5 до MN, но для вычислений использует исторические данные меньших периодов: M1 - для периодов от M5 до H1, M5 - для периода H4, M30 - для периода D1, H4 - для периода W1, D1 - для периода MN. Цвет и положение меток VAL, VAH и POC на текущей свече считаются корректными только по времени близкому к закрытию
FREE
Time your Entry and Exits with Average True Range (ATR) Trailing Stops ATR Trailing Stops are primarily used to protect capital and lock in profits on individual trades but they can also be used, in conjunction with a trend filter, to signal entries. The indicator will help make your calculation of stop loss easier as it will be visually aiding you in choosing where to put your stoploss level on the chart by calculating the current value of ATR indicator. For those who are unfamiliar with ATR, i
FREE

Time Session OPEN-HIGH-LOW-CLOSE This Indicator Will Draw Lines Of OHLC Levels Of Time Session Defined By User. It Will Plot Floating Lines On Current Day Chart. Time Session Can Of Current Day Or Previous Day. You Can Plot Multiple Session Lines By Giving Unique ID To Each Session. It Can Even Show Historical Levels Of Time Session Selected By User On Chart To Do Backdating Test. You Can Write Text To Describe The Lines.
FREE
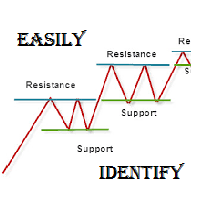
As per name Easily Identify, This Indicator is a affordable trading tool because with the help of Popular Developers & Support of M Q L Platform I have programmed this strategy. I tried to input 4 types and 3 periods of Calculation regarding Support Resistance, Furthermore, I have also care about Trend lines that Trader can easily get in touch with market in another way also. What is in for Trader?
Trading Modes: This selection is for activate whole strategy "Easily Identify" Support_R
FREE
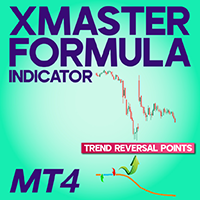
XMaster XHMaster Formula MT4 Indicator – No Repaint Strategy The XMaster / XHMaster Formula Indicator for MetaTrader 4 (MT4) is one of the most popular non-repaint tools used in Forex trading. According to sources like XS.com and TradingFinder, the indicator is designed to detect market direction, momentum strength, and potential reversal areas with high accuracy. This MT4 version blends multiple technical elements—such as EMA-based trend analysis, MACD momentum, RSI and Stochastic oscillators,
FREE
Minotaur Waves — это высокоточный инструмент анализа рынка, предназначенный для выявления подтверждённых смен направлений движения и потенциальных зон разворота с использованием двухуровневого сигнального движка. Система объединяет мощный Minotaur Oscillator с анализом динамических диапазонов, обеспечивая точные, не перерисовывающиеся сигналы, оптимизированные для активной торговли. Minotaur Waves полностью совместим со всеми валютными парами и показывает наилучшую производительность на EURUSD,

Head and Shoulders Pattern Indicator - Your Key to Recognizing Trend Reversals Unlock the power of pattern recognition with the "Head and Shoulders Pattern Indicator." This cutting-edge tool, designed for MetaTrader, is your trusted ally in identifying one of the most powerful chart patterns in technical analysis. Whether you're a novice or an experienced trader, this indicator simplifies the process of spotting the Head and Shoulders pattern, allowing you to make informed trading decisions. Key
FREE

Название продукта Smart RSI (MT4) – часть серии SmartView Краткое описание Индикатор RSI с уникальным пользовательским опытом на платформе MetaTrader. Предоставляет расширенные возможности, ранее недоступные, такие как открытие настроек двойным кликом, скрытие и отображение индикаторов без удаления, и отображение окна индикатора на весь размер графика. Разработан для работы вместе с остальными индикаторами серии SmartView. Обзор Серия SmartView предлагает уникальный и отличительный пользовательс
FREE
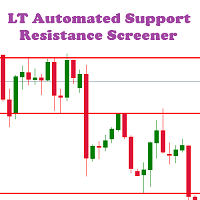
LT Automated Support Resistance Screener is a level indicator or a support resistance indicator that can be used to determine the level of support and resistance values. This indicator is free and easy to used in the Metatrader 4 platform which is built using the MQL4 programming language. Support resistance indicator is an important indicator that is often to used, but it is not available on the MT4 platform. This indicator can be used for all markets like forex, indices, gold etc and all time
FREE

Готовы ли вы стать Шерлоком Холмсом форекс-трейдинга? ️️ Представляем вам ультимативный торговый инструментарий: индикатор Lisek Levels and Channels !!! Забудьте о жонглировании несколькими индикаторами, как в цирковом номере. Мы упаковали всё необходимое в одно впечатляющее шоу: Ценовые уровни? Есть! Ценовые каналы? Ещё бы! Ценовой VWAP? О да! Балансовый объём? Всё тут! И вишенка на торте? Сигналы тревоги и push-уведомления, которые разбудят вас быстрее, чем двойной эспрессо! ️
FREE

on demo mode use date to work. on version 13 wave added.13.1 histogram and trigger line can be changeble. wave can be set 200-500. can have different signal on wave 200 on version 14 ema used.so can see mountly chart signals also. up-down indicator is no repaint and works all pairs and all time frames charts. it is suitable also 1 m charts for all pairs. and hold long way to signal. dont gives too many signals. when red histogram cross trigger line that is up signal.and price probably will down

Price Action Sniper is designed to trade the Price Action on the desired chart time frame. - Trend Reversals. - Trend Continuation. - Brekaouts. - Good tool for Binary Options
Price action forms the basis for all technical analysis of a currency pair, commodity or other asset chart. Many short-term traders rely exclusively on price action and the formations and trends extrapolated from it to make trading decisions. Technical analysis as a practice is a derivative of price action since it uses p
А знаете ли вы, почему MetaTrader Market - лучшее место для продажи торговых стратегий и технических индикаторов? Разработчику у нас не нужно тратить время и силы на рекламу, защиту программ и расчеты с покупателями. Всё это уже сделано.
Вы упускаете торговые возможности:
- Бесплатные приложения для трейдинга
- 8 000+ сигналов для копирования
- Экономические новости для анализа финансовых рынков
Регистрация
Вход
Если у вас нет учетной записи, зарегистрируйтесь
Для авторизации и пользования сайтом MQL5.com необходимо разрешить использование файлов Сookie.
Пожалуйста, включите в вашем браузере данную настройку, иначе вы не сможете авторизоваться.