Scalper Assistant
- Indikatoren
-
Pavel Verveyko
 Writing scripts, indicators, EAs on MQL5 and MQL4.
Fast, Reliable, And High-Quality.
For all questions, please contact personal messages. - Version: 1.1
- Aktualisiert: 4 August 2022
- Aktivierungen: 5
Der Indikator ist ein Handelssystem für den kurzfristigen Handel.
Scalper Assistant hilft, die Richtung der Transaktion zu bestimmen, und zeigt auch die Einstiegs- und Ausstiegspunkte an.
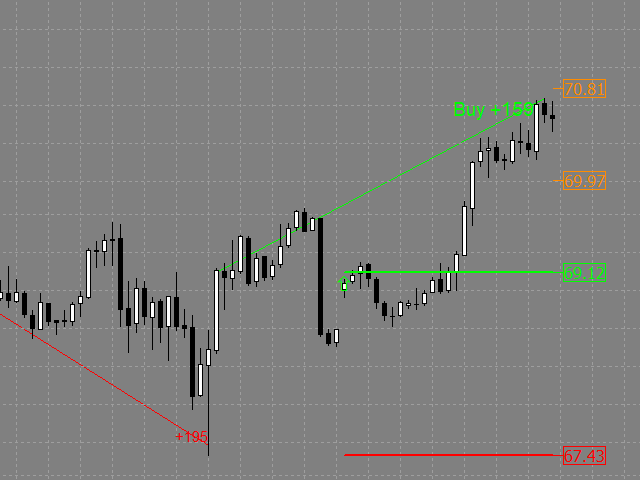
Der Indikator zeichnet zwei Linien (mögliche Punkte für die Eröffnung von Positionen).
Im Moment des Durchbruchs der oberen Linie nach oben (und wenn alle Handelsbedingungen erfüllt sind), erscheint ein Aufwärtspfeil (ein Kaufsignal), sowie 2 Ziele.
Im Moment des Durchbruchs der unteren Linie nach unten (und wenn alle Handelsbedingungen erfüllt sind), erscheint ein Pfeil nach unten (ein Verkaufssignal) sowie 2 Ziele.
Wenn sich der Kurs in Richtung des Ziels bewegt, wird die maximale Bewegungslänge in Punkten angezeigt.
Wenn das zweite Ziel erreicht ist, gilt die Transaktion als abgeschlossen.
Der Indikator wurde für Zeiträume entwickelt: M5, M15, M30, H1.
Scalper Assistant verfügt über ein System von Warnungen über die Öffnung und Schließung des Signals.
Einstellungen:
- Ind_Period - die Periode des Indikators.
- color_Buy - die Farbe des Kaufsignals.
- color_Sell - die Farbe des Verkaufssignals.
- color_Target - die Farbe der Ziele.
- price_levels_Thickness - die Dicke der Signallinien.
- price_levels_Style - Stil der Signallinien.
- price_levels_Back - Anzeige der Signallinien im Hintergrund.
- text_Size - Schriftgröße.
- text_Font - Schriftart.
- Vergangene_Signale - Anzeige der Historie der Indikatorsignale.
- past_signals_Tickness - die Dicke der Signallinien des Indikators.
- past_signals_Syle - Stil der Indikatorsignallinien.
- past_signals_Back - Anzeige der Indikatorsignallinien im Hintergrund.
- past_signals_text_Size - Schriftgröße der geschlossenen Signale.
- Alert_ID - ist ein eindeutiger Name zur Identifizierung von Alarmen.
- Send_Notification - Benachrichtigung an das mobile Endgerät.
- Send_Alert - Standard-Alarm des Terminals.