Zup Universal ZigZag with Pesavento Patterns
- Indikatoren
- Version: 154.224
- Aktualisiert: 24 September 2024
Der ZUP basiert auf zwei Ideen.
- Idee 1 - eine Vielzahl von Methoden zur Identifizierung von Extremen (Minima und Maxima) auf den Marktpreis-Charts in einem einzigen Indikator zu kombinieren.
- Idee 2 - Ermöglichung einer einfachen Verknüpfung verschiedener grafischer Werkzeuge zur Analyse des Marktverhaltens mit den identifizierten Extremen.
Um die erste Idee zu verwirklichen, wurde der Indikator wie folgt angepasst.
Mehrere ZigZag-Algorithmen wurden integriert.
Standard-ZIGZAG-Algorithmus. Dieser Algorithmus basiert auf dem ZigZag, der mit dem MetaTrader-Terminal geliefert wird.
- ZIGZAG von Alex. Spitzname im Forum ist ANG...
- ZIGZAG ähnlich dem im kanadischen Programm Ensign eingebauten.
- ZIGZAG entwickelt von einem Programmierer mit dem Spitznamen tauber.
- ZIGZAG entspricht den Gann-Schwankungen. Die Beschreibung des Algorithmus ist im Buch von Hyerczyk enthalten.
Fünf DT-ZigZag-Modi. Der Name DT-ZigZag wurde von einem Programmierer mit dem Spitznamen klot erfunden.
Die Grundidee besteht darin, die Zickzacklinien auf dem aktuellen Zeitrahmen auf der Grundlage der Daten aus den relativ zum aktuellen Zeitrahmen höheren Zeitrahmen darzustellen.
- DT-ZigZag mit dem Standard-Zigzag-Algorithmus.
- DT-ZigZag mit dem von klot entwickelten Algorithmus .
- DT-ZigZag mit dem von Candid entwickelten Algorithmus.
- DT-ZigZag auf der Grundlage eines fraktalen Suchalgorithmus. In diesem speziellen Fall haben die Fraktale nichts mit Benoit Mandelbrot zu tun. Der Name ist dem entsprechenden Indikator im MetaTrader-Paket entnommen.
- DT-ZigZag mit den Gann-Schwankungen in der Interpretation von Hyerczyk.
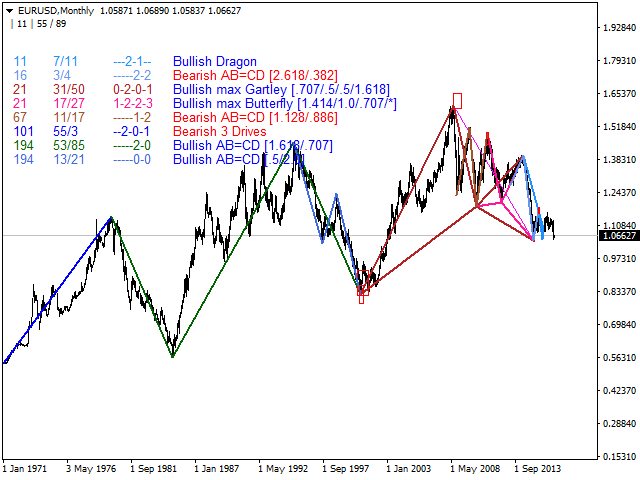
- 7 verschiedene ZigZag-Algorithmen im Markt-Scan-Modus zur Suche nach Mustern, Codename Gartley Patterns.
- ZIGZAG, entwickelt von einem Programmierer mit dem Spitznamen Talex.
- SQZZ ZigZag, entwickelt von einem Programmierer mit dem Spitznamen tovaroved (Alexander Shchukin).
- ZZ_2L entwickelt von einem Programmierer mit dem Spitznamen wellx.
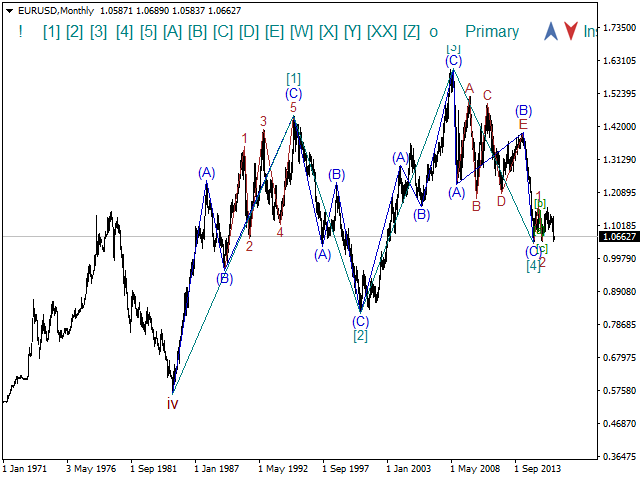
- Wave ZigZag. Mit diesem ZigZag kann man manuell ein Wellenlayout erstellen, das den Elliott-Wellen auf 10 Wellenebenen entspricht.
Um die zweite Idee umzusetzen, wurden mehrere grafische Werkzeuge in den Indikator integriert.
Der Indikator enthält insgesamt über 400 Parameter.
Alle Parameter des Indikators sind in 16 Gruppen unterteilt, um die Navigation zu erleichtern.
- Parameter für die Verwaltung der eingebauten ZigZags
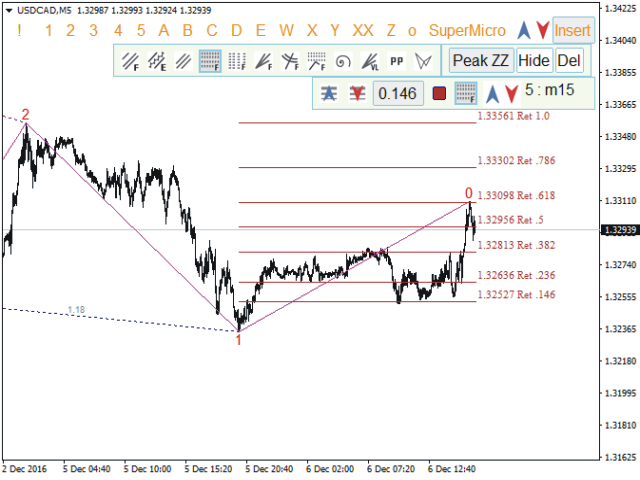
- Parameter für die Verwaltung der Fibonacci-Levels
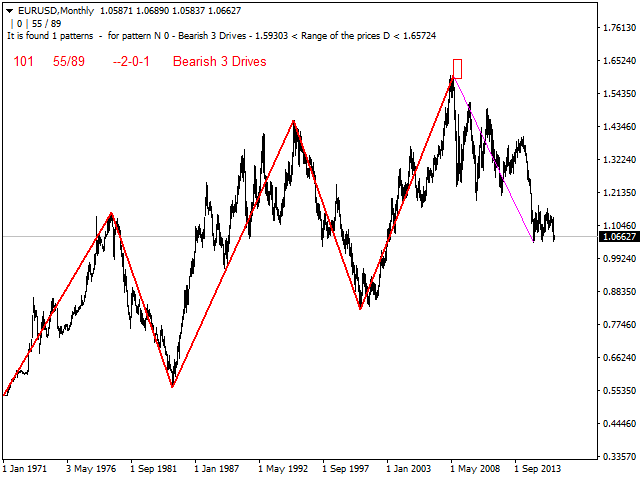
- Parameter zur Verwaltung der Pesavento-Patterns
- Parameter zur Verwaltung der Gartley-Patterns
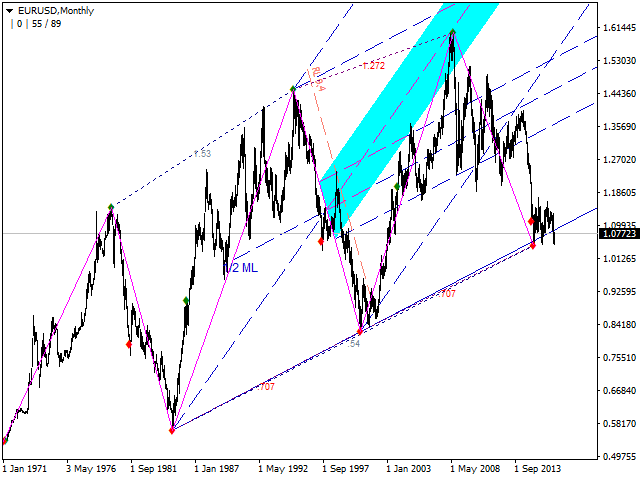
- Parameter für die Verwaltung der Andrews' Pitchfork
- Parameter für die Verwaltung der micmed-Kanäle
- Parameter für die Verwaltung der Fibonacci-Fächer
- Parameter für die Verwaltung der Fibonacci-Erweiterungen
- Parameter für die Verwaltung der Ebenen des Versums
- Parameter für die Verwaltung der Fibonacci-Bögen
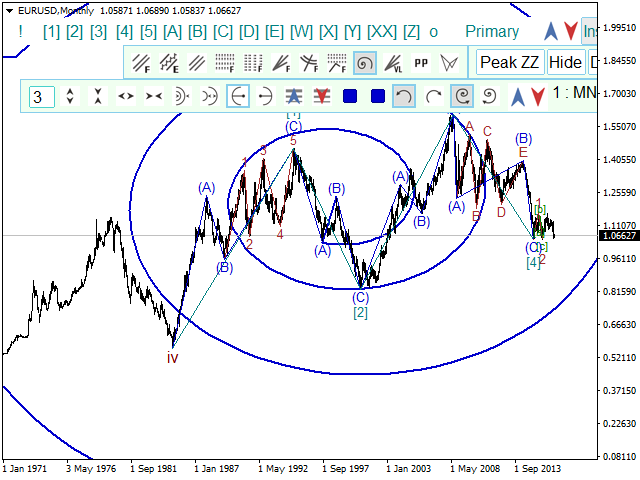
- Parameter für die Verwaltung der logarithmischen Spirale
- Parameter für die Verwaltung des Pivot ZigZag
- Parameter für die Verwaltung der Kanäle
- Parameter für die Verwaltung der Fibonacci-Zeitzonen
- Zusätzliche Parameter
- Allgemeine Parameter
Es ist auch möglich, die grafischen Werkzeuge mit der Maus und über die grafische Schnittstelle zu verwalten.
Um die grafische Oberfläche zu verwenden, muss der Parameter ExtPanel=true aktiviert werden.
Wenn das Panel mit der ESC-Taste gelöscht wird, kann es mit der Tastenkombination SHIFT-Z wieder in das Diagramm eingefügt werden.
Die grafischen Werkzeuge, die mit der Maus gezeichnet werden, sind entweder an die ZigZag-Extremwerte oder an das Wellenlayout gebunden.
Die grafischen Werkzeuge, die mit den Parametern gezeichnet werden, sind nur an die ZigZag-Extremwerte gebunden.
Sie können nicht an das Wellenlayout gebunden werden.
Standardmäßig ist die Verwendung der grafischen Schnittstelle aktiviert. Für die korrekte Funktion ist es notwendig, MetaTrader 4 Build 1014 oder höher zu verwenden.
Für die automatische Suche nach den Gartley-Mustern unter Verwendung der Parameter muss ExtIndicator = 11: search Patterns aktiviert werden.
Für das automatische Plotten der Andrews' Pitchfork mit Hilfe der Parameter ist es notwendig, die Option
- ExtPitchforkDynamic = 2
- ExtPitchforkStatic = 2
Die detaillierte Beschreibung aller Parameter und Methoden für die Arbeit mit der grafischen Oberfläche nimmt mehrere Artikel in Anspruch.
Die vollständige Liste der Parameter finden Sie in den Kommentaren. Die angehängte Datei enthält die Kurzbeschreibung der ZUP.
Ich bedanke mich bei allen, die an der Erstellung der ZUP mitgewirkt haben.


Thank you for sharing and the continued development support.