MA Dashboard
- 指标
- 版本: 4.10
- 更新: 19 七月 2026
- 激活: 10

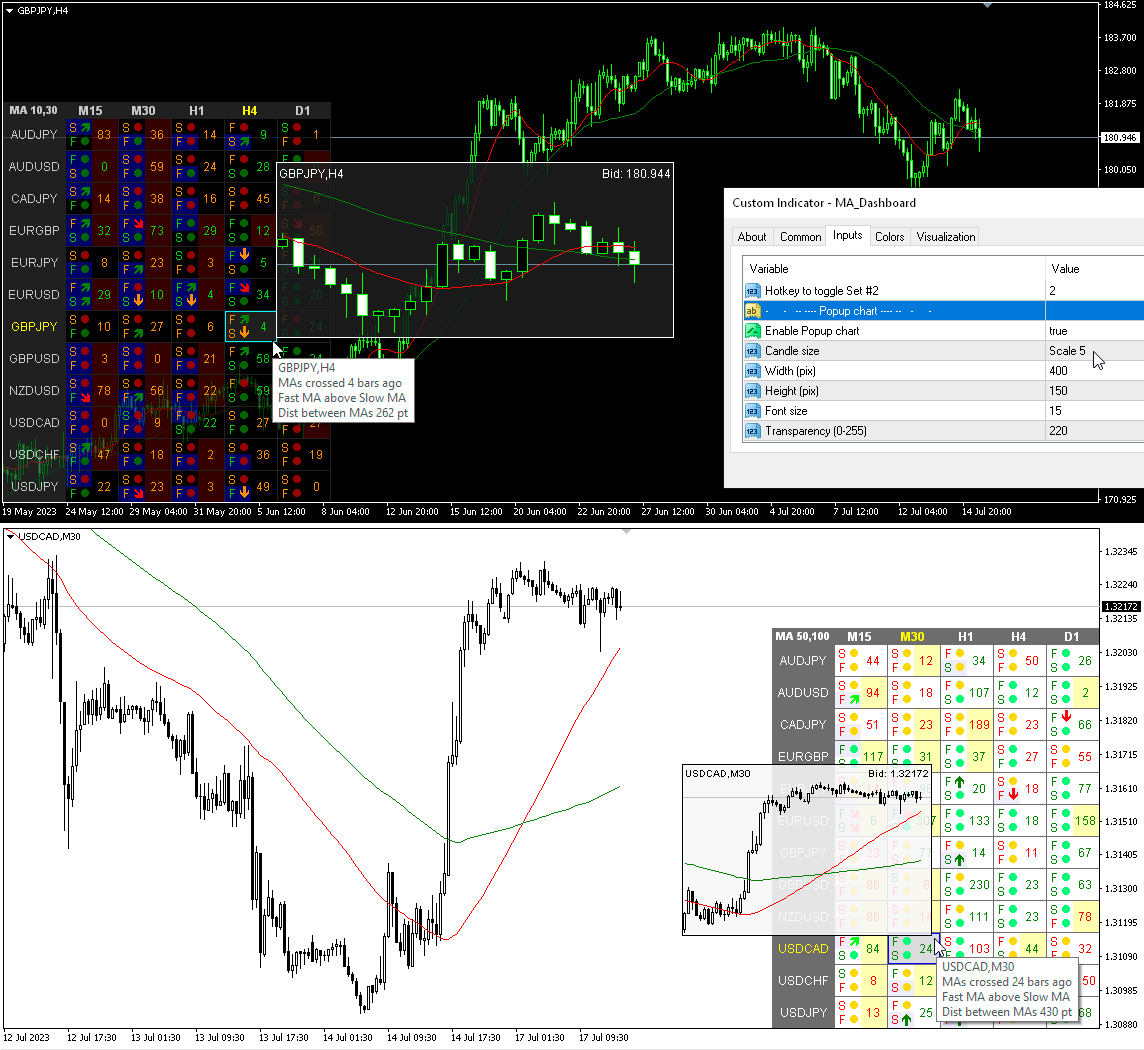
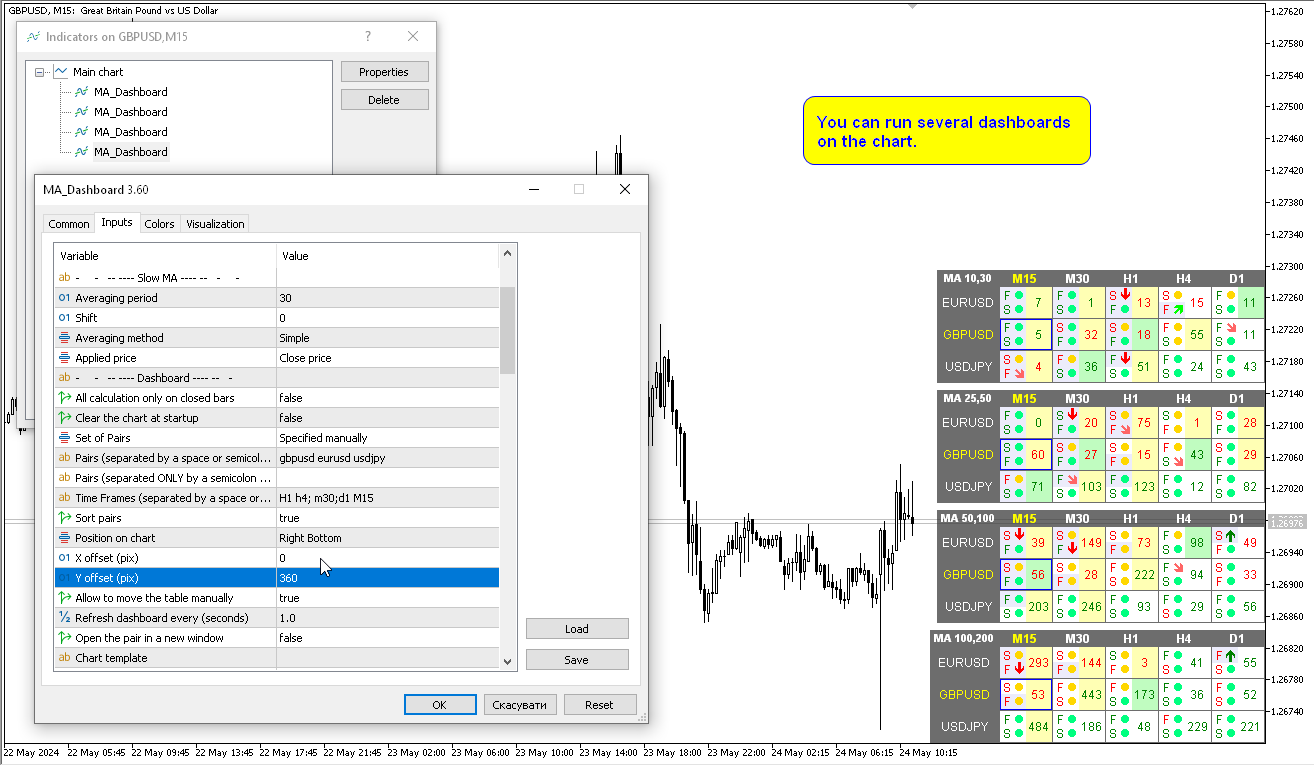
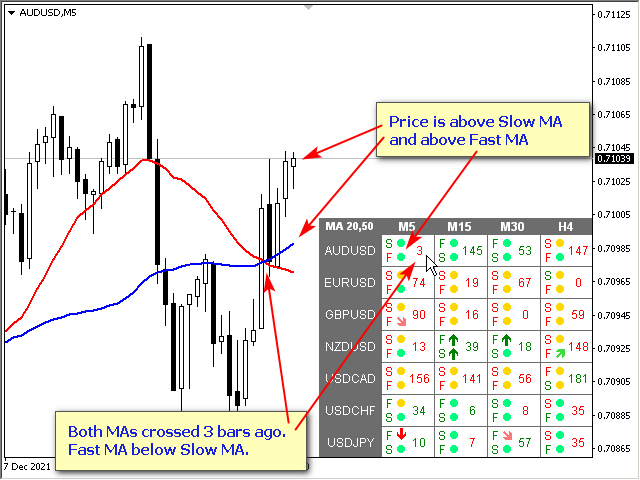
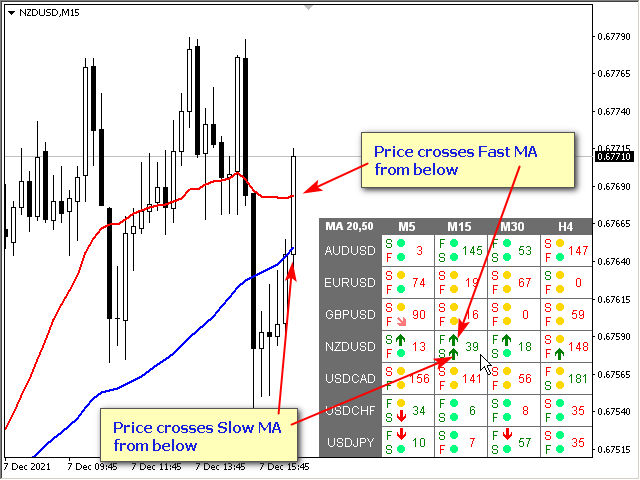
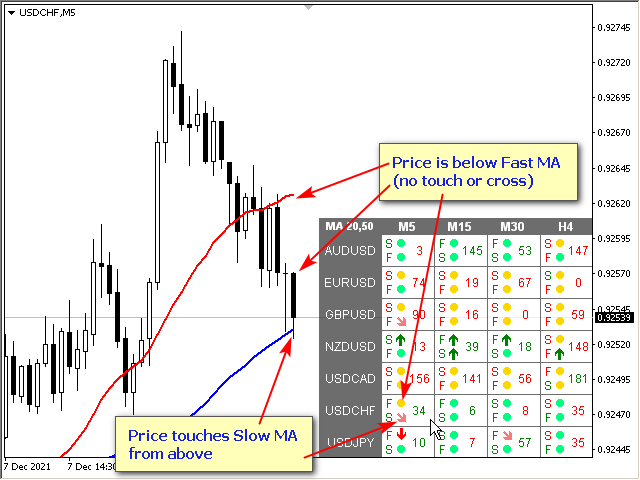
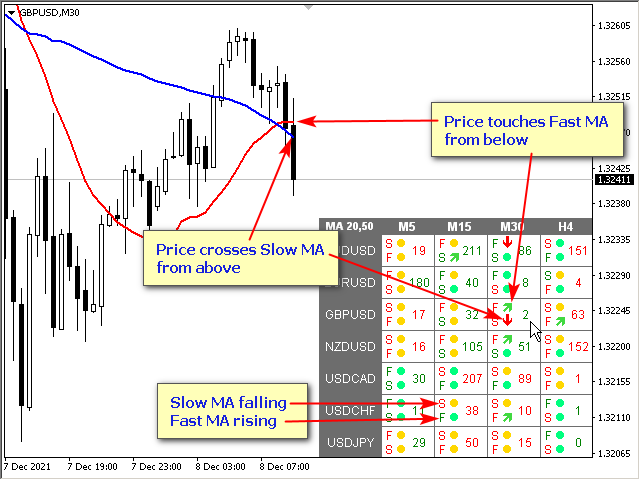
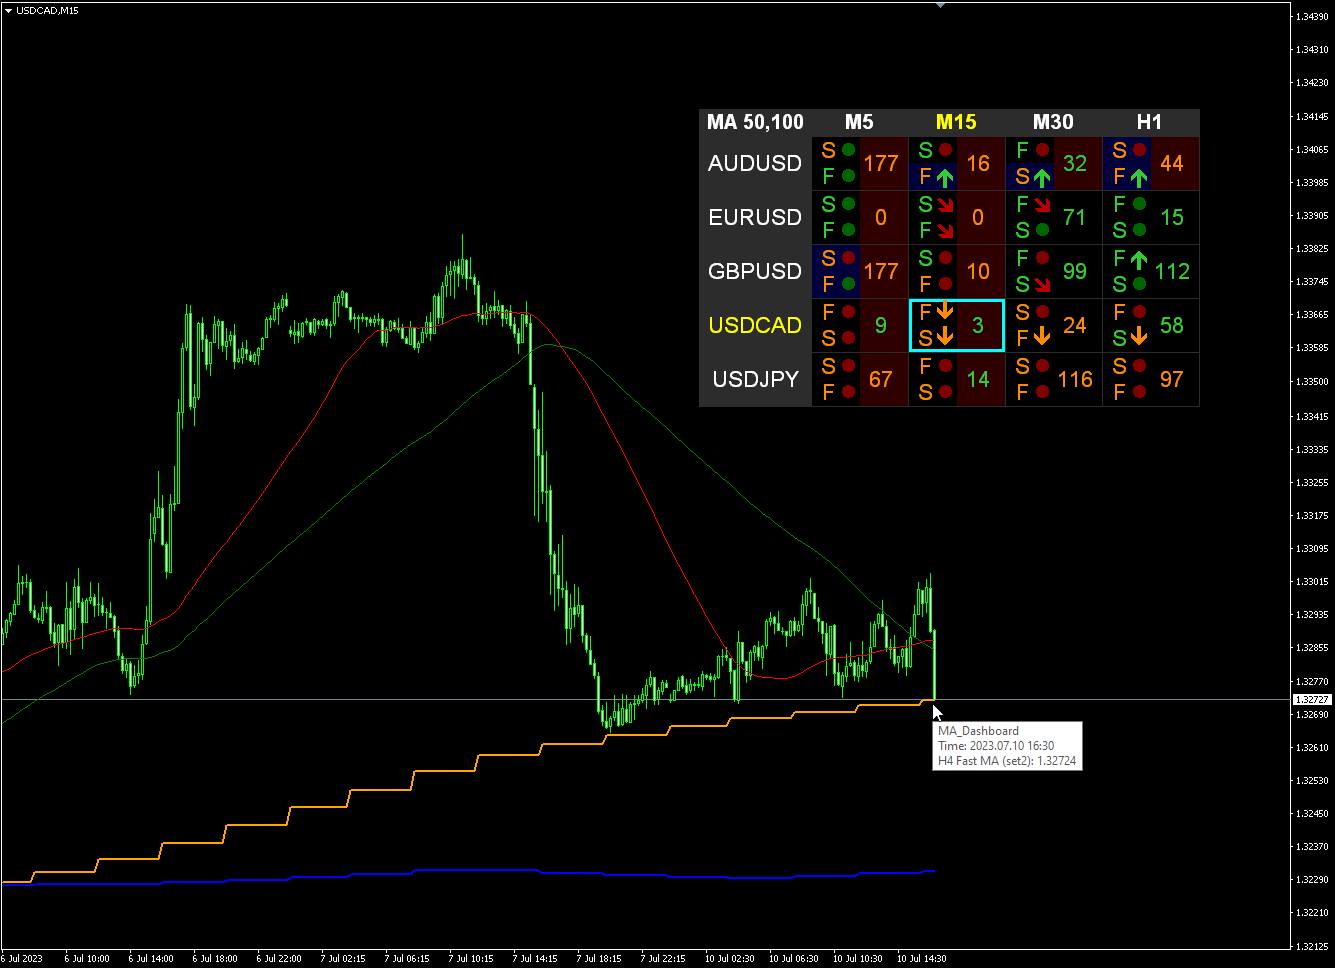
移动平均线 (MA) 指标的多货币和多时间范围修改。 在仪表板上,您可以看到指标的当前状态 - 快速 MA 和慢速 MA 的突破和触及(按价格),以及 MA 线彼此之间的交叉点(移动平均线交叉)。 在参数中,您可以指定任何所需的货币和时间范围。 此外,该指标还可以发送有关价格触及线及其交叉的通知。 通过单击带有句点的单元格,将打开该符号和句点。 这是 MTF 扫描仪。您可以在图表上运行多个仪表板。
该指标在当前图表上显示快速 MA 线和慢速 MA 线。 您可以为图表选择 MA 时间范围并从其他时间范围观察 MA (MTF MA)。 两组MA的热键默认为“1”和“2”。
默认情况下,从图表中隐藏仪表板的键是“D”
参数
Fast MA — 快速MA
Averaging period — 平均周期.
Shift — 转移。
Averaging method — 平均法。
Applied price — 适用价格。
Slow MA — 慢MA
Averaging period — 平均周期。
Shift — 转移。
Averaging method — 平均法。
Applied price — 适用价格。
仪表板
All calculation only on closed bar — 所有计算仅在封闭柱上进行。
Clear the chart at startup —启动时清除图表。
Set of Pairs — 成对组
— Market Watch — 来自 MT 的“市场观察”的货币对。— Specified manually — 在参数“Pairs”中手动指定对。— Current pair — 仅显示当前对。
Pairs (separated by a space or semicolon) — 由空格或分号分隔的符号列表。 货币名称的书写方式应与经纪商的名称完全相同,并保留大小写和前缀/后缀。
Time Frames (separated by a space or semicolon) — 由空格或分号分隔的时间范围列表(多个时间范围)。
Sort pairs — 对对排序 — 对对列表进行排序。
Position on chart — 在图表上显示面板的角落。
X offset (pix) — 沿 X 轴移动面板;
Y offset (pix) — 沿 Y 轴移动面板;
Refresh dashboard every (seconds) — 所有货币对和时间范围的更新周期。
Open the pair in a new window — 通过单击在新图表窗口中打开交易品种。
Chart template — 图表模板的名称(如果图表在新窗口中打开)。
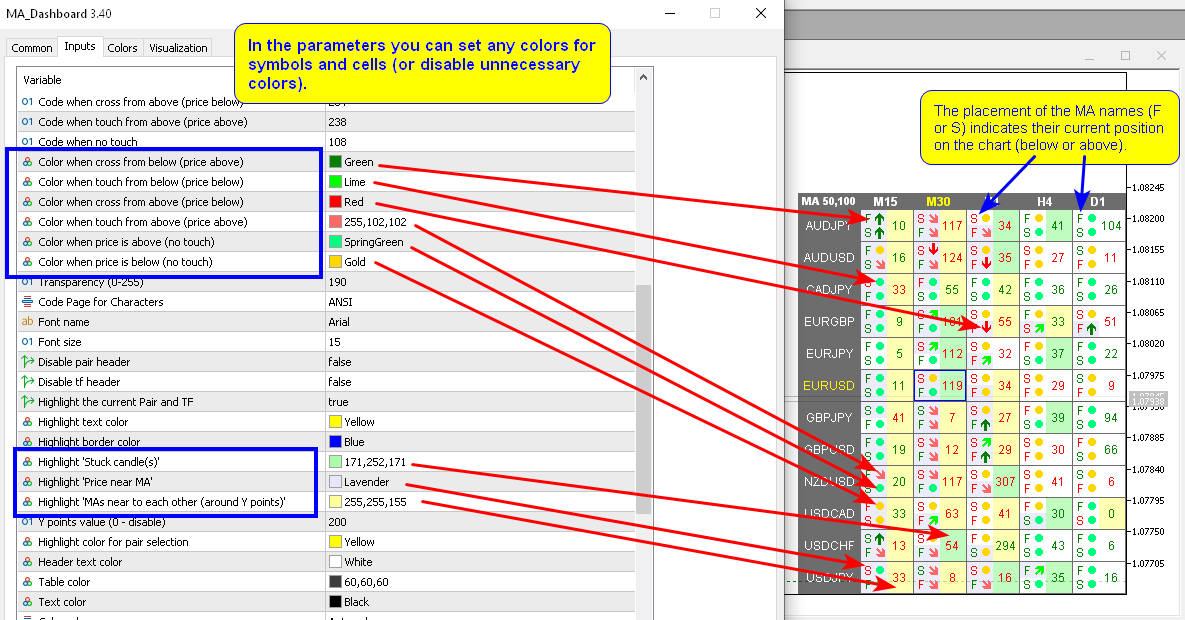
Code when cross from below (price above) — 从下方交叉时的代码(上方价格);
Code when touch from below (price below) — 从下方触摸时编码(价格如下);
Code when cross from above (price below) — 从上方交叉时的代码(价格如下);
Code when touch from above (price above) — 从上方触摸时的代码(上面的价格);
Code when no touch — 无触摸时编码;
Transparency (0-255) — 透明度(0-255);
Font name — 字体名称;
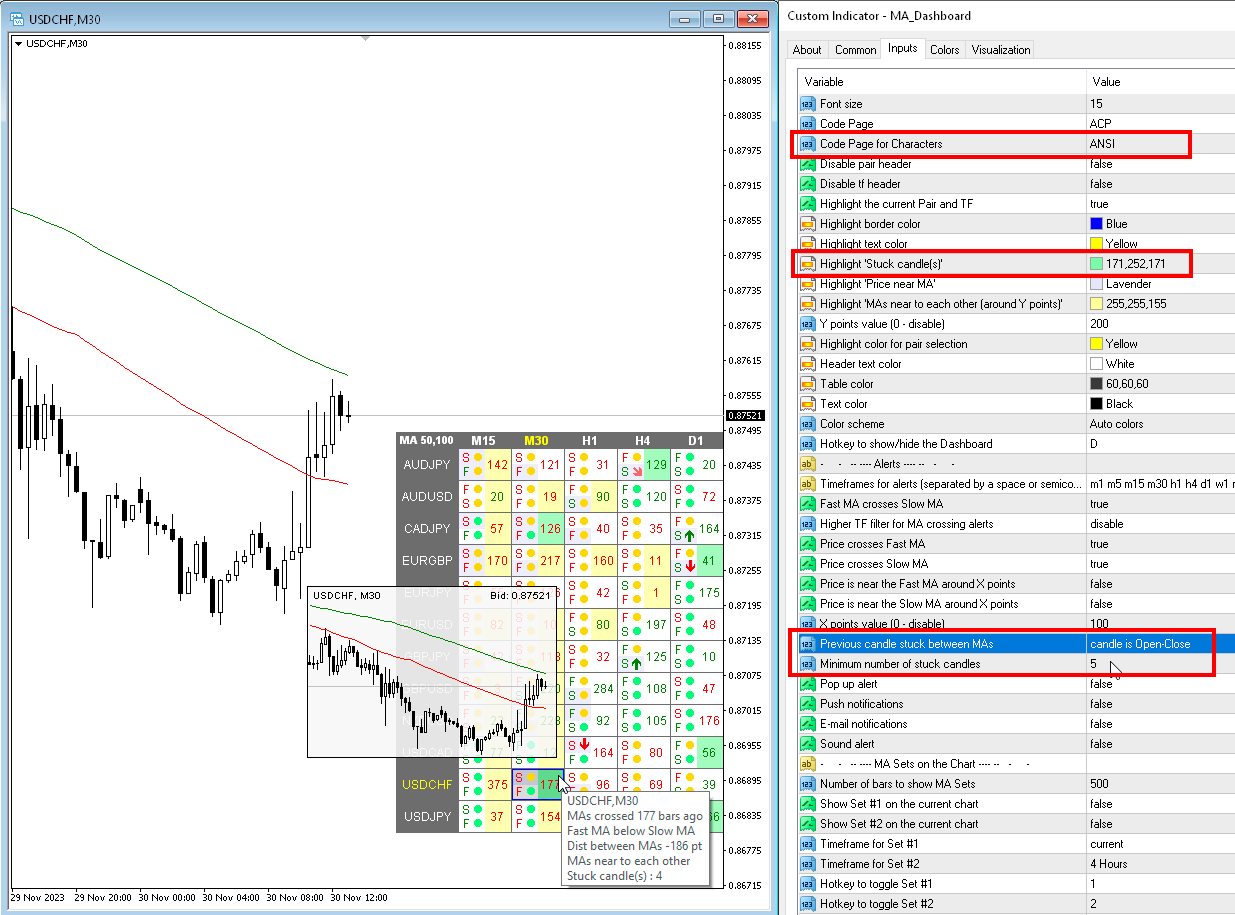
Font size — 字体大小。
警报
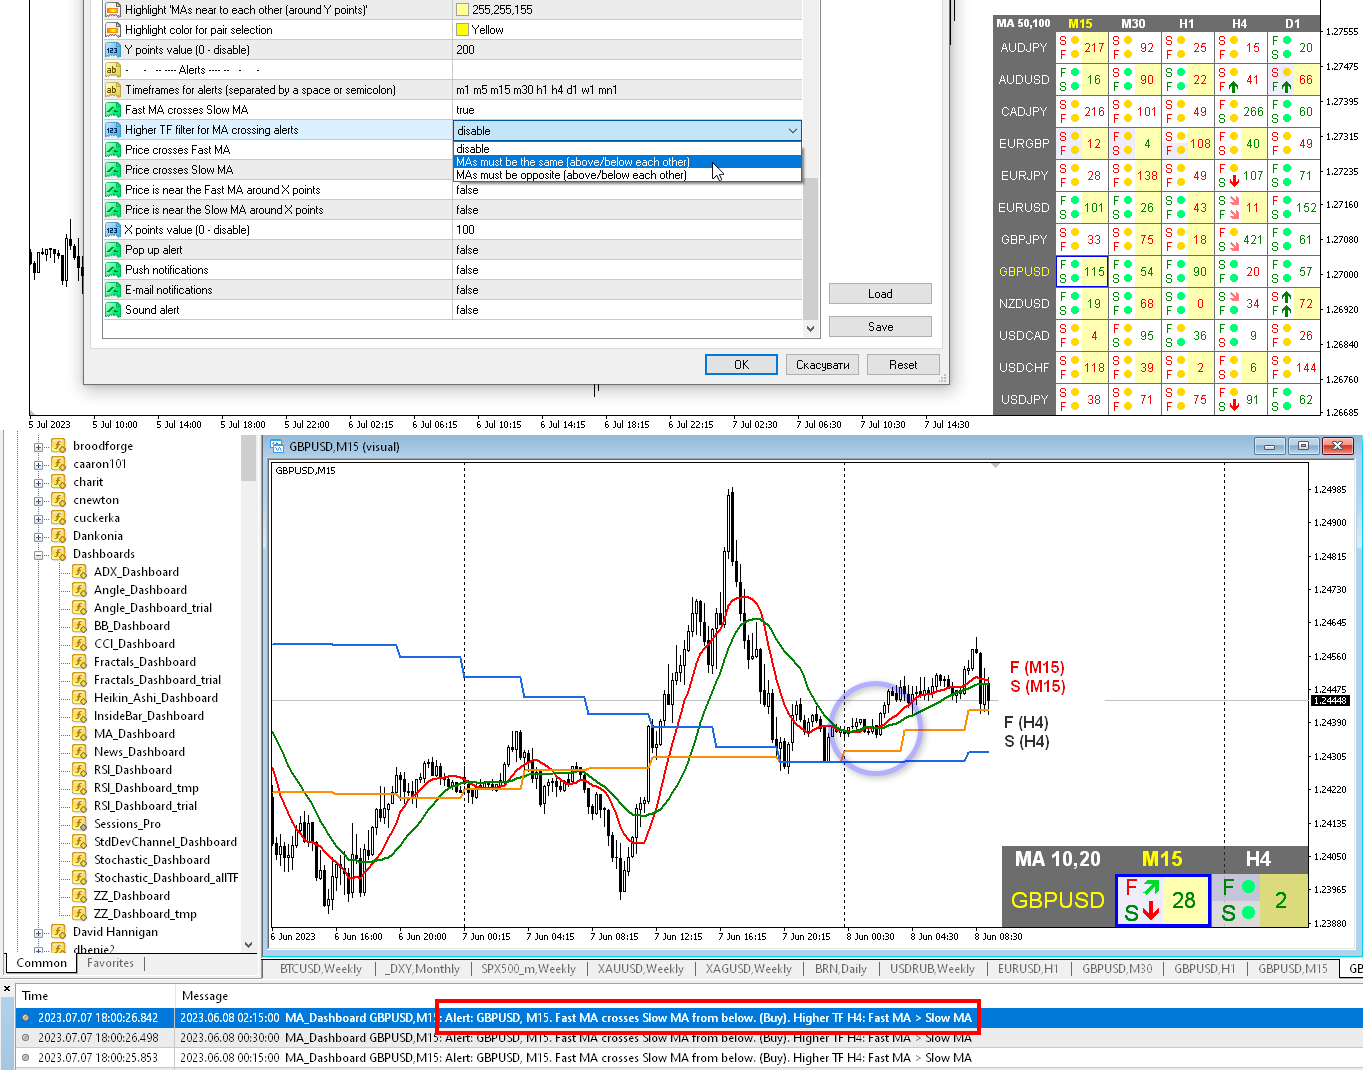
Timeframes for alerts (separated by a space or semicolon) — 警报的时间范围(用空格或分号分隔)。
Fast MA crosses Slow MA — 快速 MA 穿越慢速 MA;
Higher TF filter for MA crossing alerts — 用于 MA 穿越警报的更高 TF 过滤器 — 启用过滤器后,当 MA 交叉时,指标将检查下一个较高时间范围(在仪表板上)的 MA 值。 如果较高时间范围内的 MA 满足指定条件,则将发送 MA 交叉警报,否则不会发出警报。
- disable — 禁用
- MAs must be the same (above/below each other) — MA 必须相同(彼此上方/下方)
- MAs must be opposite (above/below each other) — MA 必须相反(彼此上方/下方)
Price crosses Fast MA — 价格穿越快速均线;
Price crosses Slow MA — 价格穿越慢速均线;
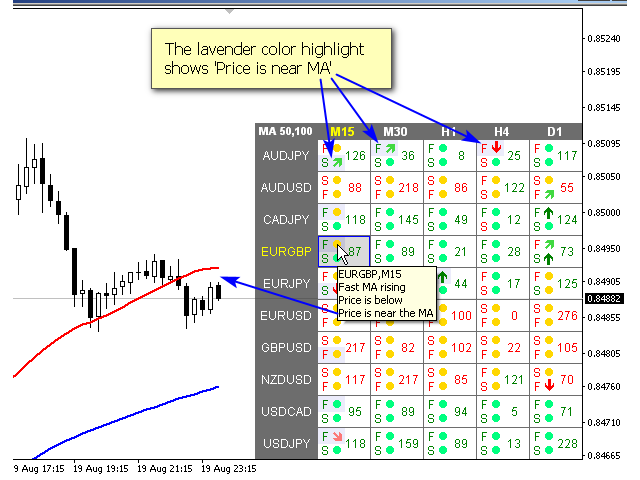
Price is near the Fast MA around X points — 价格接近 X 点附近的快速移动平均线
Price is near the Slow MA around X points — 价格接近 X 点附近的慢速移动平均线
Previous candle stuck between MAs — 前一根蜡烛卡在 MA 之间 — 如果前一根蜡烛位于两个 MA 之间,那么您可以收到有关此情况的警报或在表格中查看。
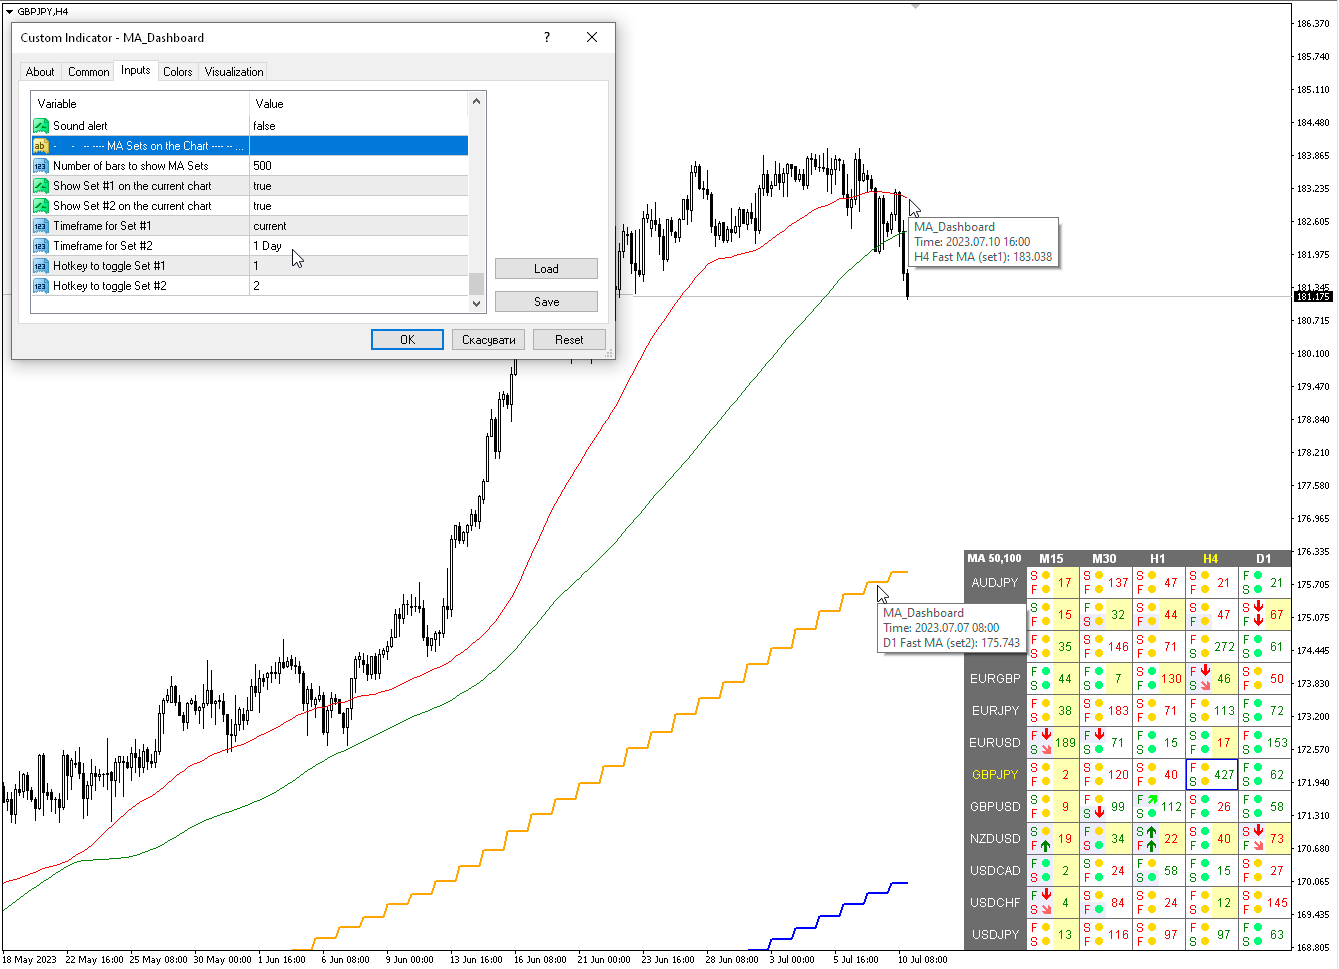
MA Sets on the Chart — 图表上的 MA 集合
Number of bars to show MA Sets — 显示移动平均线集的柱数
Show Set #1 on the current chart — 在当前图表上显示 Set #1
Show Set #2 on the current chart — 在当前图表上显示集合 #2
Timeframe for Set #1 — 第 1 组的时间表
Timeframe for Set #2 — 第 2 组的时间表
Hotkey to toggle Set #1 — 切换 Set #1 的热键
Hotkey to toggle Set #2 — 切换 Set #2 的热键
Popup chart — 弹出图表
Enable Popup chart — 启用弹出图表
Candle size — 蜡烛尺寸
Width (pix) — 宽度(像素)
Height (pix) — 高度(像素)
Font size — 字体大小
Transparency (0-255) — 透明度(0-255)

Very good.