MA Dashboard
- Indicateurs
- Version: 4.10
- Mise à jour: 19 juillet 2026
- Activations: 10

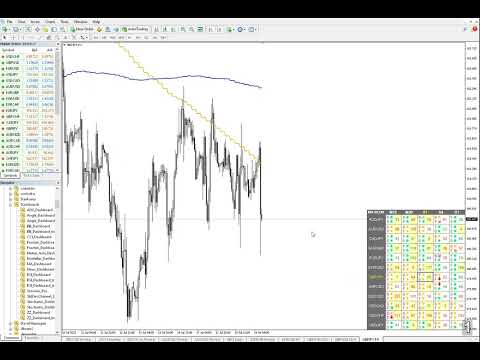
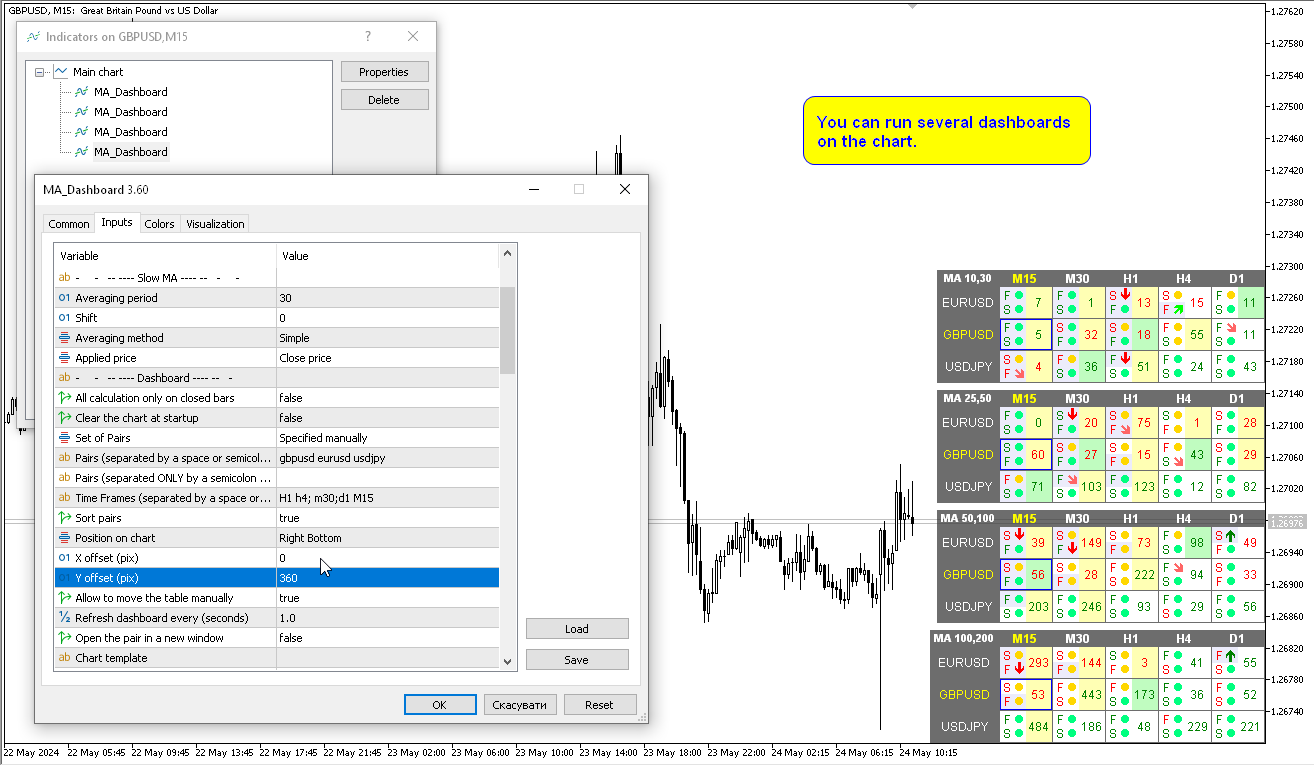
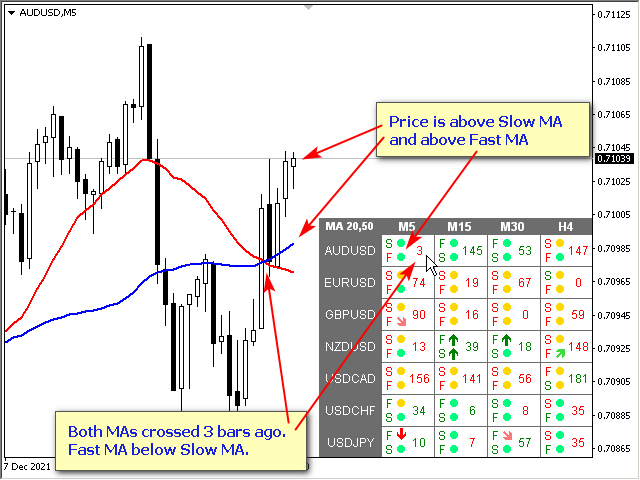
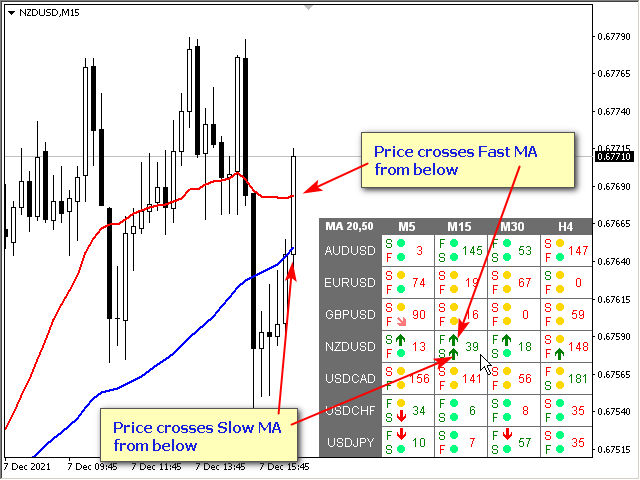
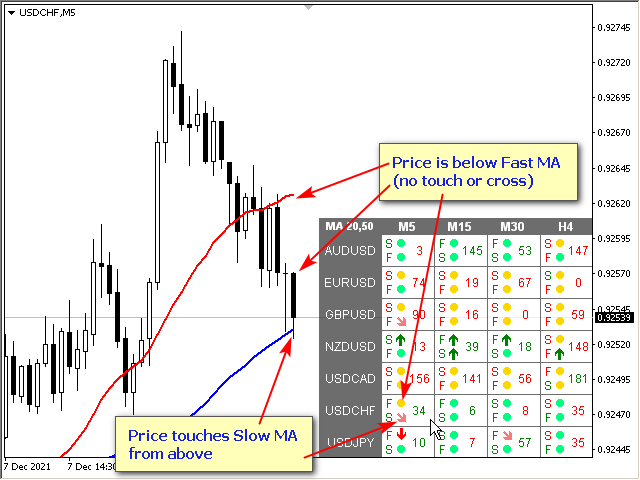
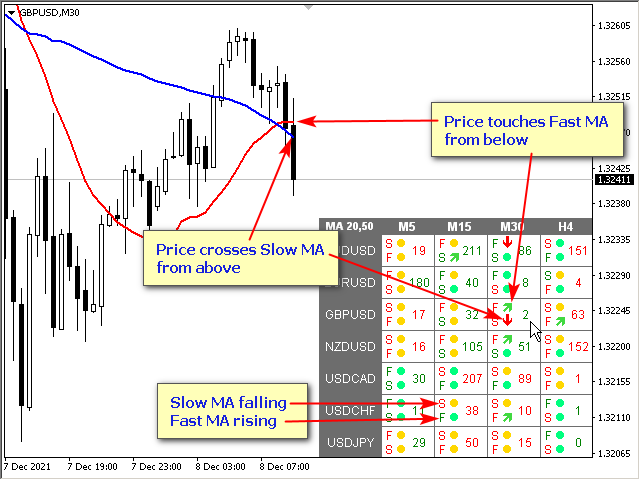
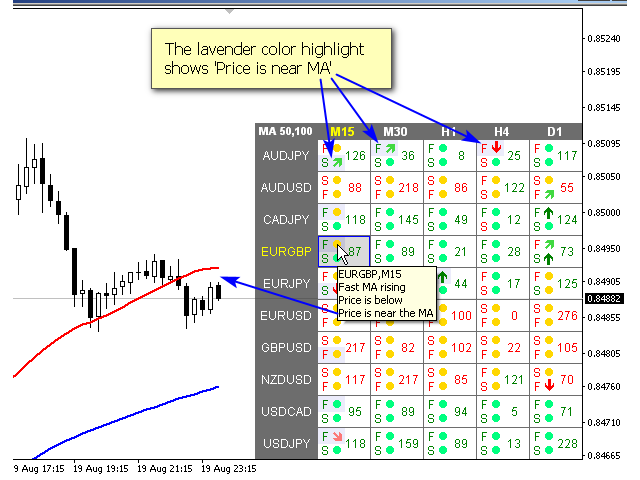
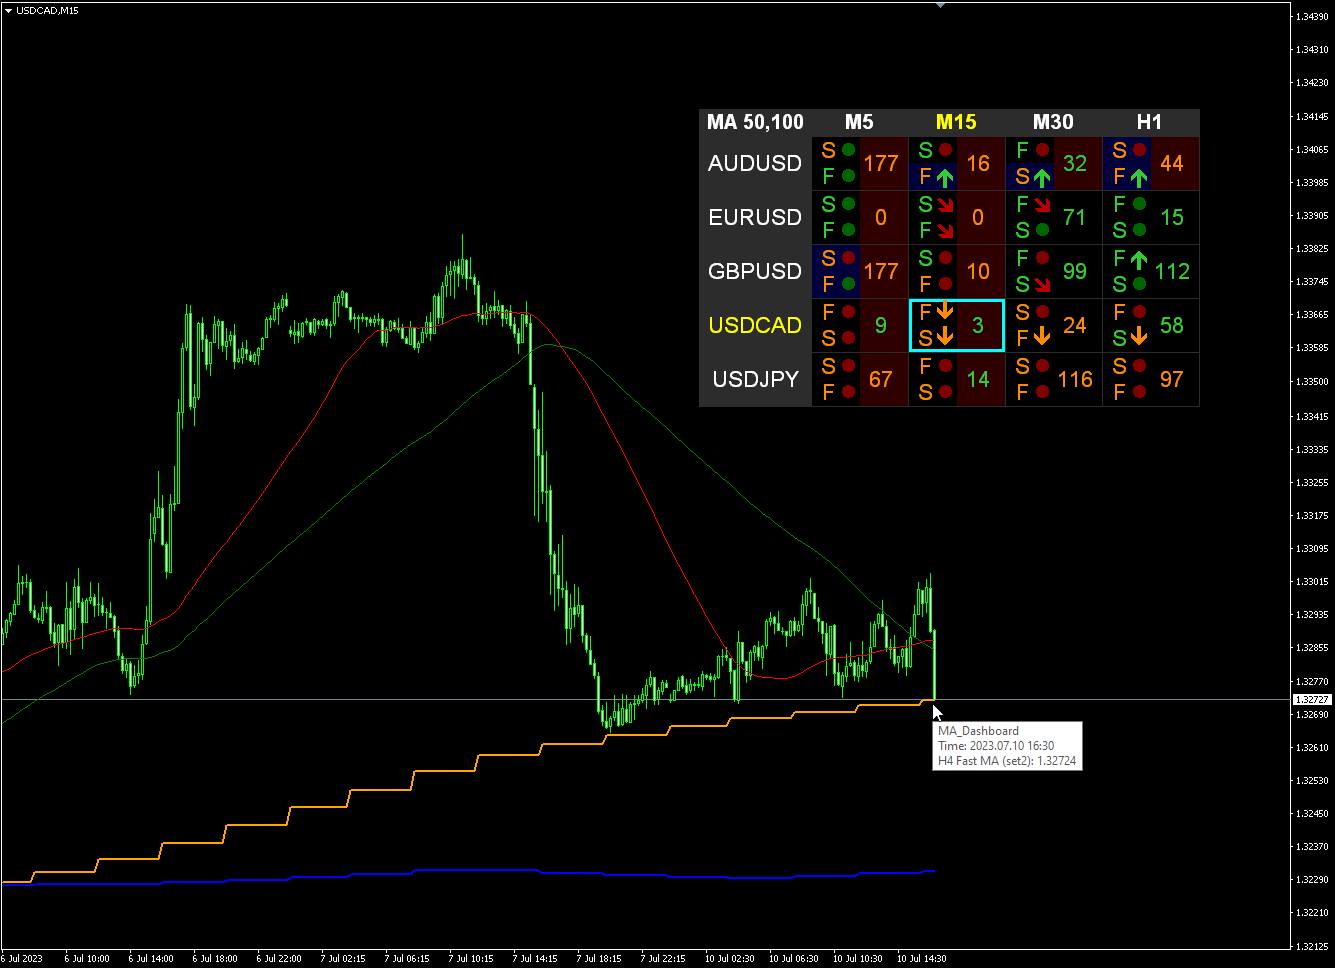
Modification multidevises et multitemporelles de l'indicateur Moving Average (MA). Sur le tableau de bord, vous pouvez voir l'état actuel de l'indicateur - les cassures et les touches (par prix) du Fast MA et du Slow MA, ainsi que l'intersection des lignes MA entre elles (croisement de moyenne mobile). Dans les paramètres, vous pouvez spécifier les devises et les délais souhaités. En outre, l'indicateur peut envoyer des notifications sur le prix touchant les lignes et sur leur franchissement. En cliquant sur une cellule avec un point, ce symbole et ce point seront ouverts. Il s'agit du scanner MTF. Vous pouvez exécuter plusieurs tableaux de bord sur le graphique.
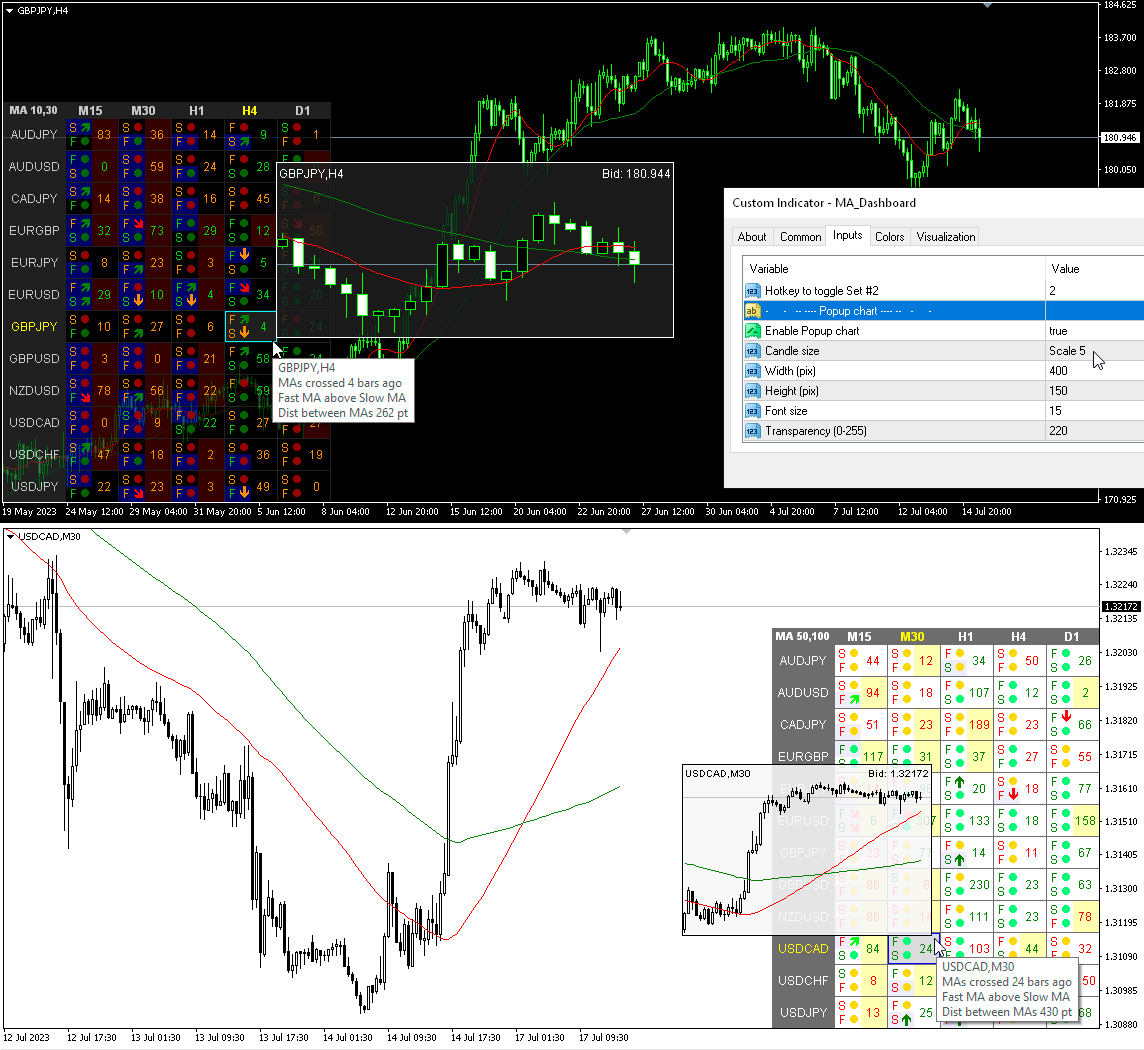
L'indicateur affiche les lignes Fast MA et Slow MA sur le graphique actuel. Vous pouvez sélectionner la période MA pour le graphique et regarder MA à partir d’autres périodes (MTF MA). Les raccourcis clavier pour les deux ensembles de MA sont "1" et "2" par défaut.
La clé pour masquer le tableau de bord du graphique est "D" par défaut
Paramètres
Fast MA
Averaging period — Période de moyenne.
Shift — Changement.
Averaging method — Méthode de moyenne.
Applied price — Prix appliqué.
Slow MA
Averaging period — Période de moyenne.
Shift — Changement.
Averaging method — Méthode de moyenne.
Applied price — Prix appliqué.
Dashboard
All calculation only on closed bar — Tous les calculs uniquement sur barre fermée.
Clear the chart at startup — effacez le graphique au démarrage.
Set of Pairs — Ensemble de paires
— Market Watch — Paires de "Market Watch" du MT.— Specified manually — paires spécifiées manuellement, dans les paramètres "Paires".— Current pair — affiche uniquement la paire actuelle.
Pairs (separated by a space or semicolon) — liste de symboles séparés par des espaces ou des points-virgules. Les noms des devises doivent être écrits exactement comme ceux du courtier, en conservant la casse et le préfixe/suffixe.
Time Frames (separated by a space or semicolon) — liste de délais séparés par des espaces ou des points-virgules (multi-périodes).
Sort pairs — trier la liste des paires.
Position on chart — coin pour afficher le panneau sur la carte.
X offset (pix) — décale le panneau le long de l'axe X ;
Y offset (pix) — décale le panneau le long de l'axe Y ;
Refresh dashboard every (seconds) — période de mise à jour pour toutes les paires et toutes les périodes.
Open the pair in a new window — ouvrez un symbole dans une nouvelle fenêtre graphique en cliquant.
Chart template — nom du modèle du graphique, si le graphique s'ouvre dans une nouvelle fenêtre.
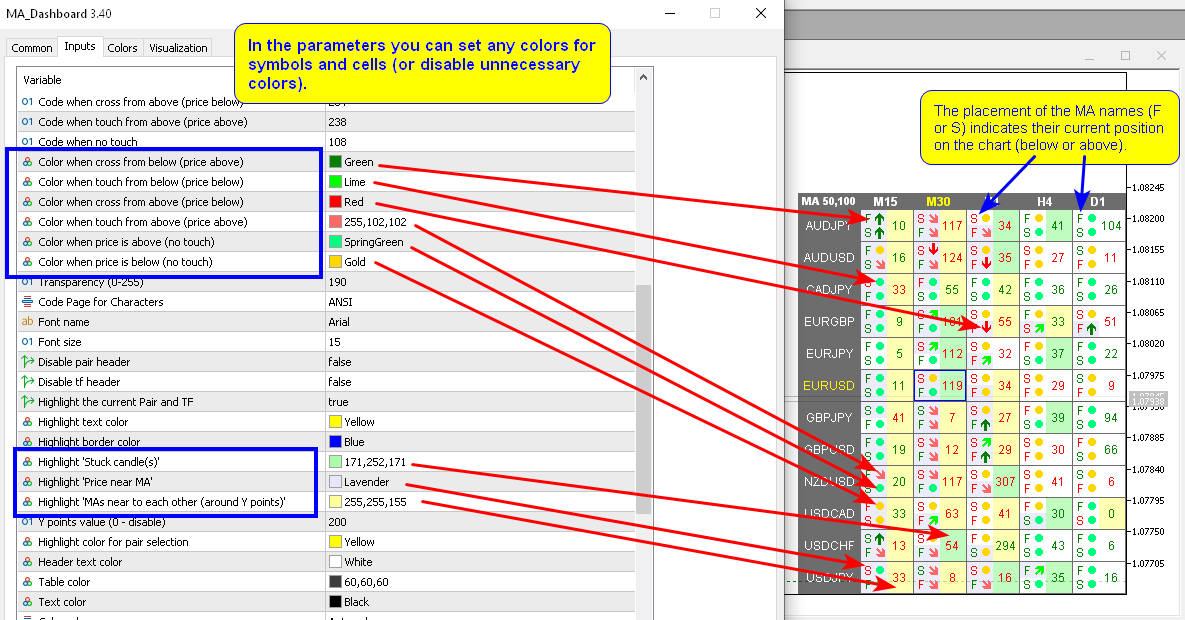
Code when cross from below (price above) — Code en cas de croisement par le bas (prix ci-dessus) ;
Code when touch from below (price below) — Code en touchant par le bas (prix ci-dessous);
Code when cross from above (price below) — Code en cas de croisement par le haut (prix en dessous) ;
Code when touch from above (price above) — Code en cas de contact par le haut (prix ci-dessus) ;
Code when no touch — Coder sans contact ;
Transparency (0-255) — Transparence (0-255);
Font name — Nom de la police ;
Font size — Taille de police.
Alertes
Timeframes for alerts (separated by a space or semicolon) — Délais des alertes (séparés par un espace ou un point-virgule).
Fast MA crosses Slow MA — La MA rapide croise la MA lente ;
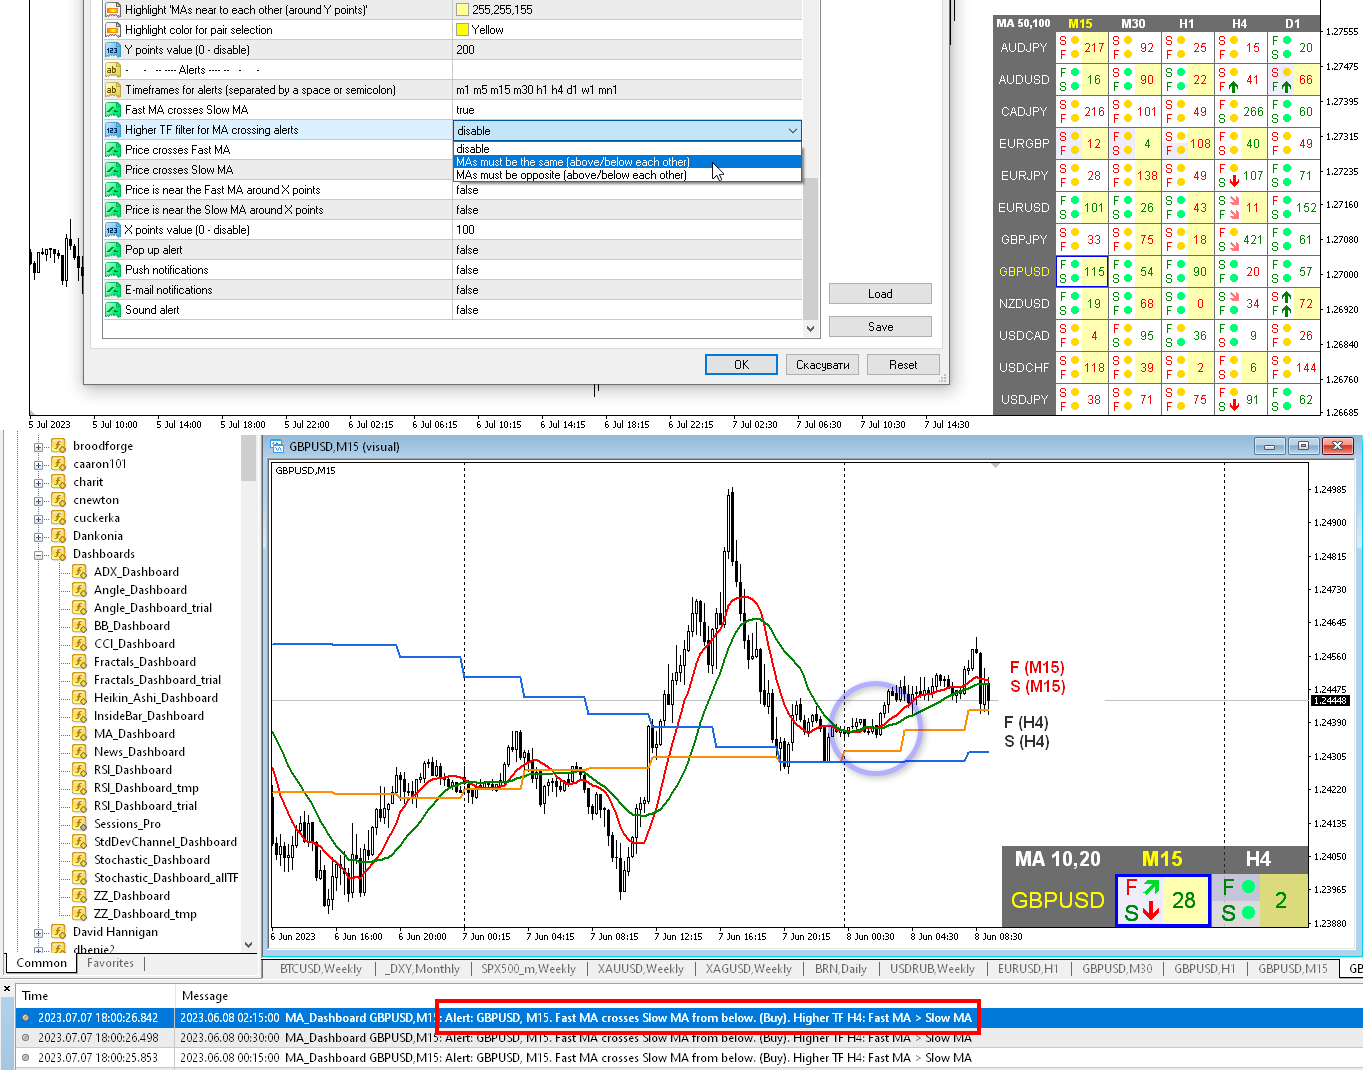
Higher TF filter for MA crossing alerts — lorsque le filtre est activé, lorsque les MA se croisent, l'indicateur vérifiera les valeurs de MA à partir de la période immédiatement supérieure (sur le tableau de bord). Si les MA de la période la plus élevée remplissent les conditions spécifiées, l’alerte de franchissement de MA sera envoyée, sinon il n’y aura pas d’alerte.
- disable — désactiver
- MAs must be the same (above/below each other) — Les MA doivent être les mêmes (les unes au-dessus/en dessous des autres)
- MAs must be opposite (above/below each other) — Les MA doivent être opposés (les uns au-dessus/en dessous des autres)
Price crosses Fast MA — Le prix croise Fast MA ;
Price crosses Slow MA — Le prix croise la MA lente ;
Price is near the Fast MA around X points — Le prix est proche du Fast MA autour de X points
Price is near the Slow MA around X points — Le prix est proche de la Slow MA autour de X points
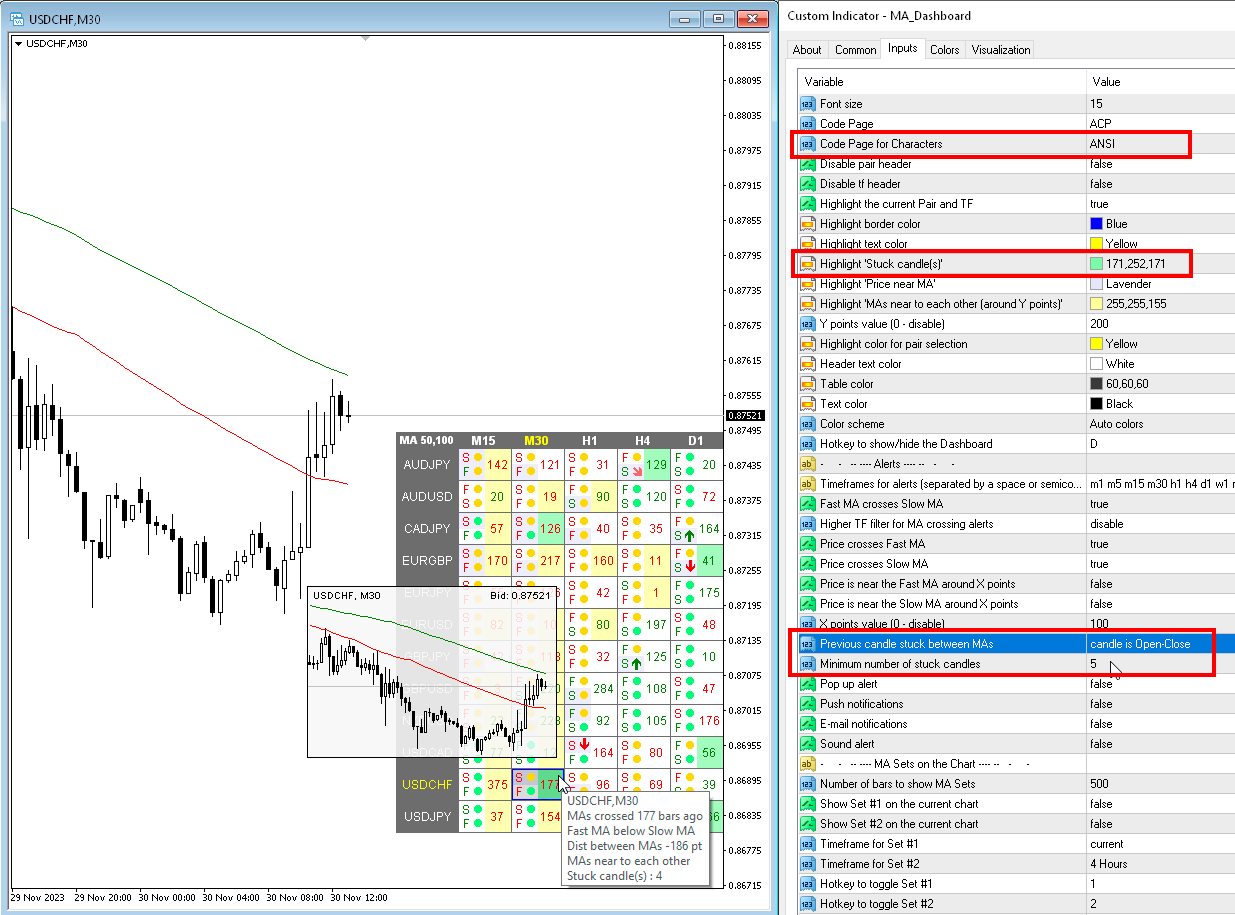
Previous candle stuck between MAs — Si les bougies précédentes se trouvent entre deux MA, vous pouvez alors recevoir une alerte à ce sujet ou la voir dans le tableau.
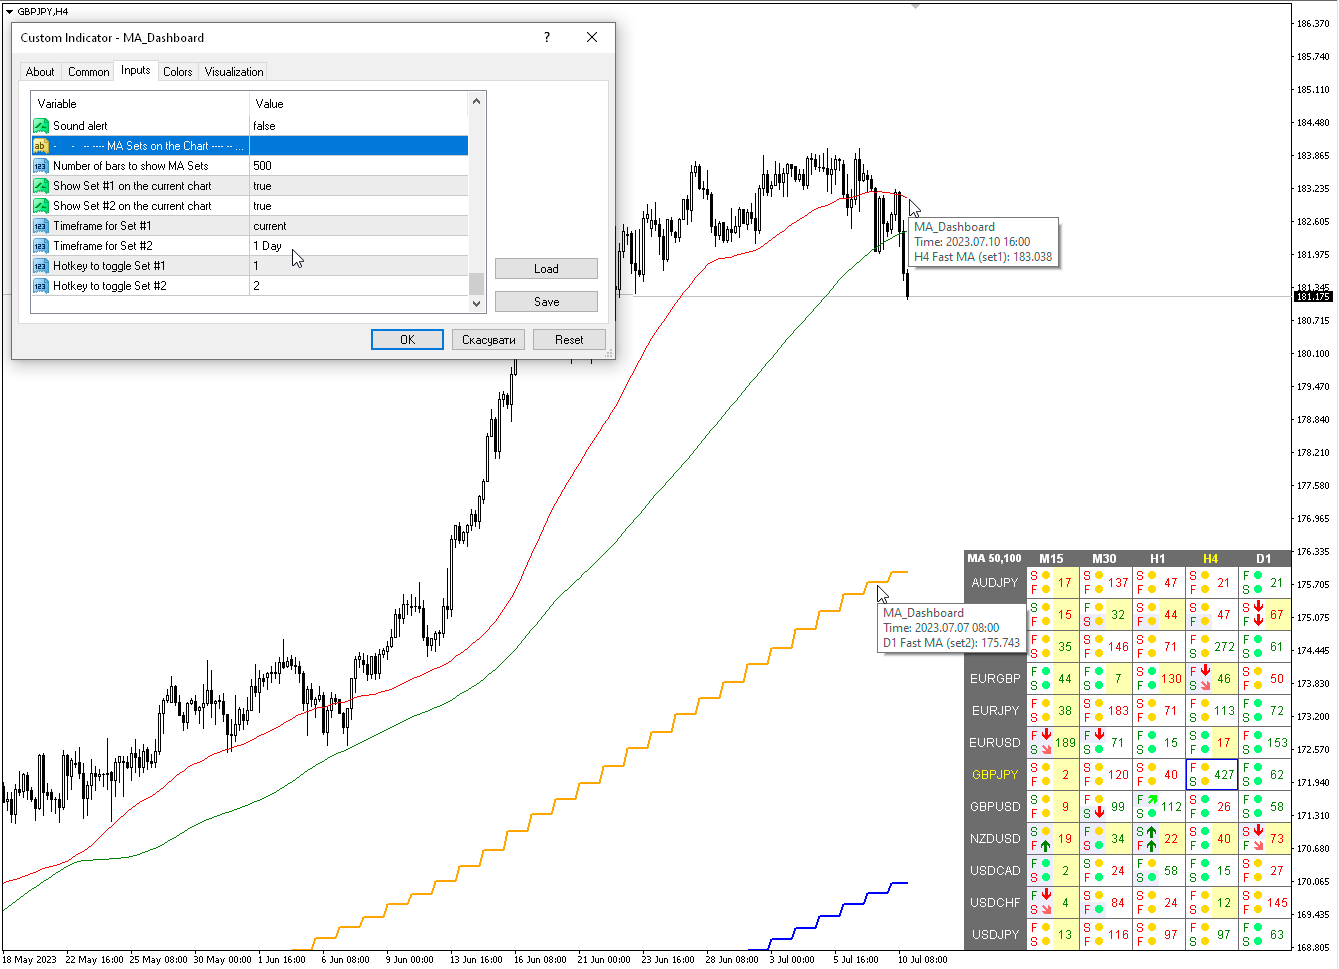
MA définit sur le graphique
Number of bars to show MA Sets — Nombre de barres pour afficher les ensembles MA
Show Set #1 on the current chart — Afficher l'ensemble n° 1 sur le graphique actuel
Show Set #2 on the current chart — Afficher l'ensemble n°2 sur le graphique actuel
Timeframe for Set #1 — Délai pour l’ensemble n°1
Timeframe for Set #2 — Calendrier pour l’ensemble n°2
Hotkey to toggle Set #1 — Touche de raccourci pour basculer vers l'ensemble n° 1
Hotkey to toggle Set #2 — Touche de raccourci pour basculer vers l'ensemble n° 2
Graphique contextuel
Enable Popup chart — Activer le graphique contextuel
Candle size — Taille de la bougie
Width (pix) — Largeur (pixels)
Height (pix) — Hauteur (pix)
Font size — Taille de police
Transparency (0-255) — Transparence (0-255)

Very good.