MA Dashboard
- Göstergeler
- Sürüm: 4.10
- Güncellendi: 19 Temmuz 2026
- Etkinleştirmeler: 10

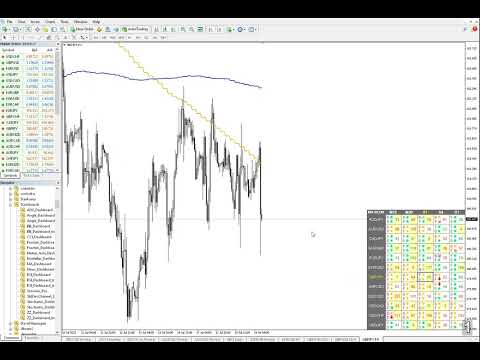
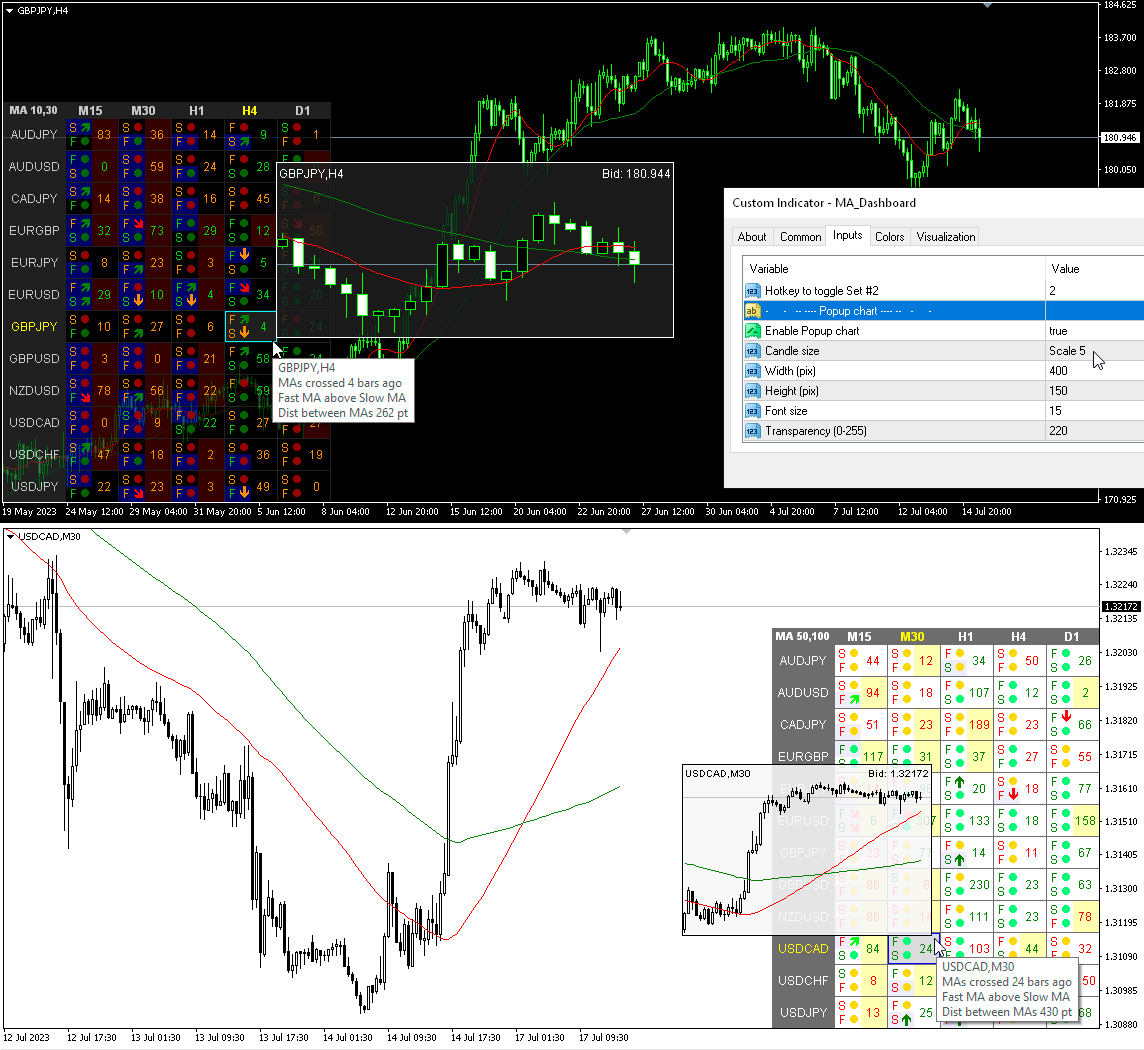
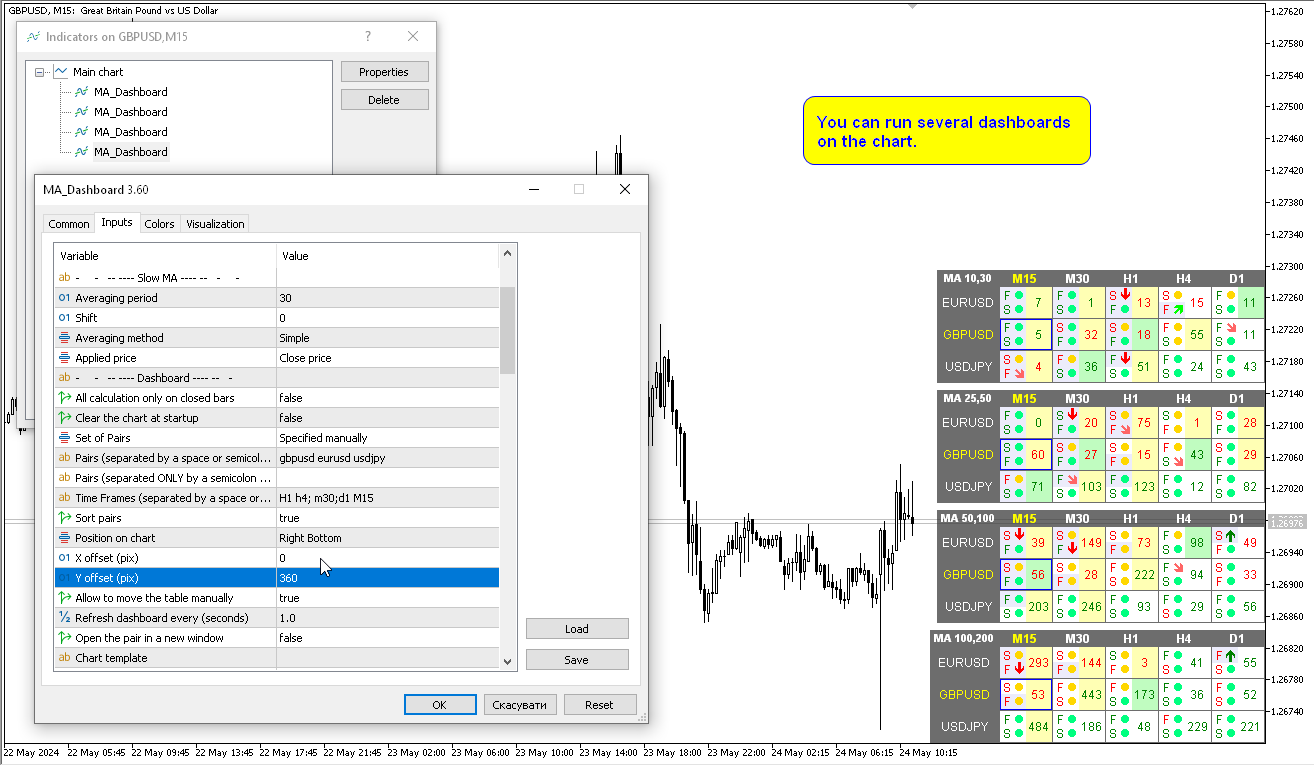
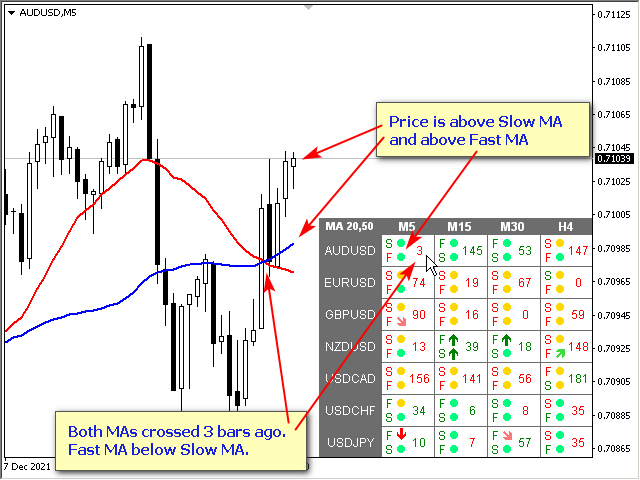
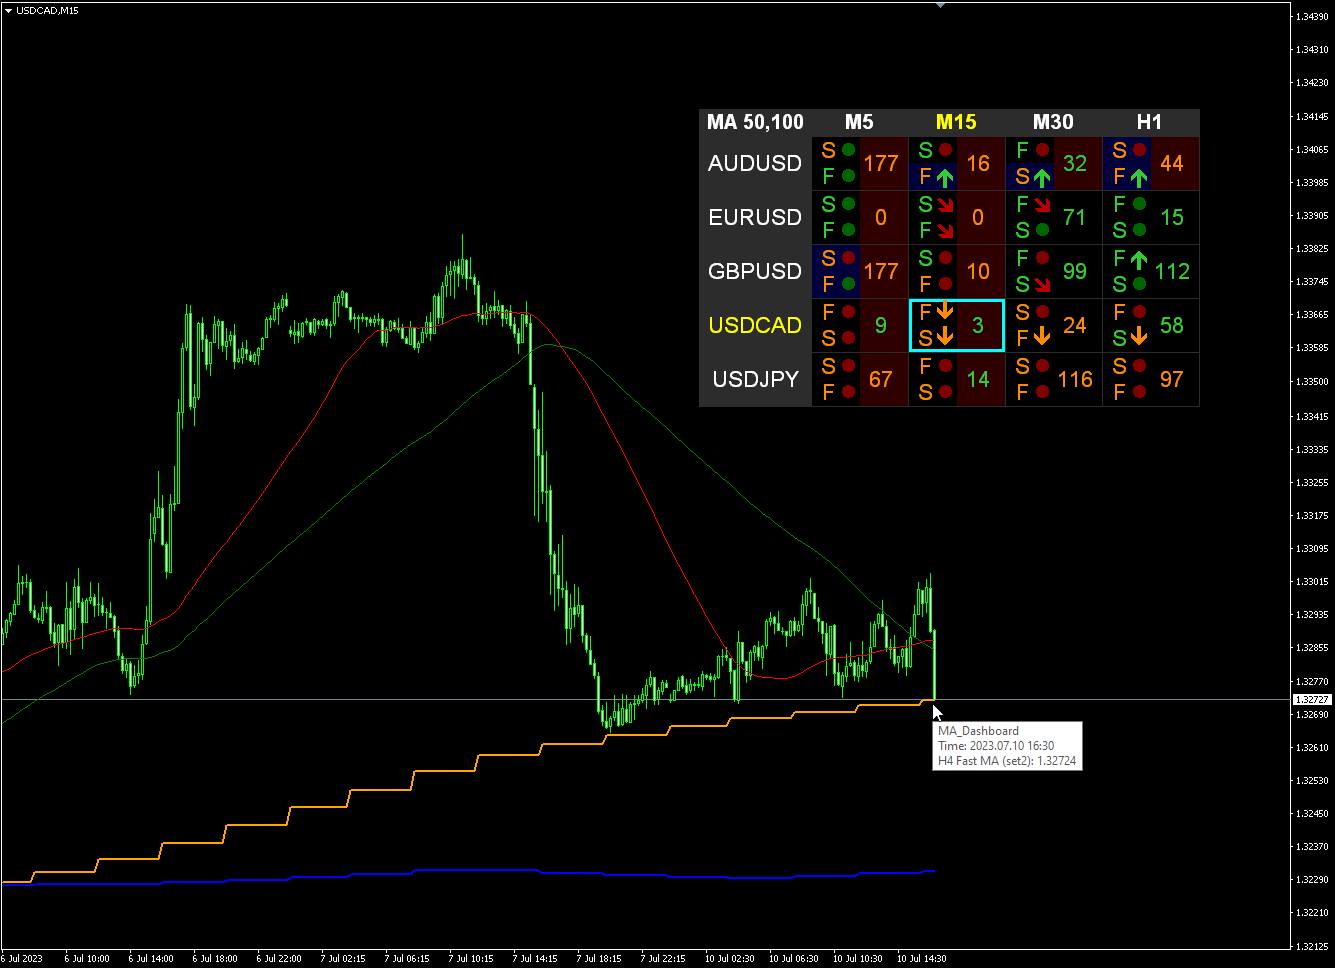
Hareketli Ortalama (MA) göstergesinin çok para birimi ve çok zaman çerçeveli modifikasyonu. Kontrol panelinde göstergenin mevcut durumunu görebilirsiniz - Hızlı MA ve Yavaş MA'nın kırılmaları ve dokunuşları (fiyata göre) ve ayrıca MA çizgilerinin birbirleri arasındaki kesişimi (hareketli ortalama geçiş). Parametrelerde istediğiniz para birimini ve zaman dilimlerini belirleyebilirsiniz. Ayrıca gösterge, fiyatın çizgilere temas etmesi ve geçişleri hakkında bildirimler gönderebilir. Noktalı bir hücreye tıkladığınızda bu sembol ve nokta açılacaktır. Bu MTF Tarayıcıdır. Grafikte birkaç kontrol paneli çalıştırabilirsiniz.
Gösterge mevcut grafikte Hızlı MA ve Yavaş MA çizgilerini görüntüler. Grafik için MA zaman dilimini seçebilir ve diğer zaman dilimlerinden (MTF MA) MA'yı izleyebilirsiniz. İki MA kümesinin kısayol tuşları varsayılan olarak "1" ve "2"dir.
Kontrol panelini grafikten gizlemenin anahtarı varsayılan olarak "D"dir
Parametreler
Fast MA — Hızlı MA
Averaging period — Ortalama periyodu.
Shift — Vardiya.
Averaging method — Ortalama alma yöntemi.
Applied price — Uygulanan fiyat.
Slow MA — Yavaş MA
Averaging period — Ortalama periyodu.
Shift — Vardiya.
Averaging method — Ortalama alma yöntemi.
Applied price — Uygulanan fiyat.
Gösterge Paneli
All calculation only on closed bar — Tüm hesaplamalar yalnızca kapalı çubukta yapılır.
Clear the chart at startup — başlangıçta grafiği temizleyin.
Set of Pairs — Çift Seti
— Market Watch — MT'nin "Piyasa Gözlemi"nden çiftler.— Specified manually — "Çiftler" parametrelerinde manüel olarak belirtilen çiftler.— Current pair — yalnızca geçerli çifti gösterir.
Pairs (separated by a space or semicolon) — boşluk veya noktalı virgülle ayrılmış sembollerin listesi. Para birimi adları, büyük/küçük harf ve önek/sonek korunarak tam olarak komisyoncununki gibi yazılmalıdır.
Time Frames (separated by a space or semicolon) — boşluk veya noktalı virgülle ayrılmış zaman dilimlerinin listesi (çoklu zaman dilimi).
Sort pairs — çiftlerin listesini sıralama.
Position on chart — panelin grafikte görüntüleneceği köşe.
X offset (pix) — paneli X ekseni boyunca kaydırın;
Y offset (pix) — paneli Y ekseni boyunca kaydırın;
Refresh dashboard every (seconds) — tüm çiftler ve zaman dilimleri için güncelleme süresi.
Open the pair in a new window — Çifti yeni bir pencerede açın — tıklayarak yeni bir grafik penceresinde bir sembol açın.
Chart template — Grafik şablonu — grafik yeni bir pencerede açılırsa, grafiğin şablonunun adı.
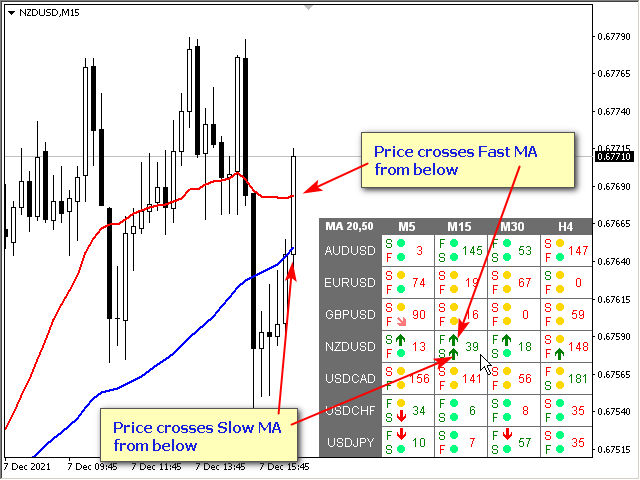
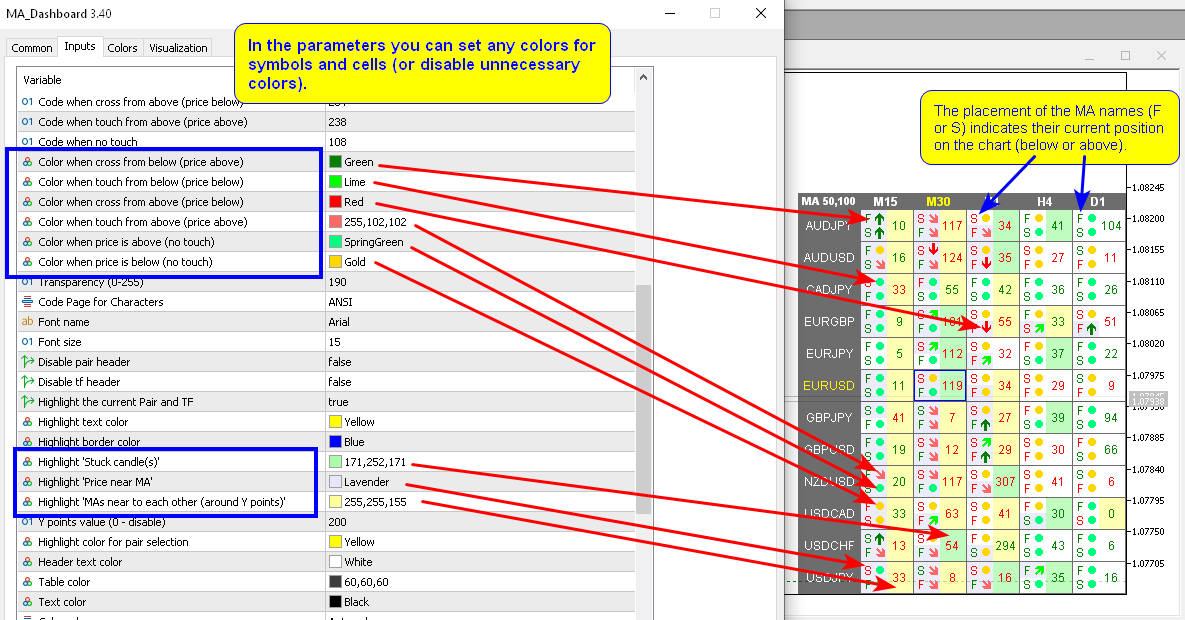
Code when cross from below (price above) — Alttan çaprazlama yapıldığında kod (fiyat yukarıda);
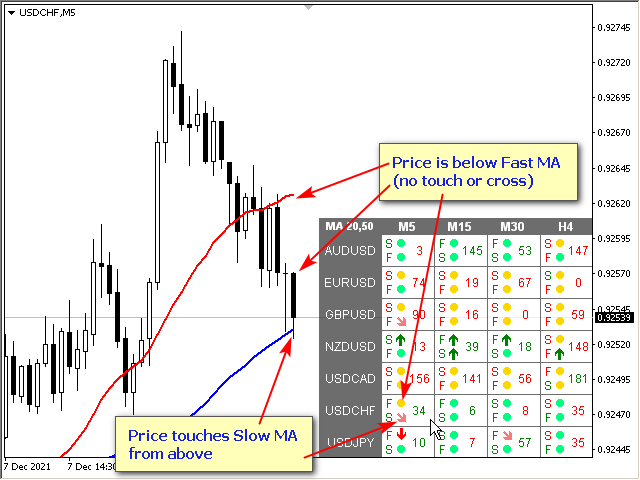
Code when touch from below (price below) — Alttan dokunulduğunda kod (fiyat aşağıdadır);
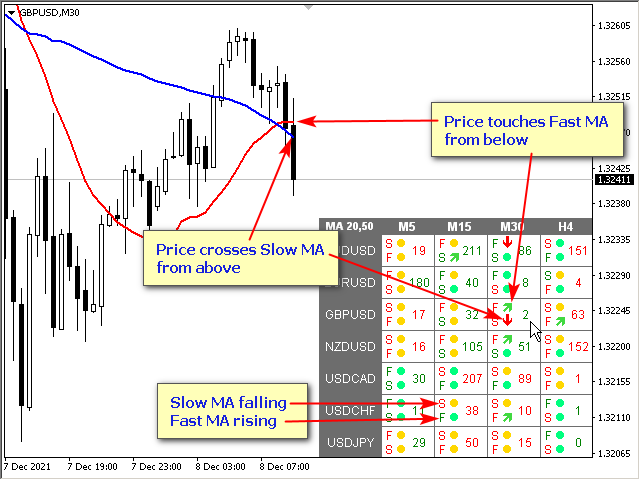
Code when cross from above (price below) — Yukarıdan geçerken kod (fiyat aşağıdadır);
Code when touch from above (price above) — Yukarıdan dokunulduğunda kod (yukarıdaki fiyat);
Code when no touch — Dokunma olmadığında kodlayın;
Transparency (0-255) — Şeffaflık (0-255);
Font name — Yazı tipi adı;
Font size — Yazı Boyutu.
Uyarılar
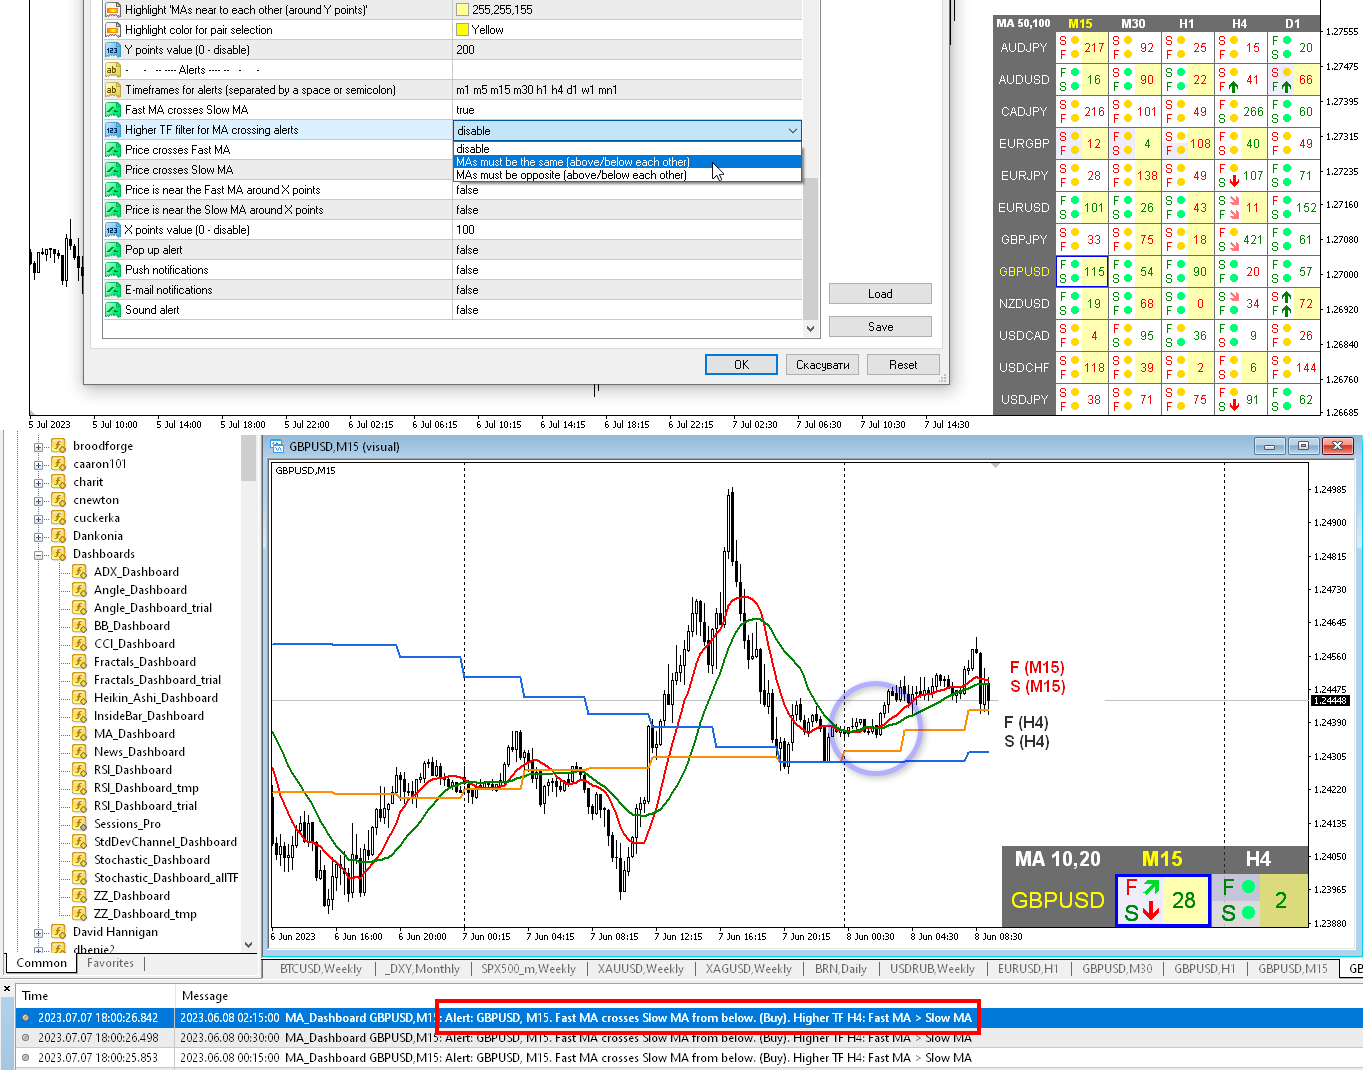
Timeframes for alerts (separated by a space or semicolon) — Uyarılara ilişkin zaman dilimleri (boşluk veya noktalı virgülle ayrılmış).
Fast MA crosses Slow MA — Hızlı MA, Yavaş MA'yı keser;
Higher TF filter for MA crossing alerts — MA geçiş uyarıları için daha yüksek TF filtresi — filtre etkinleştirildiğinde, MA'lar kesiştiğinde, gösterge bir sonraki daha yüksek zaman dilimindeki (kontrol panelinde) MA değerlerini kontrol edecektir. Daha yüksek zaman dilimindeki MA'lar belirtilen koşulları karşılıyorsa MA geçiş uyarısı gönderilecektir, aksi takdirde herhangi bir uyarı verilmeyecektir.
- disable — devre dışı bırakmak
- MAs must be the same (above/below each other) — MA'lar aynı olmalıdır (birbirinin üstünde/altında)
- MAs must be opposite (above/below each other) — MA'lar zıt olmalıdır (birbirinin üstünde/altında)
Price crosses Fast MA — Fiyat Hızlı MA'yı geçiyor;
Price crosses Slow MA — Fiyat Yavaş MA'yı geçiyor;
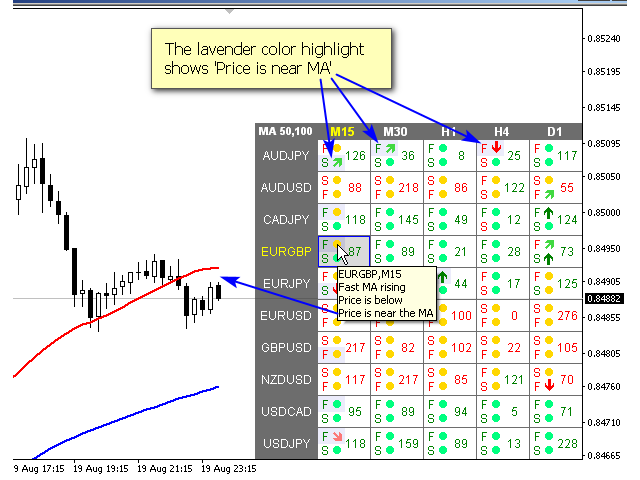
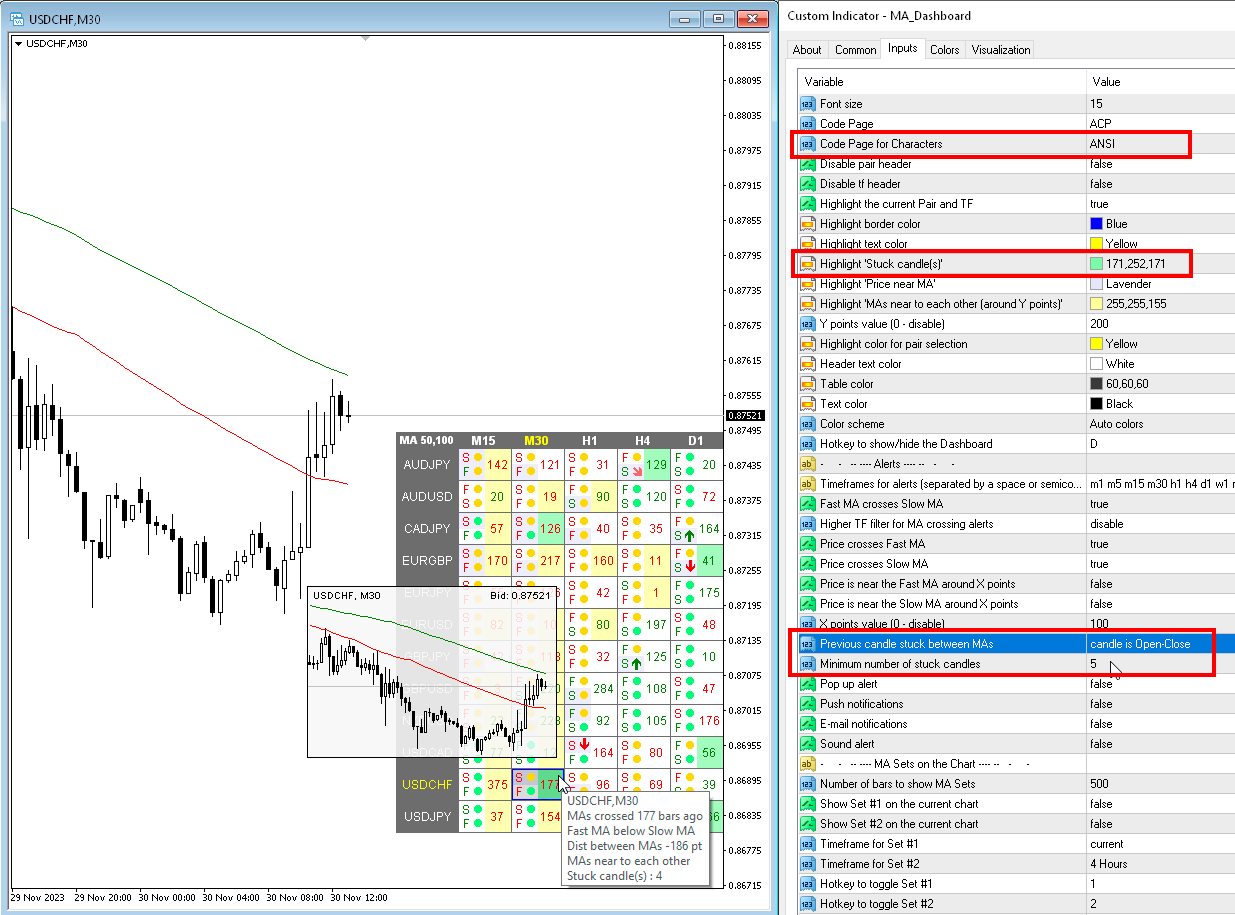
Price is near the Fast MA around X points — Fiyat X puan civarında Hızlı MA'ya yakın
Price is near the Slow MA around X points — Fiyat X puanları civarında Yavaş MA'ya yakın
Previous candle stuck between MAs — Önceki mumlar iki MA arasındaysa, bununla ilgili bir uyarı alabilir veya bunu tabloda görebilirsiniz.
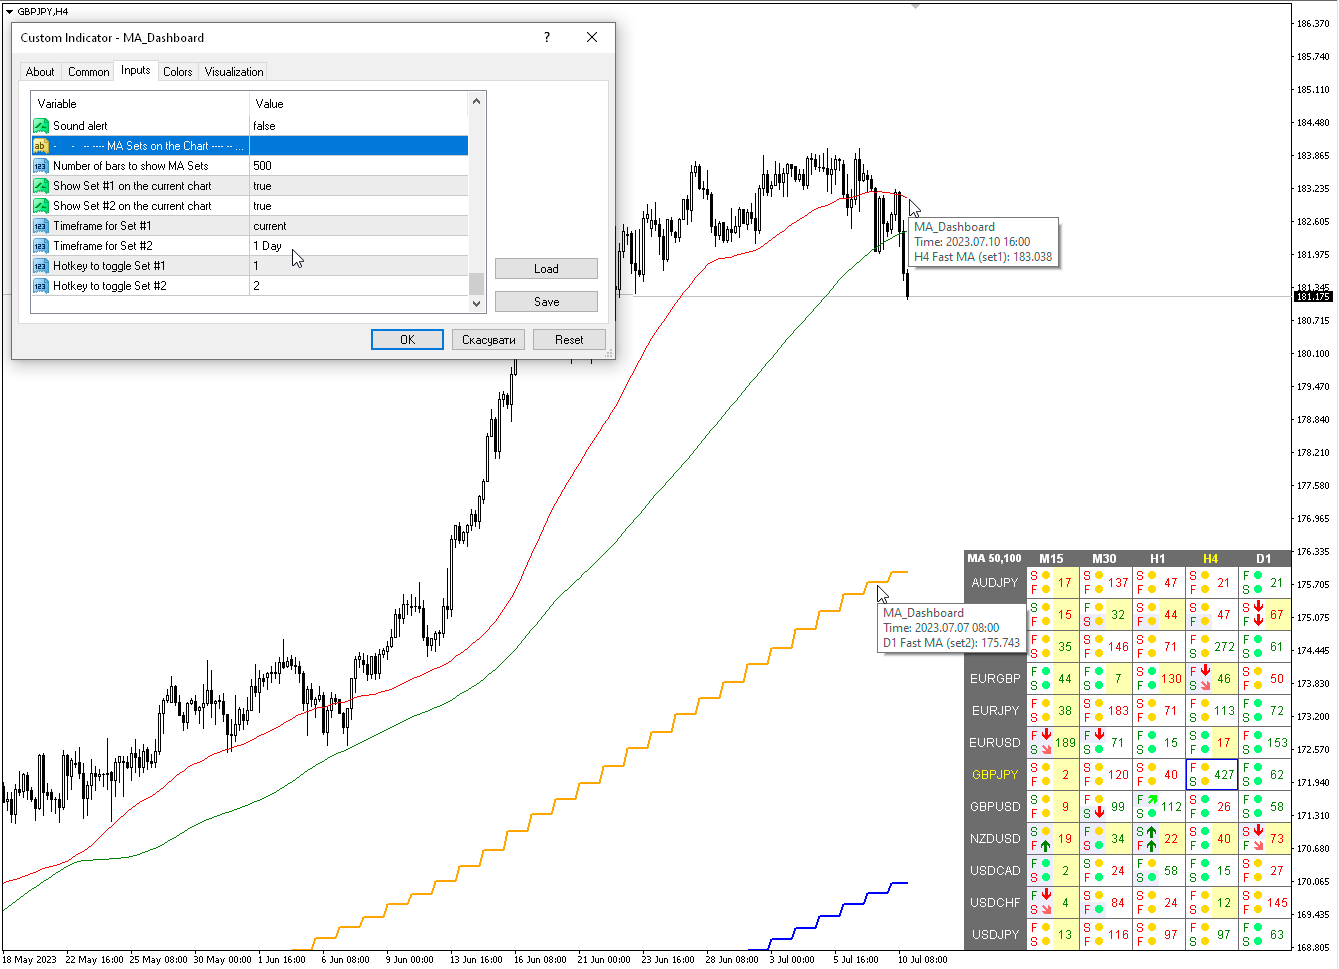
MA Sets on the Chart — Grafikteki MA Setleri
Number of bars to show MA Sets — MA Setlerini gösterecek çubuk sayısı
Show Set #1 on the current chart — Mevcut grafikte Set #1'i göster
Show Set #2 on the current chart — Mevcut grafikte Set #2'yi göster
Timeframe for Set #1 — Set #1 için Zaman Çerçevesi
Timeframe for Set #2 — Set #2 için Zaman Çerçevesi
Hotkey to toggle Set #1 — Set #1'i değiştirmek için kısayol tuşu
Hotkey to toggle Set #2 — Set #2'yi değiştirmek için kısayol tuşu
Popup chart — Açılan grafik
Enable Popup chart — Açılır grafiği etkinleştir
Candle size — Mum boyutu
Width (pix) — Genişlik (piks)
Height (pix) — Yükseklik (piksel)
Font size — Yazı Boyutu
Transparency (0-255) — Şeffaflık (0-255)

Very good.