MTF Supply Demand Zones
- 指标
- 版本: 2.5
- 更新: 26 七月 2024
- 激活: 20

下一代自动化供需区。适用于任何图表的创新算法。所有区域都是根据市场的价格行为动态创建的。
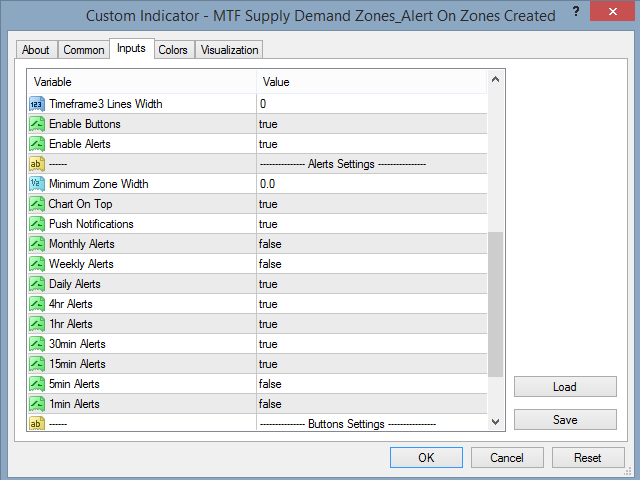
两种类型的警报 --> 1) 当价格触及区域时 2) 当新区域形成时
你不会再得到一个无用的指标。您将获得一个完整的交易策略和经过验证的结果。
新的功能:
价格触及供需区时发出警报
创建新的供应/需求区时发出警报
推送通知警报
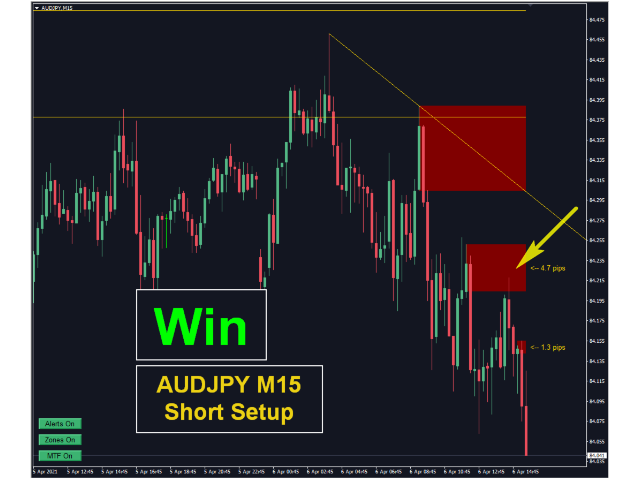
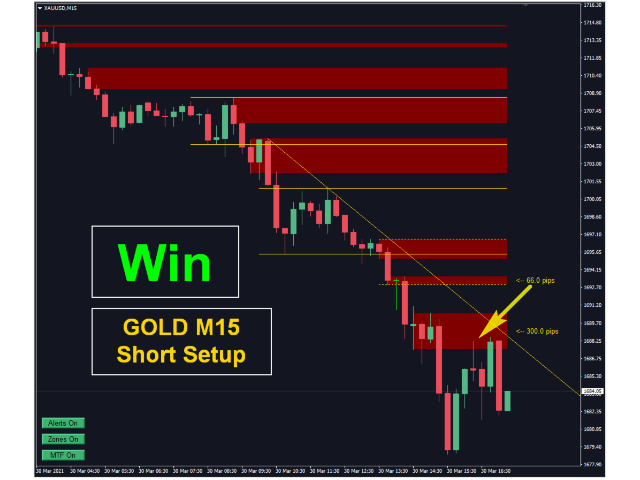
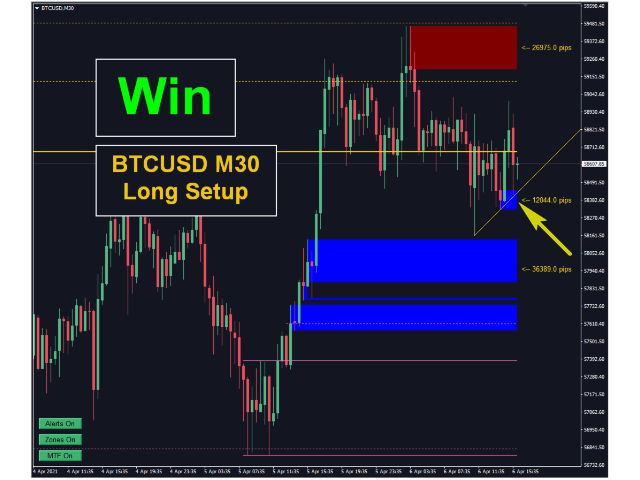
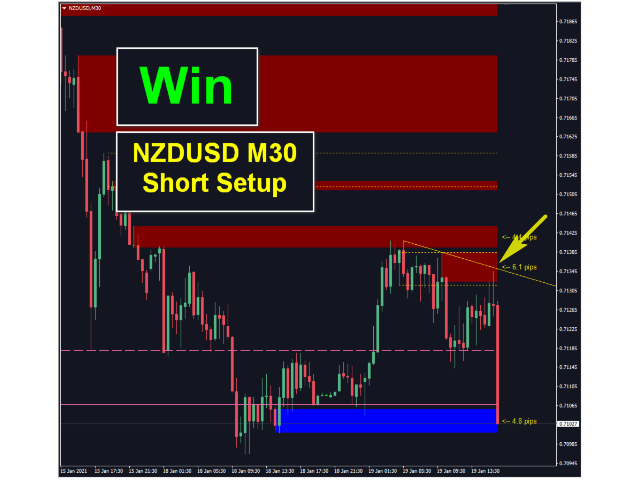
以点为单位的区域宽度标签
关于 MTF 的又一个时间表。因此,现在您将能够看到高于当前 3 个时间帧,而不是高于当前 2 个时间帧
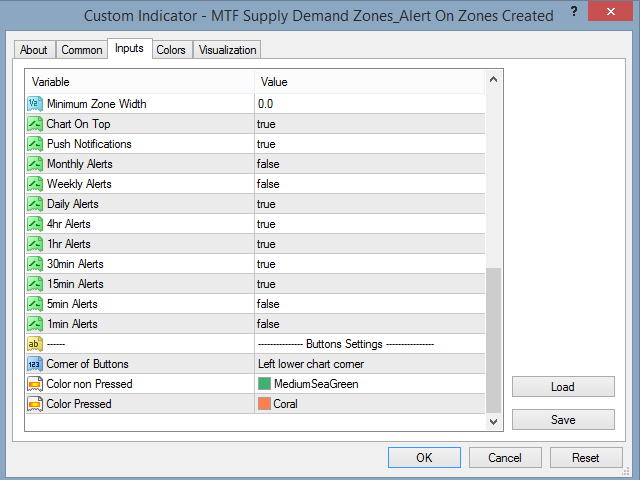
启用/禁用警报/区域/MTF 功能的按钮
您获得的优势:
消除交易中的情绪。
客观化您的交易条目。
通过高概率设置提高您的利润。
节省绘图区域的时间。
像专业人士一样交易金融市场。
任何市场的即时多时间框架分析。
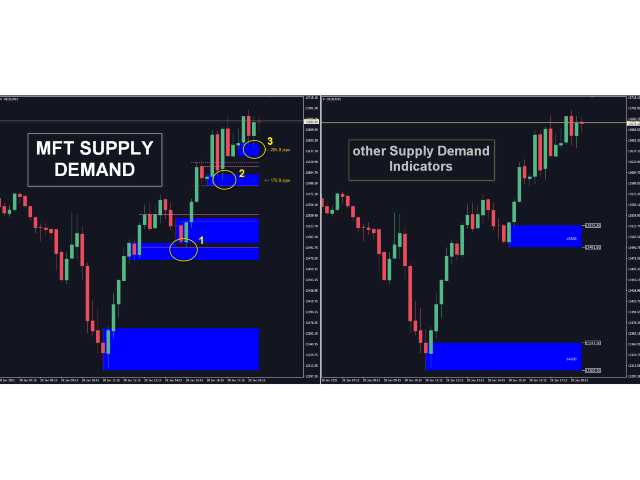
你在图表上看到了什么?
蓝色和红色矩形是当前时间范围的供需区。
虚线样式线是当前上方第一个时间范围内的供需区域。
实线样式线是当前上方第二个时间范围内的供需区。
您还可以从当前上方的第三个时间范围查看供应和需求区域。
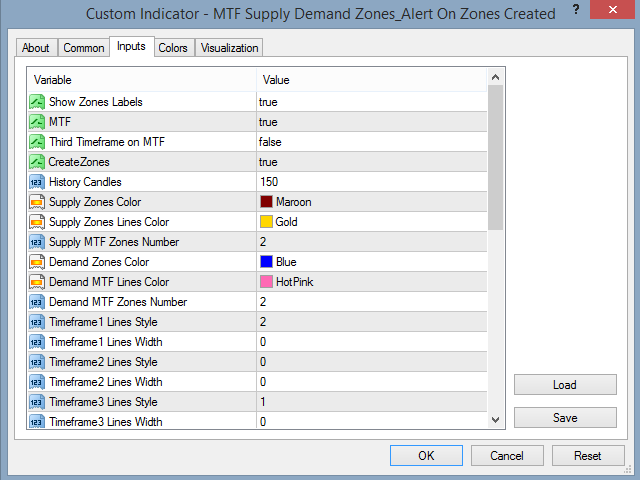
您可以从指标的输入参数更改矩形的颜色和线条的样式/宽度。
这个指标和其他供需指标一样吗?
不,该指标不仅仅是对现有免费指标的增强。
该指标创建区域的方式与市场上所有其他供需指标不同。
这是一个全新的工具。您可以查看下面的照片。
与其他供需指标的主要区别:
1. MTF 自动 SD 区域指标是多时间框架指标。从当前图表中,您可以看到两个上部时间框架的区域。例如,如果您的当前图表是 1 小时,您可以看到 4 小时和每日时间框架的供需区域。
2.算法是全新的,它是从头开始创建的。您可以看到甚至没有用其他指标绘制的区域。这些区域更准确,您可以找到更好的切入点。
3. 所有区域都是根据市场的价格行为动态创建的。这意味着区域正在根据市场动态改变其宽度。
4. 它是由专业交易者为想要将交易提升到一个新水平的新手和经验丰富的交易者设计的。
如果您需要任何有关如何使用该指标将您的交易提升到新水平的更多信息,我很乐意为您提供帮助。
您可以在我的个人资料上向我发送个人消息。
两种类型的警报 --> 1) 当价格触及区域时 2) 当新区域形成时
你不会再得到一个无用的指标。您将获得一个完整的交易策略和经过验证的结果。
新的功能:
价格触及供需区时发出警报
创建新的供应/需求区时发出警报
推送通知警报
以点为单位的区域宽度标签
关于 MTF 的又一个时间表。因此,现在您将能够看到高于当前 3 个时间帧,而不是高于当前 2 个时间帧
启用/禁用警报/区域/MTF 功能的按钮
您获得的优势:
消除交易中的情绪。
客观化您的交易条目。
通过高概率设置提高您的利润。
节省绘图区域的时间。
像专业人士一样交易金融市场。
任何市场的即时多时间框架分析。
你在图表上看到了什么?
蓝色和红色矩形是当前时间范围的供需区。
虚线样式线是当前上方第一个时间范围内的供需区域。
实线样式线是当前上方第二个时间范围内的供需区。
您还可以从当前上方的第三个时间范围查看供应和需求区域。
您可以从指标的输入参数更改矩形的颜色和线条的样式/宽度。
这个指标和其他供需指标一样吗?
不,该指标不仅仅是对现有免费指标的增强。
该指标创建区域的方式与市场上所有其他供需指标不同。
这是一个全新的工具。您可以查看下面的照片。
与其他供需指标的主要区别:
1. MTF 自动 SD 区域指标是多时间框架指标。从当前图表中,您可以看到两个上部时间框架的区域。例如,如果您的当前图表是 1 小时,您可以看到 4 小时和每日时间框架的供需区域。
2.算法是全新的,它是从头开始创建的。您可以看到甚至没有用其他指标绘制的区域。这些区域更准确,您可以找到更好的切入点。
3. 所有区域都是根据市场的价格行为动态创建的。这意味着区域正在根据市场动态改变其宽度。
4. 它是由专业交易者为想要将交易提升到一个新水平的新手和经验丰富的交易者设计的。
如果您需要任何有关如何使用该指标将您的交易提升到新水平的更多信息,我很乐意为您提供帮助。
您可以在我的个人资料上向我发送个人消息。


Best S&D indicator on the market, accurate, the alerts work across all instruments and the support has been quick and responsive, thankyou!