Levels of Timeframes for MT5
- 指标
- 版本: 4.90
- 更新: 19 七月 2026
- 激活: 10

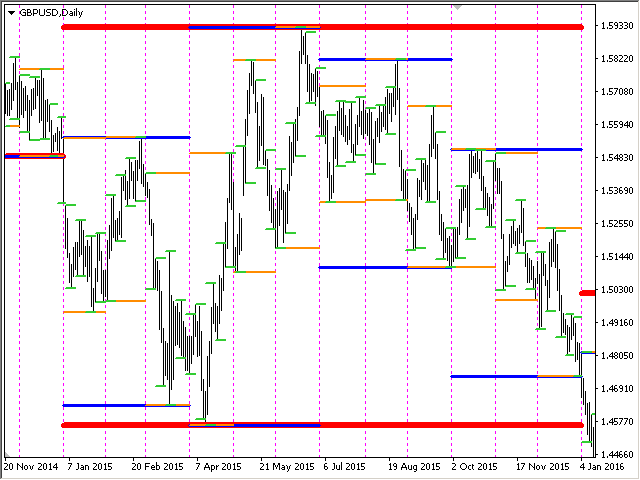
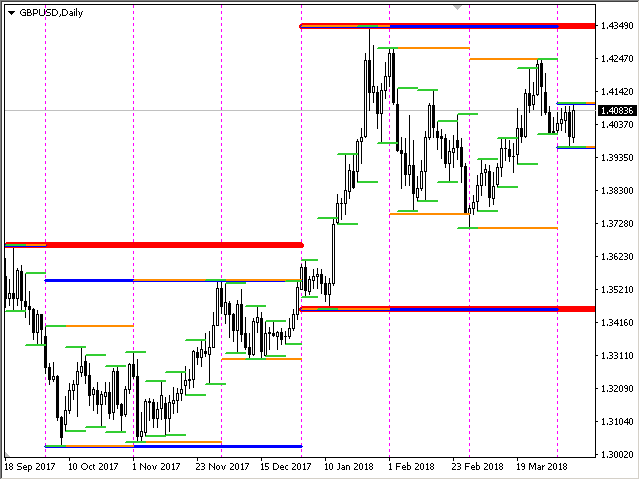
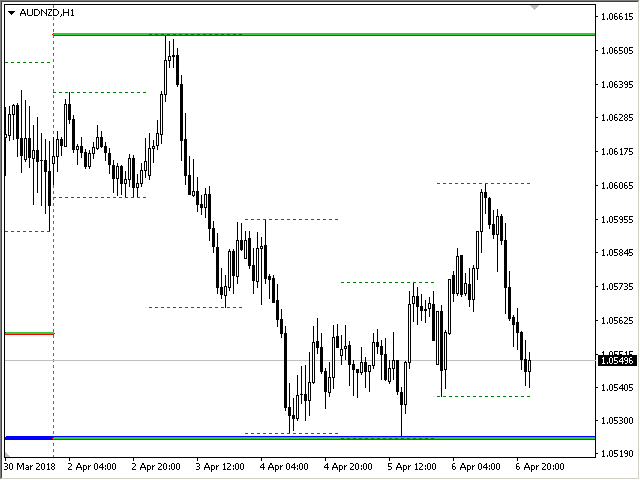
该指标显示其他(和非标准)时间范围的最高价/最低价/开盘价/收盘价 - 年、6 个月、4 个月、3 个月、2 个月、月、周、日、H3-H6-H8-H12 小时 M45 M90。 您还可以设置打开蜡烛的班次并构建虚拟蜡烛。
这些时间范围之一的“周期分隔符”以垂直线的形式提供。 可以针对当前或先前水平的突破(突破昨天/上周的高点/低点等)配置警报。
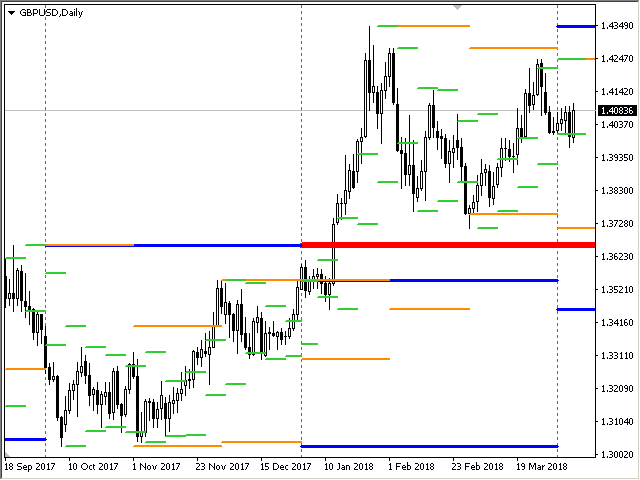
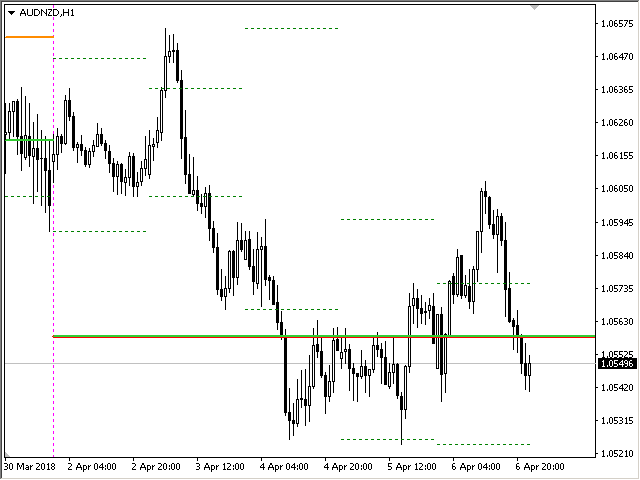
您还可以将所有级别向右移动一个周期。 也就是说,当前周期将显示前一周期的最高价/最低价
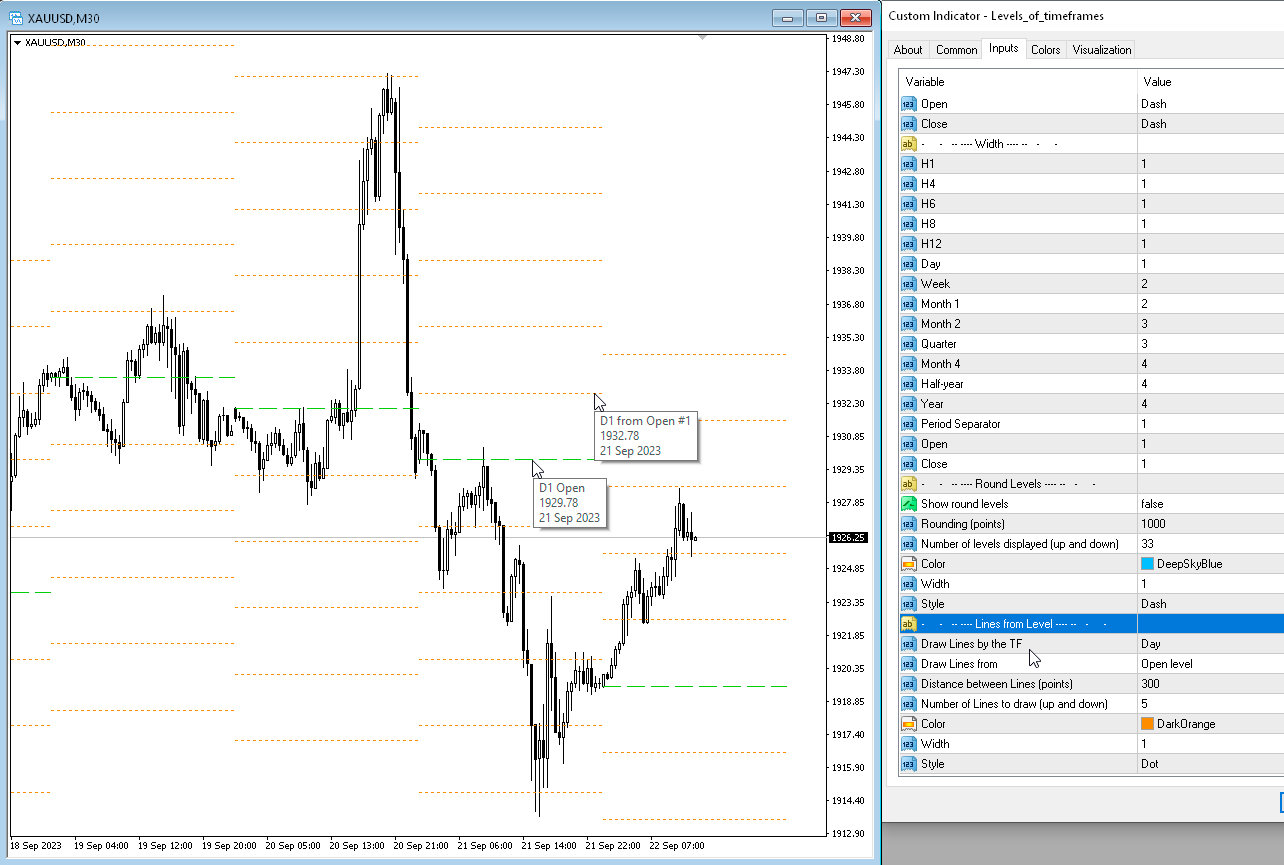
参数
Number of levels to calculate (0-all) — 屏幕上将显示多少条。
Change the opening of bars (hours) — 将蜡烛的开盘移动 n 小时。 该指标将根据新的开盘时间绘制虚拟柱。 MN1 以上的周期不会改变。
Move the levels to the right — 将所有级别向右移动一格。 您将看到当前蜡烛的先前水平。
Period Separator (vertical lines) — 显示垂直线、周期分隔符。
Show High Lines (trigger for all highs) — 禁用或启用绘制高位。
Show Low Lines (trigger for all lows) — 禁用或启用绘制低电平。
Show Open Line — 将绘制开盘价线的时间范围。 您可以选择“All TF for Highs & Lows”,并且将根据为高低点指定的周期绘制水平。
Draw Open Line immediately when a new bar appears.
Draw Open Line immediately when a new bar appears.
Show Close Line — 将绘制收盘价线的时间范围。 您可以选择“All TF for Highs & Lows”,并且将根据为高低点指定的周期绘制水平。
Week starts on Sunday — 在终端中,默认情况下,W1 蜡烛从星期日开始。 如果设置为“false”,则一周将从星期一开始。
Show levels (显示级别):
from M45/M90 to Year — 显示选定期间的高低点。 年、6 个月、4 个月、3 个月、2 个月、月、周、日、4-6-8-12 小时
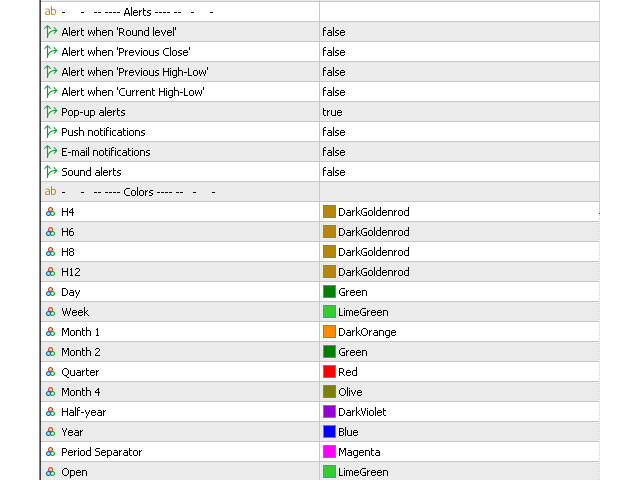
Alerts (警报)
Alert when 'Round level' — 当价格触及整数水平时发送警报。
Alert when 'Current Highs-Lows' — 当价格触及当前水平时发送警报。
Alert when 'Previous High-Low' — 当价格触及先前水平时发送警报。
Pop-up alerts — 弹出警报。
Push notifications — 推送通知。
E-mail notifications — 电子邮件通知。
Sound alerts — 声音警报。
Colors (颜色)
from M45 to Year — 周期线的颜色调整。
Period Separator — 句点分隔线的颜色。
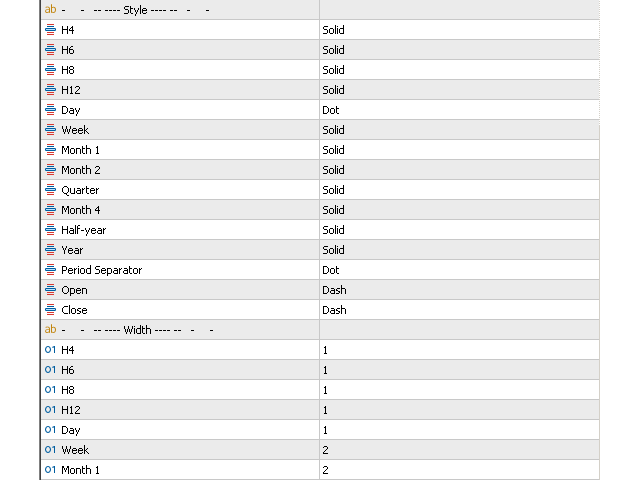
Line style (线条样式)
from M45 to Year — 周期线样式。
Period Separator — 句点分隔线的样式。
Line width (行宽)
from M45 to Year — 周期线宽度。
Period Separator — 周期分隔线的宽度。
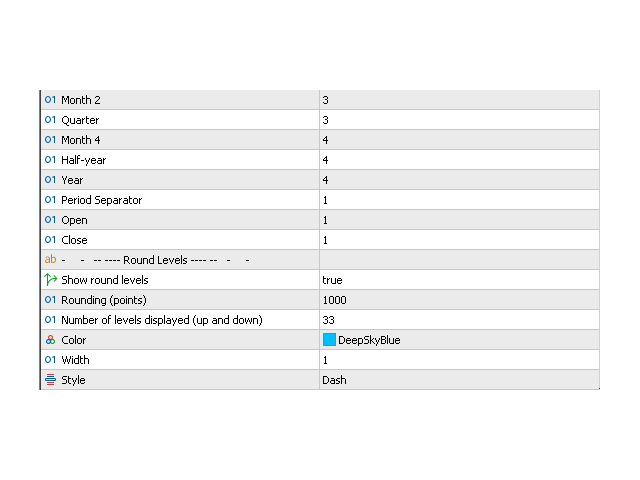
Round Levels (圆形水平)
Show round levels — 显示圆形级别。
Rounding (points) — 四舍五入(点)。
Number of levels displayed (up and down) — 要显示的级别数,从当前级别向上和向下。
Color — 颜色。
Width — 宽度。
Style — 风格。
该指标显示指定时间范围的 OHLC(HLOC)(定制条形图或定制蜡烛图)。


Great tool for price action trading. Developer does great work and listens to user feedback.