Berma Bands

5

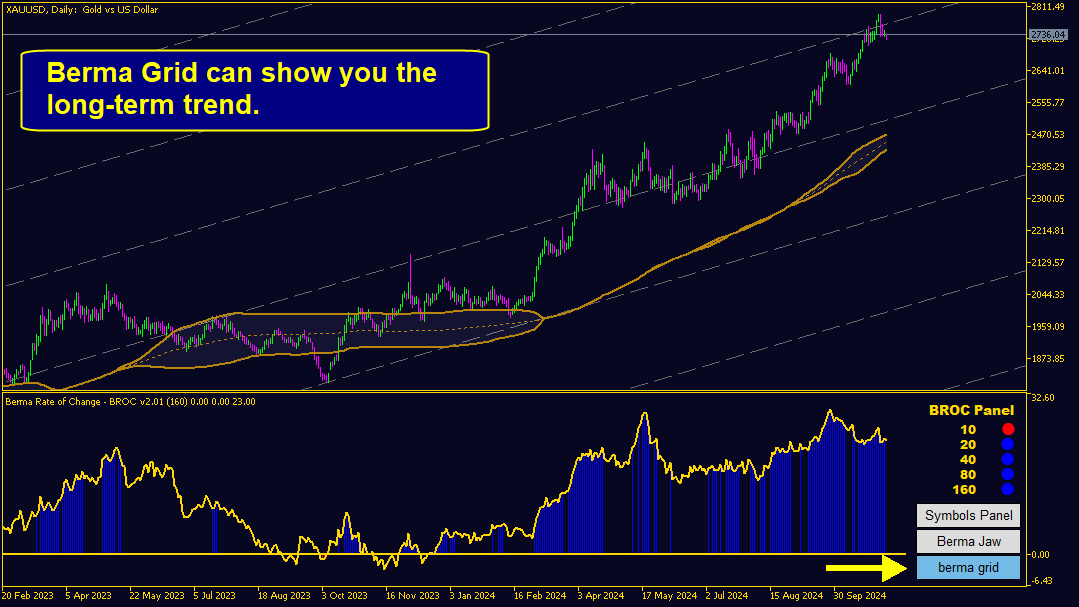
Berma 波段 (BBs) 指标对于寻求识别和利用市场趋势的交易者来说是一种有价值的工具。通过分析价格与 BBs 之间的关系,交易者可以辨别市场是处于趋势阶段还是区间波动阶段。

访问[ Berma Home Blog ] 了解更多信息。

Berma 带由三条不同的线组成:上 Berma 带、中 Berma 带和下 Berma 带。这些线围绕价格绘制,直观地表示价格相对于整体趋势的变动。这些带之间的距离可以洞察波动性和潜在的趋势逆转。

当 Berma Bands 线相互分离时,通常表明市场正在进入横盘或区间波动时期。这表明缺乏明确的方向性。交易者可能会发现在这些时期内很难识别趋势,因此可能需要等待更清晰的趋势出现。

当 Berma Bands 线汇聚成一条线时,通常表示趋势环境强劲。这种汇聚表明存在明显的方向性偏差,因为价格波动性足以随趋势而变化。交易者可能会发现在这些时期更容易识别潜在的入场点和出场点,因为趋势的势头可以提供有利的交易机会。然而,重要的是要注意整体趋势中的潜在回调或修正。

Berma 带根据价格蜡烛图与上带和下带的相互作用提供明确的买入和卖出信号。当价格蜡烛图首次收于 Berma 带上轨上方时,会出现买入信号,表明可能出现上升趋势。相反,当价格蜡烛图首次收于 Berma 带下轨下方时,会出现卖出信号,表明可能出现下降趋势。交易者可以使用这些信号作为进入或退出头寸的指导,但在做出交易决策时,考虑其他因素和风险管理策略也是必不可少的。

Berma Bands 可通过提供买入和卖出信号的实时警报来提高交易效率。这可以通过声音通知、移动警报或电子邮件通知来实现。这些警报可以帮助交易者即使远离交易屏幕也能随时了解潜在的交易机会,从而让他们能够迅速对市场走势做出反应。

Berma Bands 的最重要的投入。

BB 蜡烛 [最小 =2]:用于波段计算的蜡烛数量。如果少于 2 个,指标将打印一条消息,并且此参数将重置为默认值 (= 160)。

显示箭头和垂直线:
此参数可让您在图表上看到潜在的买入和卖出信号。您可以选择显示其中一个或两个。

图表配色方案:在这里您可以找到现成的配色方案,让您的图表看起来更专业。如果他想使用您自己的颜色,您可以选择(不执行任何操作)。

如果您有任何疑问,请通过私信联系我,或者在评论部分写下您的问题。我上线后会立即回复您的消息。

评分 34
equalitygr
193
equalitygr 2026.05.11 10:59 
 

Very simple and successful system.

I am updating my review that I have added 2 hours before.

Not only is this system the best and the simplest that I have ever seen, but the support of the developer is unbelievable. He is helping me a lot, giving me many examples and giving me tips for every detail of this system.

I am not an affiliate with this indicator.

123478888
19
123478888 2026.02.19 19:07 
 

Excellent and highly accurate trend indicator. Easy to use and provides clear signals. Highly recommended 👍

Juergen Loebach
1321
Juergen Loebach 2025.09.18 11:34 
 

The manual and video clips are particularly Very useful for beginners. indicator delivered very good results in the test.

推荐产品
RBreaker
Zhong Long Wu
RBreaker Gold Indicators 是黄金期货一种短线日内交易策略,它结合了趋势跟踪和日内反转两种交易方式,既能捕捉趋势行情的利润,又能在行情反转时及时止盈并顺势反手。 该策略曾连续15年被美国《Futures Truth》杂志评选为前十大最赚钱的交易策略之一,具有很长的生命周期,至今仍在国内外普遍使用与研究。 本指标结合了2026年期货黄金的走势,依据14日ATR指标,分别定义了突破系数A,观察系数B,反转系数R更合理的数值,非常不错的指标,已实现年稳定盈利,值得推荐~ 以上指标适合高波动品种,参数适合期货黄金,股指期货等,如果需要其他品种行情,需要单独设定 突破系数A,观察系数B,反转系数R,进行回测才能使用。 欢迎指标售后有问题可以加+V:504282029
CosmiCLab FIBO
Kirils Subins
CosmiCLab SMC FIBO CosmiCLab SMC FIBO is a professional trading indicator designed for traders who use Smart Money Concepts (SMC), market structure analysis and Fibonacci retracement levels. The indicator automatically detects market swings and builds Fibonacci levels based on the latest impulse movement. It also identifies market structure changes such as BOS (Break of Structure) and CHOCH (Change of Character), helping traders understand the current market direction. CosmiCLab SMC FIBO also pr
Fibaction
Abdelkhalek Orabi
Indicator Name: Fibaction – price action candle Detector Description: Fibo Signal Boxes is a powerful Smart Money Concept (SMC)-inspired indicator that auto-detects price action candles. bullish hammers and shooting stars, then draws precise Fibonacci entry zones and multiple take-profit levels directly on the chart. as for the SL personally i use 40 pips rules  Key Features: Detects bullish hammer and shooting star reversal candles. Automatically draws Fibonacci entry and TP boxes. as
"Impulses and Corrections 5" is created to help traders navigate the market situation. The indicator shows multi-time frame upward and downward "Impulses" of price movements. These impulses are the basis for determining the "Base" , which is composed of zones of corrections of price movements, as well as "Potential" zones for possible scenarios of price movement. Up and down impulses are determined based on a modified formula of Bill Williams' "Fractals" indicator. The last impulse is always "U
Aura Smc Quantum H4
Chaibadee Dechtanankul
AURA SMC QUANTUM V1.01 code in English, structured for a professional presentation or MQL5 Market description: AURA SMC QUANTUM V1.01 | Logic Breakdown The Aura SMC Quantum is an advanced automated trading system (EA) specifically engineered for Gold (XAUUSD) on the H4 timeframe. It combines high-probability Smart Money Concepts (SMC) with a sophisticated Hybrid Grid management system. 1. Market Analysis Strategy (SMC & Trend Filter) The core "intelligence" of the EA relies on a dual-layer confi
Trend Master V2
Oratile Pitsoane
What Is Trend Master Pro? Trend Master Pro   is a professional-grade trend trading indicator built for MetaTrader 5. It was designed with one goal in mind — to keep you on the right side of the market at all times by combining three powerful technical tools into a single, clean, easy-to-read display directly on your price chart. Instead of cluttering your screen with multiple separate indicators, Trend Master Pro fuses an   EMA Ribbon trend filter , a   ZigZag swing point engine , and a   breako
Automated Trendlines MT5
Georgios Kalomoiropoulos
趋势线是外汇交易中最重要的技术分析工具。不幸的是,大多数交易者没有正确绘制它们。自动趋势线指标是专业交易者的专业工具,可帮助您可视化市场的趋势运动。 有两种类型的趋势线看涨趋势线和看跌趋势线。 在上升趋势中,外汇趋势线是通过价格变动的最低摆动点绘制的。 连接至少两个“最低点”将创建一条趋势线。 在下跌趋势中,趋势线是通过价格走势的最高摆动点绘制的。 连接至少两个“最高点”将创建一条趋势线。 趋势线何时突破? 当看跌蜡烛收于看涨​​趋势线下方并且蜡烛的高点在趋势线上方时,看涨趋势线会被打破。 当看涨蜡烛收于看跌趋势线上方并且蜡烛的低点低于趋势线时,看跌趋势线会被打破。 趋势线何时删除? 当一根完整的蜡烛在看涨趋势线下方形成时,看涨趋势线将被删除。 当完整的蜡烛在看跌趋势线上方形成时,看跌趋势线将被删除。 您可以从输入参数更改看涨和看跌趋势线的颜色和宽度。
Scan pattern
VLADISLAV AKINDINOV
The indicator is designed to help in making a decision on the direction of trading (buy or sell). It is a history scanner that searches for matches of the current pattern (combination of several current bars) with historical data in percentage terms by the relative vertical position of candles relative to each other, the size of each candle, the size of the candle body and the candle shadows. In history, the matches found are indicated by vertical lines on the candle of the beginning of the soug
Your Trend Friend
Luigi Nunes Labigalini
5 (1)
The trend is your friend! Look at the color of the indicator and trade on that direction. It does not  repaint. After each candle is closed, that's the color of the trend. You can focus on shorter faster trends or major trends, just test what's most suitable for the symbol and timeframe you trade. Simply change the "Length" parameter and the indicator will automatically adapt. You can also change the color, thickness and style of the lines. Download and give it a try! There are big movements w
Crypto_Forex 指标 PINBAR 模式适用于 MT5,无需重绘,无延迟。 .............................................................................. - “PINBAR 模式”指标是一款非常强大的价格行为交易指标。 - 指标可检测图表上的 PinBar: - 看涨 PinBar - 图表上显示蓝色箭头信号(见图)。 - 看跌 PinBar - 图表上显示红色箭头信号(见图)。 -   支持电脑和移动设备提醒 。 - “PINBAR 模式”指标非常适合与支撑/阻力位结合使用。 .................................................... 点击这里查看高质量的交易机器人和指标! 本产品为独家产品,仅在本 MQL5 网站上提供。
可以说,这是您可以为MetaTrader平台找到的最完整的谐波价格形成自动识别指标。它检测19种不同的模式,像您一样认真对待斐波那契投影,显示潜在的反转区域(PRZ),并找到合适的止损和获利水平。 [ 安装指南 | 更新指南 | 故障排除 | 常见问题 | 所有产品 ] 它检测19种不同的谐波价格形态 它绘制了主要,衍生和互补的斐波那契投影(PRZ) 它评估过去的价格走势并显示每个过去的形态 该指标分析其自身的质量和性能 它显示合适的止损和获利水平 它使用突破来表明合适的交易 它在图表上绘制所有样式比率 它实现了电子邮件/声音/视觉警报 受斯科特·M·卡尼(Scott M. Carney)的书的启发,该指标旨在满足最纯粹和最熟练的交易者的需求。但是,它采取了一种使交易更容易的方式:在向交易发出信号之前,它会等待Donchian朝正确方向突破,从而使交易信号非常可靠。 斐波那契投影与向量无关 它实现了电子邮件/声音/推送警报 它绘制了ABCD投影 重要提示: 为了符合 Scott M. Carney先生 的商标申诉,某些图案名称已重命名为不言自明的替代方式, Scott M.
RamLalla Magic Trend Indicator Overview RamLalla Magic Trend  is a sophisticated trend-following indicator that combines the power of CCI (Commodity Channel Index) and ATR (Average True Range) to create dynamic trend lines with visual cloud formations. This indicator provides clear trend direction signals through color-coded lines and fills, making it easier for traders to identify market momentum shifts. This stands out from the standard Super Trend Indicator. Key Features The indicator uses a
My products:   https://www.mql5.com/ru/users/astra077/seller In the product line: Candlestick Pattern Detector   — a free basic version. Candlestick Patterns Standard   — a paid single-chart version with extended patterns and filters:  https://www.mql5.com/ru/market/product/174530 Japanese Candlestick Patterns Pro MT5   — a professional single-chart version with a summary table:  https://www.mql5.com/ru/market/product/173411 Multi-Currency Candlestick Pattern Scanner   — the ultimate version: a
SMC Venom 模型 BPR 指標是針對在智慧貨幣 (SMC) 概念內工作的交易者的專業工具。它會自動辨識價格圖表上的兩種關鍵模式: FVG (公平價值缺口)是三根蠟燭的組合,其中第一根和第三根蠟燭之間存在缺口。它在水平之間形成一個沒有成交量支撐的區域,這通常會導致價格調整。 BPR (平衡價格區間)是兩種 FVG 模式的組合,形成一個「橋樑」 - 當價格以低成交量活動移動時,突破並返回到水平的區域,從而在蠟燭之間產生間隙。 這些模式可協助交易者透過分析圖表上的交易量和價格動態(大型市場參與者和普通參與者之間的互動)來識別關鍵的支撐/阻力位、突破區域和切入點。 此指標以矩形和箭頭的形式可視化模式,也支援靈活的警報設定。 主要特點: 模式顯示模式:選擇顯示 BPR 模式(看漲和看跌)或 FVG 模式(看漲和看跌)。 可以隱藏所有圖表分析模式。 以條數過濾:BPR 結構中 FVG 之間的最小/最大距離。 訊號的附加視覺化: 箭頭有 9 種類型可供選擇(標準、細、分形等)或手動輸入 Wingdings 代碼,其表格可以選擇性地顯示在圖表上。 設定顏色、尺寸及其縮放時相對於價格的動態
Inverted_Chart_EA Utility Expert Advisor Inverted_Chart_EA creates and maintains a mirror-inverted chart of any symbol and timeframe. It automatically generates a custom instrument (e.g. US30_INV ) and keeps its price history updated in real time, with bars mirrored around a chosen pivot. This utility gives traders a new way to analyze the market from a different perspective by flipping the chart upside down. Why use an inverted chart? Highlight hidden patterns – price formations that look ordin
Trend Line Map Pro MT5
STE S.S.COMPANY
4.09 (11)
趋势线图指标是趋势筛选器指标的插件。它用作趋势筛选器(趋势线信号)生成的所有信号的扫描仪。 它是基于趋势筛选器指标的趋势线扫描仪。如果您没有 Trend Screener Pro Indicator,Trend Line Map Pro 将无法使用。 It's a Trend Line Scanner based on Trend Screener Indicator. If you don't have Trend Screener Pro Indicator,     the Trend Line Map Pro will not work . 通过访问我们的 MQL5 博客,您可以下载趋势线图指标的免费版本。购买前试用,不受 Metatrader Tester 限制。 :  点击这里 1. 容易获得的优势 根据货币和时间范围显示买入和卖出信号。 评估自图表中出现箭头以来价格上涨或下跌的点数。 (趋势筛选指标箭头) 显示信号的时序。 获取多时间范围和多货币警报以购买和出售警报。 2. 如何使用趋势线图 如何显示买卖信号仪表板? 如果您有任何问题或需要帮助,请通过私
Unlock the Market's Hidden Blueprint with Advanced Pattern Recognizer Tired of staring at charts, struggling to spot high-probability trading opportunities? What if you had a professional analyst scanning the markets 24/7, drawing perfect trendlines, and calculating precise profit targets for you? Introducing Advanced Pattern Recognizer for MetaTrader 5 – Your Automated Technical Analysis Powerhouse. This isn't just another indicator. It's a sophisticated algorithmic engine designed to do the he
SMC Smart Flow Pro
Thitipong Nookhunthod
Short Description: SMC Smart Flow Pro is an advanced Smart Money Concept indicator that automatically detects Break of Structure (BOS), Change of Character (CHoCH), and projects precise TP/SL target levels on all timeframes — built for serious traders who trade with institutional flow. Full Description: SMC Smart Flow Pro is a premium Smart Money Concept (SMC) indicator for MetaTrader 5, engineered for traders who want to trade alongside institutional order flow. By automatically mapping m
PZ Support Resistance MT5
PZ TRADING SLU
3.71 (7)
厌倦了绘制支撑线和阻力线? 支撑阻力 是一个多时间指标,可以自动检测并绘制图表中的支撑线和阻力线,并具有非常有趣的变化:随着时间的推移测试价格水平及其重要性的提高,线变得越来越粗。 [ 安装指南 | 更新指南 | 故障排除 | 常见问题 | 所有产品 ] 一夜之间增强您的技术分析 无需浏览图表即可检测重要的价格水平 一目了然地识别所有价格水平的相对优势 每次交易最多可节省半小时的绘图线 指标显示所有价格水平的期限 指示器不重涂 过去和现在的价格水平因接近程度而崩溃,并根据当前的市场行为进行了调整。在动作发生的地方绘制了线条,而不一定在峰值处绘制了线条。 价格水平随着时间的推移而被拒绝,变得越来越暗 定期清除不重要的价格水平以避免噪音 可自定义的时间范围选择和崩溃因子 它实现了电子邮件/声音/推送警报的突破 输入参数 指标设置:指标将从当前时间段读取价格,但您可以选择另一个。例如,您可以在H4图表中显示D1支撑线和阻力线。您还可以使用 价格水平密度 参数选择在图表上显示多少价格水平。 颜色设置:根据重要性输入所需的支撑线和阻力线颜色。 标签设置:(可选)可以在指示器中显示用于
Has rsi signal
Evgenii Savinov
HAS RSI Signal — 带有止损/止盈计算的专业趋势指标 HAS RSI Signal 是一款强大的交易工具,结合了经典指标与现代噪声过滤算法。该指标通过 Heiken Ashi Smoothed (HAS) 平滑蜡烛图和 RSI 震荡指标进行市场分析,在趋势反转或价格退出超买/超卖区域时,为交易者提供清晰的人场信号。 主要优势: 双重过滤: 使用 Heiken Ashi Smoothed 算法消除市场“噪音”,同时通过 RSI 确认动能强度。 自动计算点位: 指标不仅提供信号,还会根据当前市场波动率 (ATR) 自动计算 止损 (Stop Loss) 和 止盈 (Take Profit) 点位。 视觉直观: 信号以彩色蜡烛图的形式直接显示在主图表上,保持交易界面的整洁有序。 多维度通知: 内置终端弹窗警报、声音提示以及手机推送通知 (Push),确保您不会错过任何交易机会。 核心原理: 指标持续监控 RSI 的极端区域。当价格离开临界区且 HAS 算法确认方向转变时,即生成交易信号。ATR 参数允许止损和止盈根据市场当前的波动性进行动态调整。 核心参数设置: InpPeri
Noize Absorption Index
Ekaterina Saltykova
Noize Absorption Index - is the manual trading system that measures the difference of pressure between bears forces and bulls forces. Green line - is a noize free index that showing curent situation. Zero value of index shows totally choppy/flat market.Values above zero level shows how powerfull bullish wave is and values below zero measures bearish forces.Up arrow appears on bearish market when it's ready to reverse, dn arrow appears on weak bullish market, as a result of reverse expectation.
This trading indicator is non-repainting, non-redrawing, and non-lagging, making it an ideal choice for both manual and automated trading. It is a Price Action–based system that leverages price strength and momentum to give traders a real edge in the market. With advanced filtering techniques to eliminate noise and false signals, it enhances trading accuracy and potential. By combining multiple layers of sophisticated algorithms, the indicator scans the chart in real-time and translates comple
FFx Patterns Alerter gives trade suggestions with Entry, Target 1, Target 2 and StopLoss .... for any of the selected patterns (PinBar, Engulfing, InsideBar, OutsideBar) Below are the different options available: Multiple instances can be applied on the same chart to monitor different patterns Entry suggestion - pips to be added over the break for the entry 3 different options to calculate the SL - by pips, by ATR multiplier or at the pattern High/Low 3 different options to calculate the 2 TPs -
Entry In The Zone and SMC Multi Timeframe is a real-time 2-in-1 market analysis tool that combines market structure analysis and a No Repaint BUY / SELL signal system into a single indicator, built on Smart Money Concepts (SMC) — a widely adopted framework used by professional traders to understand market structure. This indicator helps you see the market more clearly, make decisions based on structure rather than guesswork, and focus on high-probability zones where price is more likely to react
Utraspikedetector
Odete Argelio Simbine
UltraSpikeDETECTOR for MQL5 is a professional market indicator designed to detect sudden price spikes and market trends efficiently. It provides real-time alerts, clear visual signals, and full integration with the MQL5 platform. Fully customizable and adaptable to various trading strategies, it helps traders monitor market movements more effectively. This tool is intended to support informed decision-making and improve trading analysis. No profit guarantees are provided, ensuring compliance wit
ATrend
Zaha Feiz
4.83 (18)
ATREND: 工作原理及使用方法 工作原理 “ATREND”指标针对MT5平台设计,旨在通过结合多种技术分析方法为交易者提供强有力的买卖信号。该指标主要利用平均真实波幅(ATR)来测量波动性,并结合趋势检测算法来识别潜在的市场动向。 购买后请留言,您将获得特别的赠品。 主要特点: - 动态趋势检测:该指标评估市场趋势并相应调整信号,帮助交易者与当前市场条件对齐策略。 - 波动性测量:通过使用ATR,该指标衡量市场波动性,这对于确定最佳止损(SL)和止盈(TP)水平至关重要。 - 信号可视化:该指标在图表上直观地表示买卖信号,增强交易者的决策能力。 操作步骤 输入和设置: - 时间框架:此输入允许您设置指标计算的主要时间框架,默认值为15分钟。 - 时间框架2:此输入可用于定义额外分析的辅助时间框架,默认值为1分钟。 - 移动:此参数允许您将指标的计算向回移动,默认值为0。 - SLATR:此输入定义用于根据ATR计算止损水平的乘数,默认值为2.56。 - TPATR:此输入定义用于根据ATR计算止盈水平的乘数,默认值也为2.56。 - AlertsOn:启用或禁用交易信号的警报,
Overview The Market Perspective Structure Indicator is a comprehensive MetaTrader indicator designed to provide traders with a detailed analysis of market structure across multiple timeframes. It identifies and visualizes key price action elements, including swing highs and lows, Break of Structure (BOS), Change of Character (CHOCH), internal structures, equal highs/lows, premium/discount levels, previous levels from higher timeframes, and trading session zones. With extensive customization opt
Maximum Trend Arrows OT MT5
Mulweli Valdaz Makulana
STRICTLY FOR BOOM INDEX ONLY!!!!! Here I bring the Maximum Trend Arrows OT1.0 MT5 indicator. This indicator is made up of a combination of different trend indicators for entries and exits, for entries an orange arrow will paint on the chart below the current market and a red flag for closing of trades and it produces buy arrows only. When the orange arrow appears, it will appear along with it's sound to notify you. The 1H timeframe is recommended, don't use it anywhere else than on the 1H timefr
SMC 反转指标 Plus Alert SMC 反转指标 Plus Alert 是一款强大的智能资金(Smart Money Concepts, SMC)交易工具,旨在帮助交易者识别高概率的反转区域,并利用机构逻辑提供精确的入场信号。 该指标会自动绘制 H4 和 D1 的供需区域,从当前交易日开始,使交易者清楚地看到价格可能反应的区域。这些区域基于已确认的高点和低点(swing highs 和 swing lows),提供可靠的关注区域且不会重绘。 系统核心是其先进的蜡烛影线拒绝检测功能(wick rejection)。指标扫描当日的价格行为,并识别日内高点或低点的强烈拒绝蜡烛。当发生这种拒绝时,立即在主图表上显示买入或卖出箭头,使交易者可以实时捕捉交易机会。 为了确保不会错过任何交易机会,指标内置完整的 提醒系统 ,包括弹出提醒、声音通知、移动推送以及可选的电子邮件提醒。 它还会可视化标记当前和前一交易日的开始,帮助交易者保持与日内市场结构同步。 主要特点 自动绘制 H4 和 D1 供需区域 区域从当前日向前延展,清晰可见 智能蜡烛影线拒绝检测,用于看涨和看跌设置 主图箭头,清晰显示
该产品的买家也购买
Neuro Poseidon MT5
Daria Rezueva
4.95 (19)
Neuro Poseidon is a new indicator by Daria Rezueva. It combines precise trading signals with adaptive TP/SL levels - creating best possible trades as a result! Message me and get  Neuro Poseidon Assistant  as a gift to automize your trading process! What makes it stand out? 1. Proven profitability on all assets and timeframes 2. Only confirmed BUY and SELL signals present on the chart 3. Adaptive TP & SL levels generated by the software for each trade 4. Easy to understand - suitable for al
PrimeScalping
Temirlan Kdyrkhan
PrimeScalping is a powerful trading companion designed to generate high-probability entry signals with dynamic TP/SL/DP levels based on volatility. Built-in performance tracking shows win/loss stats, PP1/PP2 hits, and success rates — all updated live. Key Features: Buy/Sell signals with adaptive volatility bands Real-time TP/SL/DP levels based on ATR Built-in MA Filter with optional ATR/StdDev volatility Performance stats panel (Success, Profit/Loss, PP1/PP2) Alerts via popup, sound, push, or e
SignalTech MT5
Yue Wang
5 (26)
SignalTech MT5 is an unique fully rule based trading system for EURUSD, USDCHF, USDJPY, AUDUSD, NZDUSD, EURJPY, AUDJPY, NZDJPY, CADJPY.  All the winning trades with chart setups are published on the comments page. 2026-05 4107 Pips (Until 05-29 NY Closed) 2026-04 2243 Pips 2026-03 2165 Pips 2026-02 2937 Pips 2026-01 2624 Pips 2025-12 1174 Pips It can generate signals with Buy/Sell Arrows and Pop-Up/Sound Alerts. Each signal has clear Entry and Stop Loss levels, which should be automatically flag
Azimuth Pro
Ottaviano De Cicco
5 (7)
Azimuth Pro V2:MT5合成分形结构分析与确认入场 概述 Azimuth Pro 是 Merkava Labs 推出的多层级波段结构指标。四层嵌套波段层级、锚定波段的VWAP、ABC形态识别、三时间框架结构过滤以及收盘确认入场——一个图表,一个从微观波段到宏观周期的完整工作流程。 这不是盲目的信号产品。它是一个以结构为先的工作流程,专为重视位置、背景和时机的交易者打造。 V2上市优惠 — Azimuth Pro V2售价USD 399(接下来的100份)。最终价格:USD 499。 1. V2的变化 合成多时间框架引擎 高时间框架分析从零开始重建,采用与Meridian Pro相同的专有合成架构。更清晰的HTF背景、稳定的实时行为、无经典MTF同步问题。合成引擎还解锁了 固定比率时间框架级联 (x2、x3、x4、x6)——不再在经纪商的固定时间框架之间任意跳转,您可以按图表时间框架的固定倍数分析结构,在每个尺度上保持相同的分形关系。 确认入场箭头 作为稳定且可恢复的执行层而设计的收盘确认箭头。当ABC设置形成且自适应确认逻辑在收盘K线上验证方向时,箭头会写入下一根K线的
本产品已针对 2026 年市场进行更新,并针对最新 MT5 版本进行了优化。 价格更新通知: Smart Price Action Concepts 目前价格为 $200 。 接下来的 30 次购买 后,价格将上涨至 $299 。 特别优惠: 购买后,请发送私信给我,即可领取 免费赠品 + 礼物 。 首先需要强调的是,这款交易工具是不重绘、不回绘、不延迟的指标,因此非常适合专业交易使用。 Online course , and manual Smart Price Action Concepts 指标是一款非常强大的工具,适合新手和有经验的交易者使用。它将 20 多个实用指标整合到一个系统中,结合了 Inner Circle Trader Analysis 和 Smart Money Concepts Trading Strategies 等高级交易理念。该指标专注于 Smart Money Concepts,帮助交易者理解大型机构如何交易,并辅助预测其市场行为。 它特别擅长流动性分析,使交易者更容易理解机构交易逻辑。它也非常适合预测市场趋势并仔细分析价格走势。通过让交易与机构策略保
RelicusRoad Pro MT5
Relicus LLC
4.96 (24)
RelicusRoad Pro: 量化市场操作系统 终身访问限时 70% 折扣 - 加入 2,000+ 交易员社区 为什么大多数交易者即使拥有“完美”指标也会失败? 因为他们在真空中交易 单一概念 。没有背景的信号是赌博。要持续获胜,您需要 共振 (CONFLUENCE) 。 RelicusRoad Pro 不是一个简单的箭头指标。它是一个完整的 量化市场生态系统 。它描绘价格运行的“公允价值之路”,区分市场噪音和真实的结构性突破。 停止猜测。开始用机构级“路”逻辑进行交易。 核心引擎:“Road” (路) 算法 系统的核心是 Road Algo ,一个实时适应市场条件的动态波动率通道。它投射出 安全线 (平衡) 和价格可能反转的 扩展水平 。 Simple Road: 典型市场的标准结构映射。 Smooth Road: 针对震荡盘整的降噪计算。 Breakout Road: 专为识别波动率扩张和爆发性走势而调整。 1. 算法动量与确认 我们的“剥头皮箭头”不只是简单的交叉。它们利用 高阶多项式逻辑 过滤噪音,确保信号与主周期一致。我们检测动量、价格行为和 Road 结构汇聚的精确入场
ARIPoint
Temirlan Kdyrkhan
1 (1)
ARIPoint is a powerful trading companion designed to generate high-probability entry signals with dynamic TP/SL/DP levels based on volatility. Built-in performance tracking shows win/loss stats, PP1/PP2 hits, and success rates all updated live. Key Features: Buy/Sell signals with adaptive volatility bands Real-time TP/SL/DP levels based on ATR Built-in MA Filter with optional ATR/StdDev volatility Performance stats panel (Success, Profit/Loss, PP1/PP2) Alerts via popup, sound, push, or email Cu
MetaForecast M5
Vahidreza Heidar Gholami
5 (3)
MetaForecast能够根据价格数据中的谐波来预测和可视化任何市场的未来走势。虽然市场不总是可预测的,但如果价格中存在模式,MetaForecast可以尽可能准确地预测未来。与其他类似产品相比,MetaForecast通过分析市场趋势可以生成更精确的结果。 输入参数 Past size (过去的尺寸) 指定MetaForecast用于创建生成未来预测模型的柱数量。该模型以一条黄色线绘制在所选柱上。 Future size (未来的尺寸) 指定应预测的未来柱数量。预测的未来以粉色线表示,并在其上绘制了蓝色回归线。 Degree (程度) 此输入确定了MetaForecast将在市场上进行的分析级别。 Degree 描述  0 对于程度0,建议使用较大的值来设置“过去的尺寸”输入,以覆盖价格中的所有高峰、低谷和细节。  1 (建议的) 对于程度1,MetaForecast可以理解趋势,并通过较小的“过去的尺寸”生成更好的结果。  2 对于程度2,除了趋势,MetaForecast还可以识别反转点。对于大于1的程度,必须使用较高的“细节”和“噪音减少”输入值。  大于2 不建议使用大于
KT Alpha Hunter Arrows MT5
KEENBASE SOFTWARE SOLUTIONS
大多数箭头指标只给你一个信号,然后让你自己去判断剩下的一切。KT Alpha Hunter Arrows 为你提供完整的交易计划。 每一个信号箭头出现时,都会同时绘制一套完整计划:入场线、止损位、四个止盈目标,以及实时优势判断,告诉你当前这个交易品种和时间周期是否值得交易。随附的 Trade Manager EA 会在你手动入场后负责后续执行,让你在市场波动剧烈、情绪干扰明显时也能保持交易纪律。不重绘。仅在K线收盘后确认信号。适用于 Forex、黄金、指数以及任何你在 MT5 上交易的品种。 核心功能 不重绘买入和卖出箭头,只在K线收盘后生成。 每个信号都会显示入场线、结构性止损位和四个止盈目标。 Edge Dashboard 会分别评估当前图表上的买入和卖出机会。 判断系统包括:No Edge、Marginal、Tradeable、Good 或 Strong。 一键 Auto Optimize 按钮可根据当前品种和时间周期自动优化设置。 完整套装包含 Trade Manager EA,并提供五种专为本指标设计的预设交易管理方案。 Prop Firm Risk Panel 可在图表上
UZFX {SSS} 短线智能信号 MT5 是一款无重绘的高性能交易指标,专为在快速波动的市场中需要精准、实时信号的短线交易者、日内交易者和波段交易者设计。该指标由 (UZFX-LABS) 开发,融合了价格行为分析、趋势确认和智能过滤技术,可在所有货币对和时间周期内生成高概率的买入和卖出信号。 我推荐*的最佳时间周期:15分钟及以上。 {1小时}是我的首选。效果令人惊叹……! 注意:与{ LTL 164343 }指标结合使用,可提高获胜信号率。 使用 LTL 信号判断趋势,利用 SSS 信号确定入场时机。 这种方法将最大化您的胜率,并有效规避虚假信号。 核心功能 智能信号检测——精准识别强劲的趋势反转与延续形态。 多周期短线交易——在所有时间周期内运行流畅。 可自定义提醒——针对每个信号接收弹出窗口、电子邮件及手机通知(可配置)。 清晰可视箭头——图表上醒目的蓝色(买入)和红色(卖出)箭头。 自适应信号强度——可调节信号强度,适用于短期、中期或长期交易。 用户友好界面——简洁的图表显示,无重绘或信号延迟。 工作原理 UZFX SSS指标通过扫描价格走势来检测: 看涨反转——价格
MetaTrader 5 智能多层突破与回调探测器 "智能 · 简单 · 快速!" 您是否厌倦了错过高概率的突破入场机会? 您是否花费数小时扫描多张图表,试图将突破与趋势方向和货币动能对齐——却仍然错过了行情? Break Pullback 用一个指标解决所有这些问题。 什么是 Break Pullback? Break Pullback 是一款专业级 MetaTrader 5 指标,专为交易市场结构、突破和趋势延续形态的交易者而设计。 它能实时自动检测多个货币对的突破与回调形态——并通过三层确认过滤每个信号: 结构突破检测——识别图表上的关键突破位 高时间框架日线偏向——将入场与主导日线趋势方向对齐 货币强弱指数——确认配对货币间的动能失衡 结果:更少的虚假信号,更强的信心,更快的执行——无需面对图表过载。 适合哪些交易者? Break Pullback 专为使用以下方法的交易者设计: 突破与回测策略 市场结构分析(BOS、 OB Order Block 、结构位) 聪明钱概念(SMC)或 ICT 风格入场 趋势跟踪与延续形态 跨外汇和黄金(XAUUSD)的多对扫描 日内和波段
ARICoins
Temirlan Kdyrkhan
ARICoin is a powerful trading companion designed to generate high-probability entry signals with dynamic TP/SL/DP levels based on volatility. Built-in performance tracking shows win/loss stats, PP1/PP2 hits, and success rates all updated live. Key Features: Buy/Sell signals with adaptive volatility bands Real-time TP/SL/DP levels based on ATR Built-in MA Filter with optional ATR/StdDev volatility Performance stats panel (Success, Profit/Loss, PP1/PP2) Alerts via popup, sound, push, or email Cust
OmniSync Projection
Antonio-alin Teculescu
5 (1)
Chronos Fractal Engine is an innovative price projection indicator for MetaTrader 5, designed to transform your technical analysis by intelligently identifying and projecting historical price patterns. Built upon an advanced correlation algorithm and the fractal principles of the market, this powerful tool visualizes potential future price movements, giving you a unique edge in your trading decisions. What is Chronos Fractal Engine? At its core, the Chronos Fractal Engine employs a sophisticat
Ziva LSE System
Hassan Abdullah Hassan Al Balushi
ZIVA LSE System A Professional Liquidity & Structure Execution Framework Executive Overview ZIVA LSE System is a professionally engineered analytical framework designed to interpret market behavior through structural logic and liquidity dynamics. It is not positioned as a conventional indicator. Rather, it functions as a structured execution environment that organizes price action into a clear, disciplined decision-making model. The system is built to deliver consistency, clarity, and controlled
AriX
Temirlan Kdyrkhan
1 (4)
AriX Indicator for MT5 A powerful trend-following and signal-evaluation tool AriX is a custom MT5 indicator that combines Moving Averages and ATR-based risk/reward logic to generate clear buy/sell signals. It visualizes dynamic SL/TP levels, evaluates past trade outcomes, and displays win/loss statistics in a clean on-chart panel. Key features include: Buy/Sell signals based on MA crossovers ATR-based SL/TP1/TP2/TP3 levels with visual lines and labels Signal outcome tracking with real-time stat
Gem SIGNAL
Shengzu Zhong
5 (1)
GEM Signal Pro GEM Signal Pro 是一款適用於 MetaTrader 5 的趨勢跟隨指標,專為希望在圖表上獲得更清晰訊號、更有結構的交易設定,以及更實用風險管理的交易者而設計。 它不僅僅顯示一個簡單的箭頭,GEM Signal Pro 還能以更清晰、更易讀的方式呈現完整的交易思路。當條件確認完成後,指標可在圖表上顯示進場價、止損價與止盈目標,幫助交易者更有效率地評估交易設定。 運作方式 該指標首先根據其內部邏輯識別有效的初始訊號。 當確認條件滿足後,GEM Signal Pro 會在圖表上顯示完整的交易設定。這讓交易者可以更清楚地看到交易結構,並減少手動分析與計算的工作量。 圖表上的交易價位 對於已確認的訊號,GEM Signal Pro 可顯示: 進場價 止損價 止盈 1 止盈 2 止盈 3 風險報酬比 這讓交易設定更容易理解,也有助於讓圖表分析更有條理。 內建風險管理 風險管理是此指標設計的重要部分。 止損位基於近期市場結構,結合附近的擺動高低點與可選的 ATR 緩衝距離。這能讓交易價位更貼近當前市場條件,而不只是依賴固定距離。 圖表資訊面板 GEM Si
Presenting one-of-a-kind Gann Indicator for XAUUSD IQ Gold Gann Levels is a non-repainting, precision tool designed exclusively for XAUUSD/Gold intraday trading. It uses W.D. Gann’s square root method to plot real-time support and resistance levels, helping traders spot high-probability entries with confidence and clarity. William Delbert Gann (W.D. Gann) was an exceptional market analyst whose trading technique was based on a complex blend of mathematics, geometry, astrology, and ancient calcul
The Zain GOLD indicator
Haitham Gamal Abdelnaser Mohamed
Specializing in (All brokers supported): Professional Trading Tools Want the same tools used by professional traders? Get them now and start dominating the markets! Join our premium communities for free: Specializing in (All brokers supported): Gold (XAUUSD) - Unmatched accuracy Forex Pairs - Comprehensive global market coverage Binary Options - Highly accurate signals ️ Synthetic Derivatives - Trade pairs using Drive Cryptocurrencies - Professional cryptocurrency trad
CGE Trading Suite
Carl Gustav Johan Ekstrom
5 (2)
Institutional-Grade Analytics for MT5 C GE Trading Suite delivers the analytical edge typically reserved for professional trading desks. The platform integrates a full suite of analytical tools into one seamless workflow: dynamic grid mapping, liquidity behavior analysis, ECM, trend lines, MIDAS, trade cycles, and directional channel projections. Together, these provide a unified view of market structure and momentum. Directional clarity is further enhanced by the capital flow index, which meas
The Zone Trading Indicator is a technical analysis tool for MetaTrader 5 that automatically identifies and displays tradable price zones across multiple timeframes to assist with structured market analysis. The indicator plots Monthly, Weekly, Daily, and H4 tradable zones , allowing traders to view higher- and lower-timeframe price areas simultaneously. These zones are designed to support one-candle–based entry approaches by highlighting predefined areas where price interaction may be monitored.
Euro Escalper
Cristofher Robles
Euro Escalper— Zhuan Ye Ji Gou Ji Tou Pi Zhi Biao Euro Escalper shi yi kuan gao xing neng jiao yi zhi biao, zhuan wei xu yao ji gou ji jing zhun ru chang de jiao yi zhe she ji. Shi yong yu he cheng zhi shu (Deriv), wai hui ji MetaTrader 5 shang de ren he zi chan. Jie he le ji yu Fibonacci de liu dong xing qu yu, nei zhi SuperTrend yin qing he shi shi zhuan ye kong zhi mian ban. Zhu Yao You Shi Wu Chong Hui: Xin hao jian tou jin zai K xian shou pan shi chu xian, yong yuan bu hui yi dong huo xiao
The Propfolio Master Suite is the ultimate all-in-one analytical workstation for professional traders. Combining the power of the Beat The Market Maker (BTMM) methodology, Smart Money Concepts (SND/Liquidity), and Advanced Volume Profile, this suite replaces multiple different indicators with one optimized engine. Monitor up to 14 pairs simultaneously from a single chart, instantly identify market cycles, and seamlessly map institutional footprints with the click of a button. The Command Center
MightyPips Sentiment Pro is a market sentiment indicator for MetaTrader 5 designed to help traders analyze buying and selling pressure in the market. The indicator evaluates market behavior to provide a clearer view of trend direction, momentum strength, and overall sentiment conditions. It helps traders understand whether buyers or sellers are currently dominating the market. Features Buyer vs Seller Analysis Displays the balance between buying and selling pressure using real-time market data.
AX Forex Indicator MT5
MQL TOOLS SL
5 (1)
The AX Forex Indicator MT5 is a sophisticated trading tool designed to provide traders with a comprehensive analysis of multiple currency pairs. This   powerful indicator   simplifies the complex nature of the forex market, making it accessible for both novice and experienced traders. AX Forex Indicator uses   advanced algorithms   to detect trends, patterns and is an essential tool for traders aiming to enhance their forex trading performance. With its robust features, ease of use, and reliabl
QuasarEdge
Yuki Miyake
1 (1)
[Special Limited Price] Release Commemoration Sale! Currently available at a special price to celebrate its release. The price will revert to normal without notice after a certain period or sales volume. Don't miss this chance to get a pro-level trading environment at the lowest price! Quasar Edge & Dual Dashboard ~ Transform the "chaos" of 28 pairs into "confident profits" with the ultimate MT5 market structure system ~ The reason many traders lose isn't due to indicator performance, but
==================================================================== SMC Pro v6.1 APEX AI — XAUUSD Gold Empire MetaTrader 5 Indicator · Smart Money Concepts · Predictive Intelligence Engine ==================================================================== SMC Pro v6.1 APEX AI is a professional Smart Money Concepts indicator system built exclusively for XAUUSD (Gold) on MetaTrader 5. It combines the complete SMC framework — Order Blocks, Liquidity sweeps, Fair Value Gaps, Break of Structure,
Big Player Range
Thalles Nascimento De Carvalho
5 (3)
BigPlayerRange — 适用于沪深300和美元人民币的最佳MT5指标 探索 BigPlayerRange 的强大功能,它被认为是用于 沪深300、上证指数、USD/CNH 等资产的 MetaTrader 5 最佳指标 。该工具能精准识别机构主力的关键区域,帮助交易者进行高精度的技术分析。 指标工作原理: BigPlayerRange 绘制两个水平区域,通过成交量分析反映市场能量: 绿色区域 :买方防守位置,支撑价格。 红色区域 :卖方压制位置,形成阻力。 使用策略: 收盘价突破绿色区域上方 :可能开启上涨趋势,目标为上方区间。 收盘价跌破红色区域下方 :暗示下跌压力增强,目标为下方支撑。 价格停留在区间内 :行情震荡,等待突破信号。 核心优势: 机构活动区域识别 :提前发现主力进出场信号。 自动计算的目标价格 :提供两个明确的止盈位置。 回调概率分析 :优化风险控制,提升稳定性。 参数个性化设置: 自定义交易时间与成交量类型(Tick或真实成交量)。 使用机构逻辑提升日内交易效率。 推荐搭配
Gold Xausd Hunter
Metin Erkamoglu
5 (1)
MATADOR GOLD XAUUSD M5 Scalp Signals for MT5 MATADOR GOLD is a decision-support indicator for MetaTrader 5, designed for traders who analyze short-term Gold movement on the M5 timeframe. The indicator does not open, close, or manage trades automatically. It provides buy and sell signal guidance so the user can make their own trading decisions according to their risk plan, broker conditions, and trade management rules. Main purpose MATADOR GOLD is built to help traders avoid noisy signal flow and
“ Dynamic Scalper System MT5 ”指标专为在趋势波内进行剥头皮交易而设计。 已在主要货币对和黄金上进行测试,并可与其他交易工具兼容。 提供顺势短线建仓信号,并提供额外的价格变动支持。 指标原理: 大箭头决定趋势方向。 在趋势波内,我们采用一种生成小箭头形式的剥头皮交易信号的算法。 红色箭头代表看涨方向,蓝色箭头代表看跌方向。 敏感的价格变动线会沿着趋势方向绘制,并与小箭头信号协同作用。 信号运作方式如下:当线在适当时刻出现时,将形成入场信号;在出现线时,持仓;线完成后,平仓。 建议的操作时间范围为M1 - H4。 箭头在当前K线上方形成,如果下一根K线已开仓,则不会重新绘制上一根K线上方的箭头。 输入参数 Trend Wave Period - 趋势方向(大箭头)的周期,改变趋势波的时间间隔。值 1 表示趋势方向的最长持续时间,参数值越大,持续时间越短。 Scalper Arrows Period - 信号箭头(小箭头)的计算周期,改变入场信号的生成频率。值 3 表示最频繁的生成频率,参数值越大,箭头频率越低,准确度越高。 这些参数可以根据不同
Assembler
Darko Licardo
5 (1)
Introducing Assembler:  The best value for money,  Designed for advanced traders and professionals, yet accessible for ambitious beginners ready to elevate their trading game. Great for ICT, SMC, TREND and breakout traders . Combining advanced analytics, a sleek graphical interface, and highly customizable features, Assembler empowers you to trade with precision, clarity, and confidence. Key Features of Assembler 1. Dynamic Graphical User Interface (GUI): A fully draggable, customizable interf
作者的更多信息
Moving Average Cloud
Muhammad Elbermawi
4.92 (13)
或“MAC”。 这是一个旨在帮助您捕捉和交易趋势的指标。这个指标背后的想法可以在接下来的步骤中解释: 画一个快速移动的平均信封。 画一个缓慢移动的平均信封。 MAC Upper Band 是两个包络的高值之间的最高值。 MAC 下频带是两个包络的低值之间的最低值。 MAC 直方图云填充两个波段之间的距离,以显示方向的变化。 蓝云表示上升趋势,而红云表示下降趋势。 阅读下一篇博客,了解如何使用 MAC 缓冲区构建您自己的 EA 或扫描仪: https://www.mql5.com/en/blogs/post/734293 如何使用 MAC 使用 MAC 云作为过滤器来帮助您识别趋势方向。 使用您常用的交易工具在 MAC Clouds 的方向上进行交易,只是为了尽可能地消除错误信号。 使用建议的进入箭头可帮助您找到强大的趋势点作为起点。 MAC 功能 MAC 不会重新绘制或重新计算其结果。 它适用于加密货币、股票、指数、石油、黄金和所有时间范围。 声音、电子邮件警报和移动通知。 买入、卖出箭头有助于识别趋势信号。 精心设计的参数可帮助用户轻松地在它们之间导航。 建立自己的专家顾
Bermaui Deviation Percent
Muhammad Elbermawi
4.94 (111)
或者 ( BD% ) 这是一个波动率指数,以百分比而不是点来衡量波动率。 BD% 的想法是根据在 0% 和 100% 之间移动的经典标准偏差 (CSD) 创建一个索引。 您可以使用 BD% 来比较同一证券在不同时间段或不同时间范围内的波动率。此外,您可以使用 BD% 以百分比而非点数来比较不同市场中不同证券之间的波动率。 如何使用“BD%” 如果 BD% 低于 90%,然后向上越过该水平,则表明价格可能在区间内波动。 如果 BD% 高于 90%,然后向下穿过该水平,并且价格已经高于其简单移动平均线,则这是新的上升趋势开始的迹象。随着 BD% 进一步下行,波动性和趋势强度正在增加。当 BD% 为 0% 时,这意味着波动率处于最高值。 如果 BD% 高于 90%,然后向下穿过该水平,并且价格已经低于其简单移动平均线,则这是新的下降趋势开始的迹象。随着 BD% 进一步下行,波动性和趋势强度正在增加。当 BD% 为 0% 时,这意味着波动率处于最高值。 要了解有关 BD% 的更多信息,请从此处阅读用户手册: https://www.mql5.com/en/blogs/post/718
Bermaui Bands
Muhammad Elbermawi
4.97 (68)
Bermaui Bands (BB) 是一种技术分析工具,有助于在价格波动和趋势价格变动之间进行过滤。这个指标背后的想法可以在接下来的步骤中解释: 将标准偏差计算为一个在 0 到 100 之间移动的振荡器。我将其命名为 Bermaui Deviation 百分比 (BD %)。 如果“BD %”接近于零,则波动率处于极端状态。此外,如果“BD %”接近 100,则波动性非常低。 高波动性意味着趋势市场的可能性很大,而低波动性意味着横向或区间市场。 中线是简单移动平均线 (SMA),因为标准偏差是根据 SMA 计算的。 将“BD %”添加到计算中具有相同条数的简单移动平均线,以获得上伯毛伊乐队。 从计算中具有相同条数的简单移动平均线中减去“BD %”以获得下伯毛伊乐队。 重要信息 Bermaui Bands 用户手册: https://www.mql5.com/en/blogs/post/718688 Bermaui Bands Expert Advisor 示例 : https://www.mql5.com/en/blogs/post/731143 如何使用它 使用 Bermaui
Bermaui Manual EA
Muhammad Elbermawi
5 (10)
这是一个交易网格系统的半自动专家顾问。这个想法是逐渐在市场中占据不同的位置,然后计算它们的盈亏平衡水平。当价格超过此盈亏平衡点达到预定距离时,所有打开的订单都会关闭。 重要信息 这是用户指南:   https://www.mql5.com/en/blogs/post/730567 您可以在此处使用我的任何其他产品尝试此 EA: https://www.mql5.com/en/users/bermaui314/seller 重要功能 EA 具有止损机制,以保护交易资金免受意外结果的影响。 您可以交易任何 MT4 符号,例如 EURUSD - XAUUSD - 石油 - 比特币。 您可以交易任何 MT4 时间范围。 我建议从 VPS 运行 EA。 参数和默认设置 1) 资金管理设置 开始批量。 建议使用默认设置为每 500 美元 0.01,杠杆为 1:400 或更多。 批次指数。 下一个订单的乘法大小。例如,如果起始手数为 0.01,手数指数为 2,则网格的手数大小将如下所示:0.01 – 0.02 – 0.04 – 0.08...等。 以点数获利。 盈亏平衡后的利润距离以点为单
Bermaui RSI Candles
Muhammad Elbermawi
5 (4)
该指标的想法是以蜡烛的形式绘制 RSI,可以与价格图表进行比较以生成买入和卖出信号。该指标不是我的发明。几年前我在互联网上创立了它。我更新了代码,添加了警报功能,添加了 Bermaui Utilities 工具组。 该指标计算用于绘制烛台的所有价格的 RSI(开盘价、最高价、最低价和收盘价的 RSI)。它使用它们中最高的来绘制高灯芯的 RSI 蜡烛,使用它们中最低的来绘制低灯芯的 RSI 蜡烛。 RSI 蜡烛的主体位于高点和低点之间。如果开盘的 RSI 低于收盘的 RSI,则认为 RSI 蜡烛看涨。如果开盘的 RSI 高于收盘的 RSI,则 RSI 蜡烛被视为看跌。 如何使用它 您可以在 RSI 蜡烛指标上交易趋势线突破,这将引领价格图表上的趋势,因为动量引领价格。 您可以在 RSI 蜡烛指标上绘制任何形式的经典图表模式,并像使用原始 RSI 一样进行交易。 它可以用作经典的 RSI。如果它穿过超买 (70%),则卖出,如果它穿过超卖 (30%),则买入。 您可以使用 RSI 蜡烛图和价格图表之间的背离来确认您的交易信号。 RSI 蜡烛特点 它不会重新绘制或重新计算其结果。 它适用于加
True Direction Oscillator
Muhammad Elbermawi
4.85 (364)
或 (TDO),它是一种使用“ 纯动量 ”原理衡量价格变化率的指数。 当证券价格从 10 上涨到 15 时,价格变化率为 150%,但当它从 15 回落到 10 时,价格变化率仅为 33.3%。这就是为什么像“价格变化率”(ROC) 或“动量”这样的技术分析指标给出的上升价格走势读数高于下降价格走势读数的原因。 TDO 解决了这个问题,以帮助交易者正确读取动量。 重要信息 TDO 用户手册: https://www.mql5.com/en/blogs/post/717970 TDO 常见问题: https://www.mql5.com/en/blogs/post/722015 TDO 视频库: https://www.mql5.com/en/blogs/post/722018 TDO Expert Advisor 示例: https://www.mql5.com/en/blogs/post/731141 TDO 特性 TDO 以百分比计算纯动量,因此它用于比较来自不同市场的不同证券。 (例如:将 EURUSD 与 Gold & Dow Jones Industrial 进行比较)
Classic Keltner Channel
Muhammad Elbermawi
4.87 (30)
或者 CKC。 该指标根据 Chester W. Keltner (1909–1998) 描述的经典 10 天移动平均线规则起作用。所有参数默认设置为Keltner系统的经典版本,用户可以根据需要进行更改。 重要信息 阅读 CKC 手册: https://www.mql5.com/en/blogs/post/736577 CKC Expert Advisor 示例: https://www.mql5.com/en/blogs/post/734150 关于 Keltner 通道公式 1. 根据典型价格 (= (最高价 + 最低价 + 收盘价) / 3) 将中心线计算为简单移动平均线。 2. 计算平均日波动幅度(ADR),即最高价和最低价之间的平均差,以相同的时期和计算方法为中线。 3. Keltner Buy Line = 中心线 + ADR。 4. Keltner 卖出线 = 中线 – ADR。 凯尔特纳 10 天移动平均线法则 Keltner 公式导致在图表上创建两条基本线。 1. 凯尔特纳购买线。 这是您覆盖卖出头寸并买入的线。 2. Keltner 销售线。 这是您覆盖
Bermaui Pin Bars
Muhammad Elbermawi
5 (13)
Bermaui 销钉 或者 (BPB) 是一个指标,可以在图表上找到 Pin Bars 价格行为模式。 Pin Bars 是“Pinocchio Bars”的快捷方式,它是日本烛台的经典条形图案替代品. Bermaui Pin Bars 指标根据可以在后续步骤中解释的公式找到此模式: 首先 BPB 计算蜡烛主体的中心 (= [开盘 + 收盘] / 2)。 然后 BPB 找到实体中心和蜡烛低点之间的距离。 最后一步是将第 2 步的结果除以蜡烛图范围。 如果蜡烛主体中心太靠近蜡烛的高点或低点,则 BPB 会检测到 Pin Bar 模式并提醒用户。 Bermaui Pin Bars 公式 : https://www.mql5.com/en/blogs/post/729139 我通过添加以下内容增强了 Bermaui Pin Bars 功能: 多时间框架蜡烛方向面板 告诉您所有时间框架的当前蜡烛情况。其中绿点表示关闭>打开,红色表示关闭<打开,黄色表示关闭=打开。 Bermaui Bands 可帮助您确定当前趋势是看涨、看跌还是中性。 你可以从这里 阅读更多关于它的信息。 Bermaui P
MASR Bands
Muhammad Elbermawi
5 (5)
或 M oving 一个 verage 小号 upport [R esistance 带 。 MASR Bands 指标是一条移动平均线,由两条带共同作为支撑位和阻力位。据统计,MASR 波段 93% 的时间都包含价格蜡烛。以下是分步计算的方法: 1. 第一步是计算 X 时间段内的最高价 (HHV) 和最低价 (LLV)。 2. 第二步是用HHV除以LLV,得到它们之间的距离有多宽的百分比。我称这一步的结果为 MASR Filter。 3. MASR 过滤器 = 总和 ((HHV / LLV)-1) / 柱数 4. 我将上带称为 MAR,这是移动平均阻力的捷径。我将下频带 MAS 称为移动平均线支持的捷径。波段之间的移动平均线称为中心线。 5. MAR = MASR 中心 + (75% x MASR 过滤器 x MASR 中心) 6. MASR 中心是移动平均线。 7. MAS = MASR 中心 - (75% x MASR 过滤器 x MASR 中心) 重要链接 MASR 工具手册: https://www.mql5.com/en/blogs/post/721889
Bermaui Channel
Muhammad Elbermawi
5 (19)
这是一个价格通道,在图表上显示五个重要的价格水平。这些级别是: 1. 前 x 根柱线的最高价 (HH)。 2. 前 x 根柱线的最高低点 (HL)。 3. 中线。 4. 前 x 根柱线的最低最高价 (LH)。 5. 前 x 根柱线的最低价 (LL)。 如何Bermaui通道捕获 超买 区域 将 HH 和 HL 水平之间的距离视为超买区域。 当价格蜡烛或柱线穿过 HL 向上时,这表明价格正在进入其超买区域。 当价格蜡烛或柱线穿过 HL 向下时,这表明价格正在超出其超买区域。 当价格蜡烛穿过 HH 时,它会创造一个新的高点。这可能表明一个新的上升趋势的开始,该趋势将继续进行,直到价格再次反转下跌方向。 Bermaui Channels 如何捕捉 超卖 区域 将 LL 和 LH 之间的距离视为超卖区域。 当价格蜡烛或柱线穿过 LH 向下时,这表明价格正在进入超卖区域。 当价格蜡烛或柱线穿过 LH 向上时,这表明价格正在超出其超卖区域。 当价格蜡烛穿过 LL 时,它会创造一个新的低点。这可能表明新的下跌趋势的开始,该趋势将继续进行,直到价格反转其方向再次回到上行。 伯毛伊海峡特色 Berma
筛选:
equalitygr
193
equalitygr 2026.05.11 10:59 
 

Very simple and successful system.

I am updating my review that I have added 2 hours before.

Not only is this system the best and the simplest that I have ever seen, but the support of the developer is unbelievable. He is helping me a lot, giving me many examples and giving me tips for every detail of this system.

I am not an affiliate with this indicator.

Muhammad Elbermawi
53551
来自开发人员的回复 Muhammad Elbermawi 2026.05.11 11:32
Thanks a lot for your kind words 💚 I appreciate it.
mohamed ahmed
23
mohamed ahmed 2026.04.19 20:32 
 

用户没有留下任何评级信息

Ahmed Abdellatif
55
Ahmed Abdellatif 2026.04.08 04:38 
 

用户没有留下任何评级信息

Fadi Roman
253
Fadi Roman 2026.02.22 23:47 
 

用户没有留下任何评级信息

Muhammad Elbermawi
53551
来自开发人员的回复 Muhammad Elbermawi 2026.02.24 05:34
Thanks a lot for your kind words 💚 I appreciate it.
123478888
19
123478888 2026.02.19 19:07 
 

Excellent and highly accurate trend indicator. Easy to use and provides clear signals. Highly recommended 👍

munther1974
39
munther1974 2026.01.21 09:05 
 

用户没有留下任何评级信息

ahmed mamdoh
21
ahmed mamdoh 2026.01.20 09:47 
 

用户没有留下任何评级信息

Mohammed Mustafa Alim Bushara
147
Mohammed Mustafa Alim Bushara 2026.01.11 02:28 
 

用户没有留下任何评级信息

Muhammad Elbermawi
53551
来自开发人员的回复 Muhammad Elbermawi 2026.01.11 17:01
Thanks a lot for your kind words 💚 I appreciate it.
0xMohamEd
22
0xMohamEd 2026.01.05 21:00 
 

用户没有留下任何评级信息

9930075
19
9930075 2026.01.05 13:15 
 

用户没有留下任何评级信息

mondas pro
23
mondas pro 2025.12.25 15:29 
 

用户没有留下任何评级信息

mohamed kilany
23
mohamed kilany 2025.12.09 01:02 
 

用户没有留下任何评级信息

Muhammad Elbermawi
53551
来自开发人员的回复 Muhammad Elbermawi 2025.12.09 05:27
Thanks a lot for your kind words 💚 I appreciate it.
mahaon2
195
mahaon2 2025.10.15 14:00 
 

用户没有留下任何评级信息

Mohamed Abdalla
38
Mohamed Abdalla 2025.09.26 14:08 
 

用户没有留下任何评级信息

Juergen Loebach
1321
Juergen Loebach 2025.09.18 11:34 
 

The manual and video clips are particularly Very useful for beginners. indicator delivered very good results in the test.

KEWELL99 Hields
103
KEWELL99 Hields 2025.07.23 21:04 
 

I like the fact that Mohammed doesnt just provide visually intuitive indicators to identify trends and other trading tactics, with the Berma Bands he provides a strategy/system for us to follow that he obviously uses himself for profitability, I have previous indicators from Mohammed and he is one of the best sellers on here - the 5 stars though is for the product and the fact that he really wants to help, his service is excellent and he is always ready to help and chat - thank you Mohammed

walaaeldinsaleh
22
walaaeldinsaleh 2025.07.10 15:05 
 

用户没有留下任何评级信息

garypang
248
garypang 2025.07.08 22:38 
 

This Indicator is a hidden gem, makes my trading very easy and confidence when taking trades. Truly appreciate Mr Muhammad Elbermawi excellent support and guidance.

ashraf_azzam
185
ashraf_azzam 2025.06.30 22:44 
 

用户没有留下任何评级信息

hikari678
491
hikari678 2025.06.19 10:08 
 

用户没有留下任何评级信息

12
回复评论