Levels of Timeframes for MT5
- Indicadores
- Versão: 4.90
- Atualizado: 19 julho 2026
- Ativações: 10

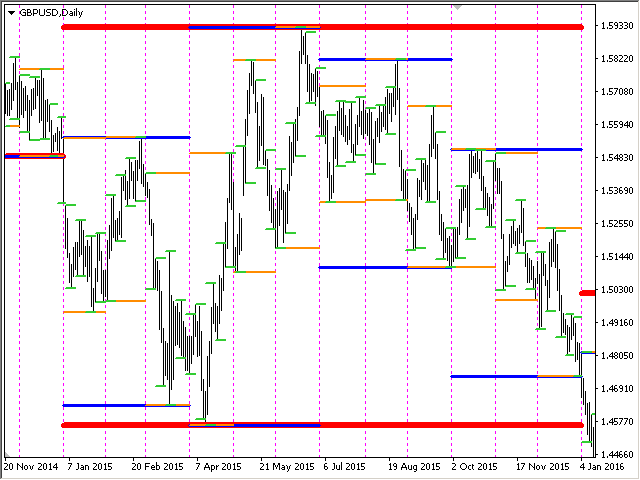
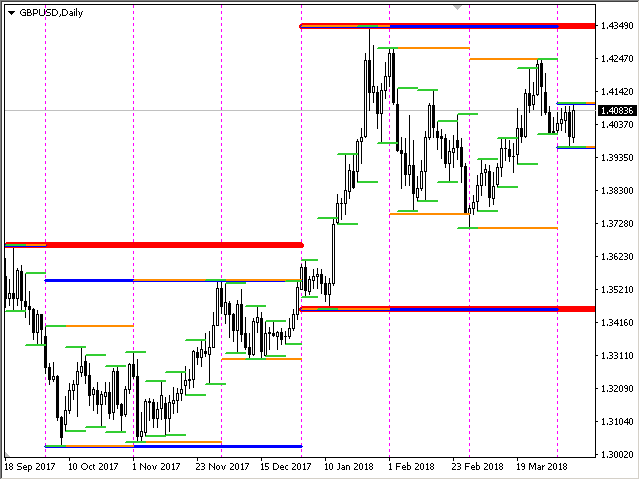
O indicador mostra os níveis máximo/baixo/aberto/fechado de outros períodos de tempo (e não padrão) - Ano, 6 meses, 4 meses, 3 meses, 2 meses, mês, semana, dia, H3-H6-H8-H12 horas M45 M90 . Você também pode definir o turno de abertura das velas e construir velas virtuais.
Os "separadores de período" para um desses intervalos de tempo estão disponíveis na forma de linhas verticais. Os alertas podem ser configurados para quebras dos níveis atuais ou anteriores (quebra da linha alta/baixa de ontem/semana passada, etc.).
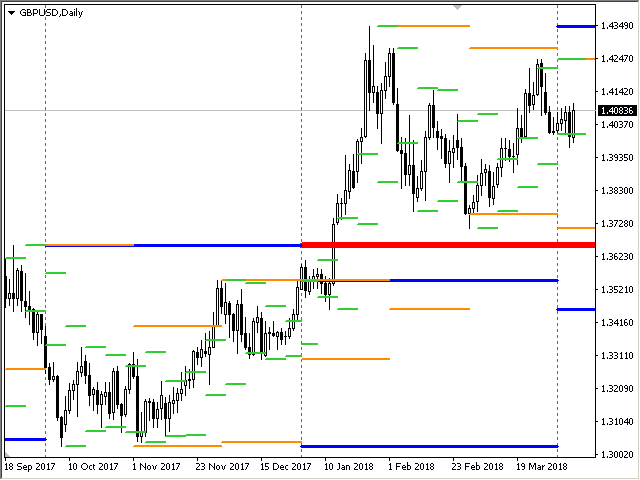
Você também pode deslocar todos os níveis para a direita em um período. Ou seja, o Máximo/Mínimo do período anterior será mostrado no período atual
Parâmetros
Number of levels to calculate (0-all) — quantas barras serão exibidas na tela.
Change the opening of bars (hours) — alterar a abertura das velas em n horas. O indicador desenhará barras virtuais levando em consideração o novo horário de abertura. Os períodos acima de MN1 não mudam.
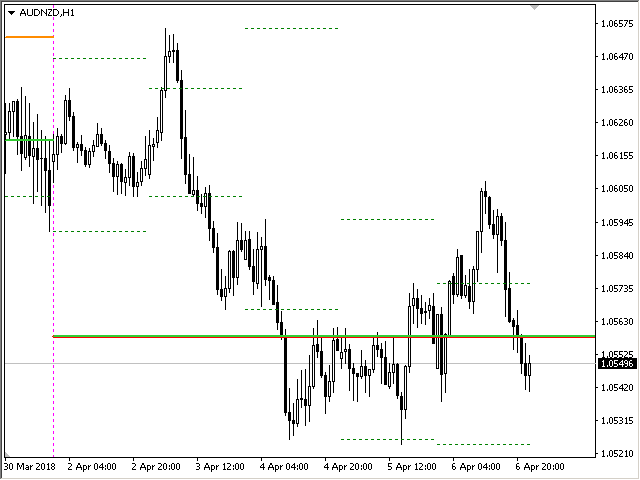
Move the levels to the right — move todos os níveis uma barra para a direita. Você verá os níveis anteriores na vela atual.
Period Separator (vertical lines) — exibe uma linha vertical, separador de período.
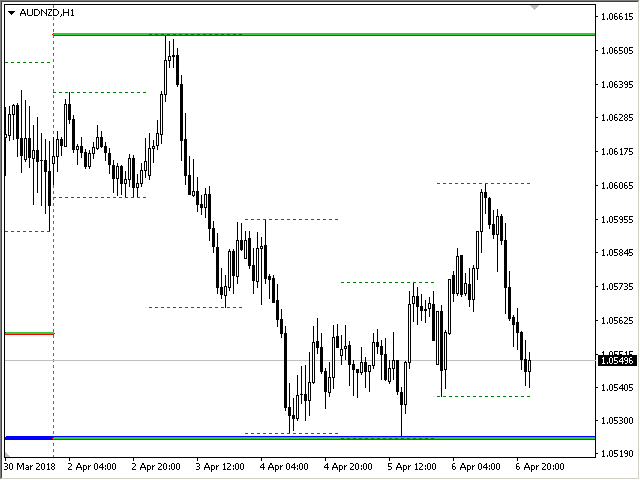
Show High Lines (trigger for all highs) — desativa ou ativa o desenho de níveis elevados.
Show Low Lines (trigger for all lows) — desativa ou ativa o desenho de níveis baixos.
Show Open Line — período de tempo para o qual a linha de preço aberta será desenhada. Você pode selecionar "All TF for Highs & Lows" e os níveis serão sorteados de acordo com os períodos especificados para High-Low.
Draw Open Line immediately when a new bar appears.
Draw Open Line immediately when a new bar appears.
Show Close Line — período de tempo para o qual a linha de fechamento do preço será desenhada. Você pode selecionar "All TF for Highs & Lows" e os níveis serão sorteados de acordo com os períodos especificados para High-Low.
Week starts on Sunday — no terminal, por padrão, as velas W1 começam no domingo. Se definido como 'falso', a semana começará na segunda-feira.
Show levels (Mostrar níveis)
from M45/M90 to Year — mostra o alto e o baixo dos períodos selecionados. Ano, 6 meses, 4 meses, 3 meses, 2 meses, mês, semana, dia, 4-6-8-12 horas
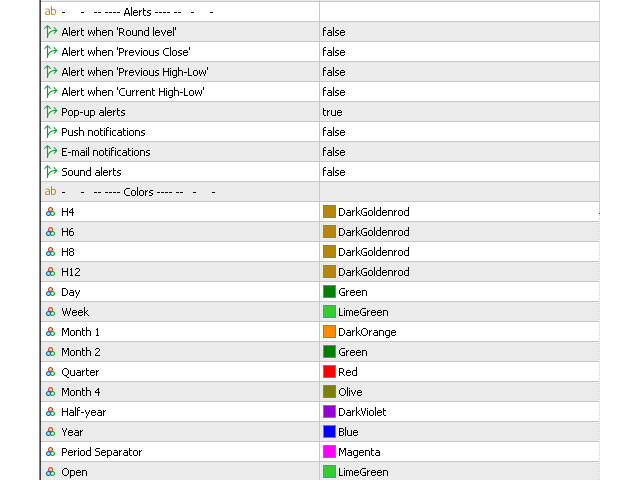
Alerts (Alertas)
Alert when 'Round level' — envie um alerta quando o preço atingir um nível redondo.
Alert when 'Current Highs-Lows' — envie um alerta quando o preço atingir os níveis atuais.
Alert when 'Previous High-Low' — envie um alerta quando o preço atingir os níveis anteriores.
Pop-up alerts — Alertas pop-up.
Push notifications — Notificações via push.
E-mail notifications — Notificações por e-mail.
Sound alerts — Alertas sonoros.
Colors (Cores)
from M45 to Year — ajuste de cor para linhas de período.
Period Separator — cor das linhas separadoras de período.
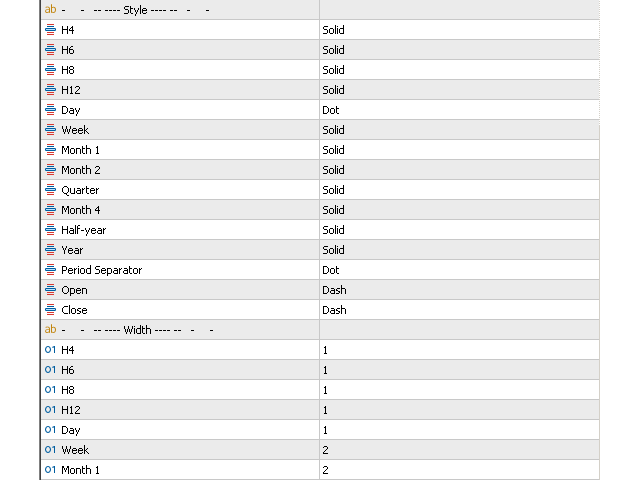
Line style (Estilo de linha)
from M45 to Year — estilo de linha do período.
Period Separator — estilo das linhas separadoras de período.
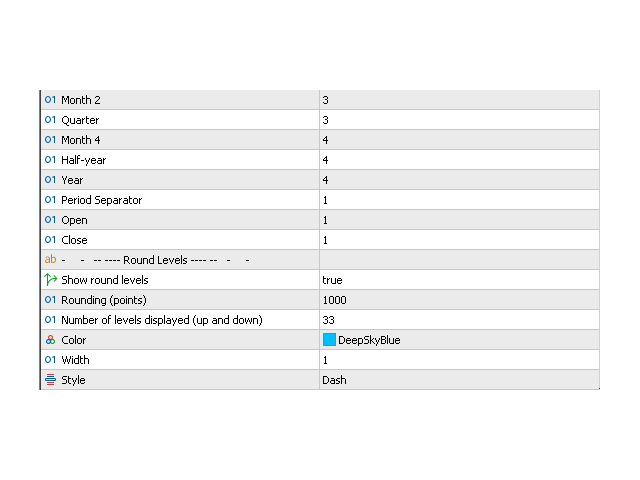
Line width (Espessura da linha)
from M45 to Year — largura da linha do período.
Period Separator — largura das linhas separadoras de período.
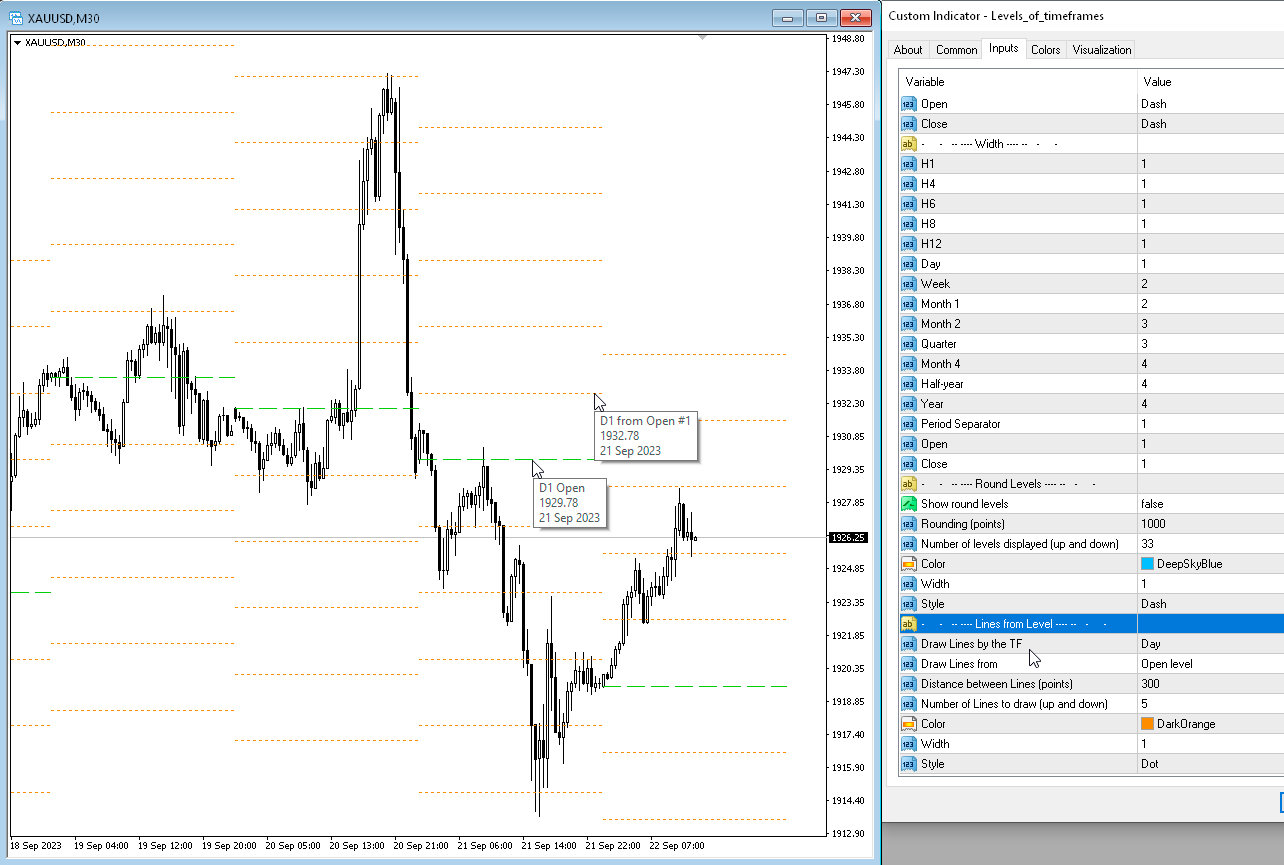
Round Levels (Níveis redondos)
Show round levels — Mostrar níveis redondos.
Rounding (points) — Arredondamento (pontos).
Number of levels displayed (up and down) — o número de níveis a serem exibidos, acima e abaixo do nível atual.
Color — Cor.
Width — Largura.
Style — Estilo.
O indicador mostra OHLC (HLOC) dos períodos especificados (barras personalizadas ou velas personalizadas).


Great tool for price action trading. Developer does great work and listens to user feedback.