已发布的产品

Tick Speed & Volume Burst 描述
专业指标,通过两种互补的指标实时检测异常的流动性涌入: Tick Speed(蓝色) :衡量价格跳动速度的加速,用于识别订单簿中的异常活动。 Volume Burst(红色) :通过标准差分析识别统计上异常的成交量峰值。 该工具在可调节周期内对数据进行归一化处理,并在活动超出设定偏差阈值时触发警报(声音 / 弹窗 / 邮件 / 推送)。 使用方法 关键参数: SpikeThreshold (2.0 = 中等灵敏度,3.0 = 高选择性), AveragePeriod (默认 20 根K线)。 解读: 当两种直方图同时出现峰值时,通常表示机构入场/出场或宏观经济事件。 警报设置: 在 “ALERTES” 组中配置,以实时接收异常通知。 时间周期: 在 M1–M5 适用于剥头皮交易,在 M15–H1 适用于波段交易。 组合使用: 建议与趋势方向指标结合,以过滤虚假突破。 应用场景:
在突破前识别机构高活跃区域、检测市场操纵(扫止损行为)、确认关键支撑与阻力水平。

Volume Profile Rectangle 概要 交互式 成交量分布指标 ,用于在选定区域内显示每个价格水平的成交量水平分布。它会自动创建一个可移动的矩形,并以彩色条形图显示多头与空头成交量的分布情况。 功能说明: 显示水平成交量 :以水平条形图形式可视化每个价格水平的成交量分布 多空分析 :绿色代表多头主导成交量,红色代表空头主导成交量 交互式矩形 :移动矩形后自动更新分析结果 自动创建 :启动后自动生成一个默认矩形,可立即使用 工作原理: 区域选择 :矩形(自动或手动创建)定义分析区域(时间 + 价格) 成交量分布 :将价格区间分为若干级别(可调分辨率),并分配选定K线的成交量 智能上色 :分析每个价格级别,判断多头或空头成交量是否占主导 动态显示 :当图表移动、缩放或滚动时,条形图会自动重绘 可选过滤器 :可按K线实体或全影线过滤(垂直过滤) 主要参数设置: 矩形 RectangleName :矩形名称(默认值:"VolumeRect") AutoCreateRectangle :启动时自动创建矩形 可视化 MaxBarWidthPixels :条形的最大宽度(默认 120

Liquidity Flow Analyzer (LFA) v2.2 实时检测机构资金流向市场的位置——在价格启动之前发现流动性变化。 指标显示内容 绿色/红色柱状图 —— 每根K线的净流动性流量: 绿色 = 买方占主导 红色 = 卖方占主导 LFA 线 —— 根据设定周期平滑后的流动性趋势 EMA 信号线 —— LFA 与 EMA 的交叉表示动量变化(类似 MACD) 箭头信号 —— 吸筹 ↑ 和 派发 ↓ 信号,由高成交量和价格位置共同确认 信息面板 显示在图表角落,并实时更新: Symbol / TF —— 当前交易品种和时间周期 Flow —— 当前 LFA 数值(+ 看涨 / − 看跌) Trend —— LFA 相对于 EMA 的动量状态:BULLISH / BEARISH / FLAT Signal —— ACCUMULATION · DISTRIBUTION · NEUTRAL Accum / Distrib —— 0–100% 的评分条 Vol —— 当前成交量与平均成交量的比率:SURGE · HIGH · NORMAL · LOW HTF —— 高周期确认状态:A

Volume Profile Density V2.40 显示按价格水平分布的成交量,揭示机构交易兴趣区域。
不同于按时间统计的传统成交量,它展示成交量真正集中的位置。 主要概念: 水平条 = 各价格成交量 条越长 → 成交量越大 红色区域 = 关键支撑/阻力 主要用途: 识别真实支撑与阻力 确定 POC (控制点) 定义 价值区域 (占总量的70%) 低成交量区用于止损或目标 颜色说明: 蓝色 = 低成交量(快速通过区) 黄色 = 中等成交量(平衡区) 红色 = 高成交量(机构活动区) 交易策略: 红区反弹买入 红区或VAH受阻卖出 POC突破配合成交量进场 回测POC时入场 目标设在蓝区 参数设置: 初学者:1.0 / 100% / 1.0 短线交易:0.5 / 200% / 0.5 波段交易:2.0 / 50% / 1.5 技术信息: 版本:2.40 平台:MT5 品种:外汇、CFD、贵金属、加密货币 时间周期:M1–M15 类型:实时自适应指标 总结:
成交量不会说谎——顺应成交量区域交易,而不是逆势而行。
FREE
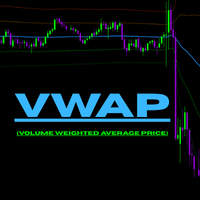
PVWAP Improved MT5 – 高级成交量加权平均价指标 PVWAP Improved MT5 是我个人 VWAP 指标的增强版和优化版。该指标显示成交量加权平均价,并提供多条标准差通道,用于识别潜在的支撑、阻力以及价格动能衰减区域。指标适用于所有周期,并在处理大量历史数据时依然运行流畅。 指标用途 VWAP 表示大量成交发生时的平均价格,是判断市场位置和公平价值的重要参考。 主要用途: 价格高于 VWAP:市场偏多 价格低于 VWAP:市场偏空 标准差通道(+1、+2、-1、-2)显示超买和超卖区域 帮助识别潜在的进场、离场或反弹位置 用于判定市场是趋势运行還是均值回归 该指标非常适合日内交易、剥头皮以及波段交易者,用于分析市场真实压力。 主要特性 使用 MetaTrader 5 的真实成交量進行計算 Daily 模式:每天重置,適合日內交易 Continuous 模式:VWAP 持續計算不中斷 最多 4 條標準差通道:+1、+2、-1、-2 顏色、線型、線寬完全可自定義 支持所有品種和所有周期 計算快速,適合回測和實時交易 指標穩定清晰,易於整合到任何交易策略中
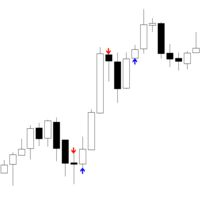
中文(简体)Iceblock 简短描述:
Iceblock — MT4 指标,识别高成交量但价格波动小的聚簇(类似冰山单行为)。 时间框架:
适用于所有时间周期(M1 至 D1)。 品种:
兼容外汇、指数、黄金和差价合约(CFD)。 参数: VolumeLookback – 计算平均成交量的蜡烛数量 VolumeThreshold – 判定成交量异常的乘数 ClusterSize – 用于确认簇的相邻蜡烛数量 RangeComparisonPeriod – 用于平均价格区间(高–低)的周期 简短结论:
Iceblock 高亮显示成交活跃但价格变动有限的区域——类似冰山单导致的现象,但仅基于 MT4 的成交量与价格数据。箭头为异常活动标记,不等同买卖信号。
FREE

his indicator automatically identifies key support and resistance levels by analyzing volume patterns. Unlike traditional S/R tools that rely only on price, Volume S/R finds levels where the market truly reacted. DETECTION LOGIC: - High Volume Zones: Price levels where strong buying/selling occurred - Low Volume Zones: Areas of weak interest - potential breakout or reversal zones
SMART FILTERING: - Nearby levels are automatically merged to avoid chart clutter - Maximum levels limit keeps yo
FREE

Range Breakout EA – Simple Description Concept
An automated trading robot for MetaTrader 5 that exploits range breakouts with two key periods: Features Automatic market hours management Customizable Stop Loss and Take Profit Smart Trailing Stop Built-in testing mode for simulation Detailed logs for monitoring How It Works Records extreme prices at the start of the day Waits for a breakout of the secondary range Opens a position in the breakout direction Automatically manages the trade (SL/TP/Tr
FREE
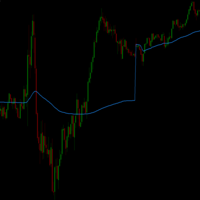
VWAP_PC_MQL5 — 一个简单的自制 VWAP 类指标,在 MT5 图表上实时显示成交量加权平均价。 时间框架:
适用于所有周期。 品种:
兼容外汇、指数、大宗商品和股票。 参数: AppliedPrice – 用于计算的价格类型(收盘价、典型价、加权价等) LineColor / Width / Style – 线条样式设置 SessionReset – 可每日重置或连续模式 工作原理(VWAP 原理):
VWAP(成交量加权平均价)计算公式为: VWAP = (价格 × 成交量之和) / (成交量之和) 它反映买卖双方的动态平衡:
价格 高于 VWAP → 多头占优;
价格 低于 VWAP → 空头占优。 简短结论:
VWAP_PC_MQL5 是一个轻量级的 VWAP 工具,结构简单但实用,帮助学习和分析成交量行为。
FREE
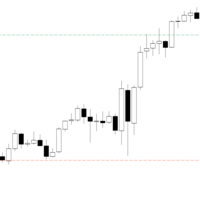
PDHL – simply displays the highs and lows of previous days directly on your chart, providing a quick and visual reference of past key levels. The indicator is lightweight and easily customizable , allowing you to adjust the number of days displayed, the colors, as well as the style and thickness of the lines to suit your preferences. It is designed to be simple and practical, but may not work on all instruments or platforms .
Only teste Tested only with CFDs
FREE
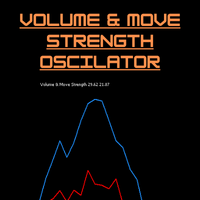
Volume & Move Strength (VMS) Indicator for MT5 The VMS Indicator displays the relationship between trading volume and price movement strength, helping traders assess how well market activity supports price action. How It Works: Measures tick volume as trading activity. Calculates move strength using a normalized True Range (%). Both values can be smoothed (default: 5) and optionally normalized (0–100) for consistency across markets. Plots two lines in a separate window: Blue (Volume) – trading a
FREE

his indicator automatically identifies key support and resistance levels by analyzing volume patterns. Unlike traditional S/R tools that rely only on price, Volume S/R finds levels where the market truly reacted. DETECTION LOGIC: - High Volume Zones: Price levels where strong buying/selling occurred - Low Volume Zones: Areas of weak interest - potential breakout or reversal zones
SMART FILTERING: - Nearby levels are automatically merged to avoid chart clutter - Maximum levels limit keeps yo
FREE
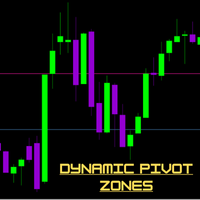
Dynamic Pivot Zones – Your Level Assistant on the Chart This indicator is a bit like a GPS for your trading . It shows you where the price likes to hang out, where it gets nervous, and where it flies through. No more calculating pivots by hand or guessing support and resistance levels. What it does: Automatically plots H1, H4, and D1 pivots . Shows support and resistance zones : R1, R2, S1, S2. Lines are colored and easy to read , so you can instantly see what’s hot or cold. Why you’ll love it:
FREE
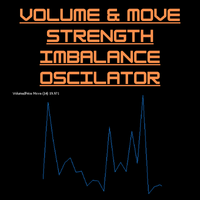
Volume-to-Price Movement Oscillator (VP Oscillator) for MT5 The VP Oscillator highlights the balance (or imbalance) between trading volume and price movement, helping traders spot hidden accumulation, distribution, or weakening trends. How It Works: Calculates each bar’s price range (High–Low) and tick volume. Normalizes both values over a set period (default: 14). Plots the absolute difference between them ×100 — showing how closely price action aligns with trading activity. Interpretation: Hig
FREE
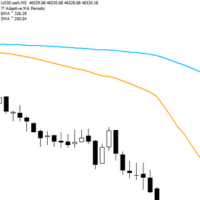
Adaptive Flow MAs is a moving average indicator designed to naturally adjust to market movements. Unlike traditional averages, it dynamically adapts its periods based on recent volatility and the current trend. The EMA closely follows rapid price swings to capture every impulse, while the SMA remains smoother, providing a stable and reliable reference. With a clean display showing the current adaptive periods, this tool helps traders feel the “flow” of the market without visual clutter. It’s cr
FREE

STRUCTURAL TREND LINES - MT4/MT5 Indicator
Simple indicator that automatically draws trend lines based on market structure.
Features:
- 3 degrees of structure detection (short, medium, long term)
- Configurable swing strength for each degree
- Single color per degree for clean visualization
- Adjustable number of lines per degree
- Customizable colors and line widths
How it works:
The indicator identifies swing highs and lows based on the strength parameter,
then connects these points to crea
FREE
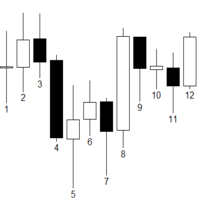
此指标可用于对 CFD 交易中的每个交易时段的 K 线进行编号,帮助交易者更直观地了解每一根 K 线在交易日中的位置和顺序。适用于 GER40、UK100、US30、US100 和 US500 ,并且可以完全自定义,以适应您的交易风格和图表偏好,非常适合日常交易分析、策略优化和市场行为研究。 主要功能和参数: 自定义交易时段: 可自由设置开盘和收盘时间,满足不同交易时段需求 隐藏偶数编号选项: 让图表更加清晰整洁,避免视觉干扰 调整编号距离: 灵活调整数字在图表上的显示位置,方便观察 字体大小和颜色: 可根据个人喜好调整,使图表信息一目了然 显示天数: 控制显示的交易日数量,便于回顾和分析多日走势 此工具非常适合希望对交易时段的 K 线有清晰、整齐视图的交易者,帮助用户更高效地跟踪市场波动、分析交易行为,并在制定交易策略和优化交易决策时提供可靠参考。无论是日内交易还是中短线策略,这款指标都能成为您图表分析中的实用助手。
FREE
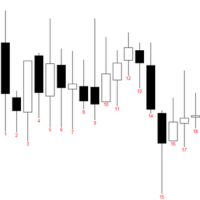
indicator that numbers the bars (candles) in a custom trading session.
The indicator allows: Defining the session start time (StartHour and StartMinute) Displaying numbers only on odd bars (if AfficherUniquementImpairs is true) Displaying numbers on the last N days (NbJours) Customizing the color and font size of the text The indicator will loop through the bars of the last N days and, for each day, start counting from the session start time.
It will display the bar number (starting at 1) belo
FREE
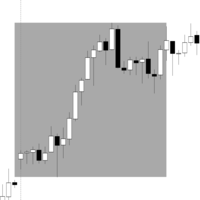
交易时段 Range Box 指标 此指标允许交易者在图表上可视化和分析特定时间段,通过为每个交易时段绘制矩形框来直观显示价格区间,帮助快速识别市场波动和关键价位,提升交易决策效率,同时辅助优化交易策略、管理风险,并更清晰地理解市场行为和趋势变化。 主要功能: 自定义交易时段: 设置开盘和收盘时间,灵活适应不同交易策略和交易风格。 显示天数: 选择显示多少天的历史交易时段,便于回顾和分析多日走势和价格模式。 默认颜色和周一高亮颜色: 轻松突出每周模式,快速识别重要交易日和特殊市场行为。 可调边框宽度: 根据个人偏好自定义矩形外观,保持图表整洁并增强可读性。 自动计算高低价: 快速识别每个交易时段的关键价格水平,辅助策略制定和风险管理,提高整体交易效率。
FREE

STRUCTURAL TREND LINES - MT4 Indicator
Simple indicator that automatically draws trend lines based on market structure.
Features:
- 3 degrees of structure detection (short, medium, long term)
- Configurable swing strength for each degree
- Single color per degree for clean visualization
- Adjustable number of lines per degree
- Customizable colors and line widths
How it works:
The indicator identifies swing highs and lows based on the strength parameter,
then connects these points to create t
FREE
技术说明 Nexus Signal System 是一款 MT4 指标,结合了 12 个技术指标来生成交易信号。该系统在确认信号前会分析多种因素的共振(趋势、动量、成交量、支撑/阻力区),与只使用单一指标的工具相比,可减少假信号的数量。 分析标准(评分 0–15 分): 图形形态识别(Pin Bar、吞没形态) 多时间框架分析(高时间框架趋势确认) ADX 市场状态(避免无趋势市场) 支撑/阻力区(自动识别波段点) 均线 20/50/200(趋势对齐) RSI 14 周期(动量指标) 相对成交量(机构确认) ATR(波动率) 功能特点: 带透明评分的信号(0–15 分) 自动检测支撑/阻力区并在图表上显示 初步信号(当前K线)与确认信号(已收盘K线) 止损和止盈通过 ATR 计算 实时市场信息面板 8 种颜色主题可供视觉定制 56 个可配置参数,可适应您的交易风格 使用方法: 安装: 在 MetaEditor 编译并加载到图表 关键参数: Min_Signal_Score :设置最低信号质量阈值(默认 6.5/15) MTF_Timeframe :确认用时间框架(默认 H4) Colo
Spike Signal v1.2 — MT5 指标,可检测 Boom/Crash 指数的剧烈价格尖峰并生成实时剥头皮信号。 时间框架:
适用于所有周期(推荐 M1–M15)。 品种:
专为 Deriv 合成指数 Boom 和 Crash 设计,也适用于高波动市场。 参数: SpikeSensitivity / MinSize – 尖峰灵敏度与最小大小 EMA (8/21) – 入场交叉信号 RSI (14) – 趋势过滤器 TP/SL Points – 止盈与止损点数 Trailing Exit / Alerts – 动态离场逻辑与视觉/声音警报 简短结论:
Spike Signal v1.2 自动识别上涨/下跌尖峰,显示买卖箭头,并通过 TP、SL 或追踪逻辑管理离场。非常适合 Boom/Crash 指数剥头皮交易。

Candle Activity Visualizer Candle Activity Visualizer 将您的图表转化为动态热力图,清晰展示买卖双方的力量变化。 深入的市场分析: 活动区域识别: 算法检测出高成交量集中在狭窄价格区间的区域,揭示关键的市场压力点。 实时强度变化: 颜色会根据市场变化实时调整,从冷色调逐渐过渡到暖色调。 视觉自定义: 5 种配色主题: Thermal、Ocean、Inferno、Forest 和 Aurora —— 满足不同偏好的视觉风格。 基于成交量的高度: 可选模式,根据成交量调整柱体高度,提供更多视觉信息。 性能与可读性: 高效优化: 即使在市场剧烈波动时,也能保持快速与流畅。 清晰视觉效果: 动态对比度让低活跃与高活跃区域一目了然。 Candle Activity Visualizer 为交易者提供一种直观、简洁的市场分析方式。
Proxy Order Flow – Imbalance Tick-Spread
基于点差不平衡的指标。 TF:
适用于所有时间周期(M1 到 D1)。 交易品种:
兼容外汇、指数、黄金和差价合约(自动适配 JPY、黄金和 CFD 品种)。 参数: TickWindow (200) – 观察的 tick 窗口 SpreadWeight (1.5) – 点差权重 NormalizationPeriod (20) – 标准化周期(z-score) Overbought / Oversold (±3.0) – 超买/超卖阈值 AlertCooldown (300s) – 警报冷却时间 结论:
Proxy Order Flow – Imbalance Tick-Spread v2.4 通过分析 OHLC 变化和点差,识别买卖压力,清晰显示市场流向与不平衡区域。

ProxyFootprint — 概述 ProxyFootprint Advanced 是一款适用于 MetaTrader 5 的订单流可视化指标,可帮助交易者了解不同价格水平下的买卖压力。 它是什么(以及它不是什么) 重要提示: 这并非真正的 足迹图(Footprint Chart) 。真实的足迹图需要从交易所或专业数据提供商处获取实际订单簿数据(每个价格级别的买/卖量)。本指标使用公开的行情数据,基于 模拟算法 提供类似足迹图的可视化效果。 工作原理 该指标逐笔分析价格变动,以估算买卖压力: 向上的价格跳动视为买方压力 向下的价格跳动视为卖方压力 在每根K线内部的多个价格层级计算并显示买卖差(买量 – 卖量,称为“Delta”) 主要功能 多层价格分析:每根K线可显示多达8个可自定义价位的Delta值 净Delta显示:展示每根K线的整体买卖压力 六种视觉主题:Professional、Dark、Light、Vibrant、Classic、Custom 智能过滤:仅显示重要的Delta值,避免视觉干扰 实时更新:当前K线每2秒刷新一次 高效轻量:针对 M1、M5、M15 时间周期优
订单流强度(Order Flow Strength, OFS) 描述:
该指标通过分析每根K线收盘价在其区间的位置,并 结合成交量加权 ,来衡量 订单流的强度 。在独立窗口显示 买压(绿色) 和 卖压(红色) 。 公式 Order Flow Strength = Close − Low High − Low × Volume \text{Order Flow Strength} = \frac{\text{Close} - \text{Low}}{\text{High} - \text{Low}} \times \text{Volume} Order Flow Strength = High − Low Close − Low × Volume Close :K线收盘价 High :K线最高价 Low :K线最低价 Volume :该K线的成交量 公式将收盘价的相对位置(靠近高点或低点)与成交量结合,用于衡量市场运动的强度。 功能特点 原始模式(Raw Mode) 显示 成交量加权的绝对值 。 用于观察真实的买卖压力,无需归一化处理。 归一化模式(Normalized Mode)
Directional Volume — 可视化多头与空头压力 Directional Volume(方向成交量) 是一个轻量但功能强大的成交量指标,它将多头与空头的交易压力分开,以直观的视觉形式呈现。
它不仅显示总成交量,还突出展示买方与卖方的主导力量,帮助交易者快速判断市场情绪与动能强度。 与传统成交量的区别 与仅显示每根K线总成交量的传统成交量柱不同, Directional Volume 根据K线方向划分成交量: 绿色柱状图 — 多头成交量(收盘价 > 开盘价的K线) 红色柱状图 — 空头成交量(收盘价 < 开盘价的K线) 这种划分方式让交易者可以轻松看出市场由买方还是卖方主导,以及动能何时开始转变。 使用方法 将指标附加到任意图表(适用于所有周期和交易品种) 观察绿色与红色柱状图,评估买卖力量的强弱 寻找成交量的急剧放大以识别强势压力或潜在突破区域 对比价格走势与方向成交量,发现潜在的背离信号 通过背离提前预测可能的趋势反转或动能衰竭 对无真实成交量数据的市场,可自动适配为tick成交量 交易应用 通过价格与成交量方向一致来确认趋势 在震荡市场中识别吸筹/派发阶段 发现成交量

反应指标 – MT5经济事件市场反应测量工具 反应指标 实时分析并量化市场对经济日历事件的反应。它会在每次重要经济公告后自动测量价格在10秒、30秒和60秒时的变动(以点数计算)。 主要功能 自动事件获取
与MT5原生日历API无缝集成,无需额外配置。 精确的新闻后波动性测量
计算新闻发布后价格波动速度(点数/分钟)。 对比分析
将每个事件的市场反应与历史上类似事件(按国家和类型分类)进行比较。 新闻前市场分析
在事件发布前15分钟分析市场状况,包括点差、波动性和预期影响。 可配置提醒系统
支持声音、弹窗、电子邮件和推送通知。 数据持久化
自动将所有测量数据保存为CSV格式,便于后续分析。 智能筛选
按重要性等级(1–3星)和受影响货币进行筛选。 实际用途 该指标可帮助交易者 量化市场对经济新闻的反应 , 识别历史上高影响力事件 ,并 评估公告前的市场条件 。
历史数据有助于预测 未来波动幅度的可能性 ,为交易决策提供客观依据。

Rainbow Price Visualizer v1.21 See where the market really breathes.
Turns your MT4 chart into an ultra-precise heatmap that highlights price zones favored by big players. Why it matters 300 price levels at 0.2‑pip resolution — microscopic detail. 8 visual themes (Rainbow, Fire, Ocean…) for instant readibility. Smart opacity: low noise fades, real zones pop. Lightweight rendering with automatic cleanup. Fully customizable: saturation, opacity, resolution, history depth. Bands project into the f

AurumNavigator – 黄金 XAU/USD 专家顾问 v7
专注于黄金交易的EA,遵循智能资金(Smart Money)逻辑,而非传统指标。使用Wyckoff周期分析判断市场阶段:积累(大资金悄悄建仓)、操纵(诱导散户)、分配(趋势开始)。 机构分析: 检测成交量吸收:当成交量激增而价格几乎不动时,说明有人在建仓。 识别订单块(Order Blocks):机构大额订单所在区域。 发现公允价值缺口(FVG):市场经常回补的价格失衡区。 交易流动性扫荡(Liquidity Sweeps):价格突破某一水平触发止损后反向运行。 多层次保护: 进入前确认H1、H4和D1多周期一致性。 需要高于平均的成交量。 如果点差超过30点则不交易。 重要新闻前后30分钟不交易。 仅在伦敦/纽约交易时段有足够流动性时交易。 自适应资金管理: 根据账户表现自动调整手数。 连续三次亏损后暂停交易1小时。 回撤期间逐步减少手数,最多减少70%。 MM灵敏度可调,0为保守 x0.5,10为激进 x2.0,5为平衡。 仓位管理: 止损基于ATR x5(随黄金波动调整)。 分段止盈:30%在3R,30%在

Simple Delta – 客户说明 Simple Delta 是一个简洁高效的 MetaTrader 5 成交量德尔塔指标,在每根蜡烛上方显示归一化的买卖压力。 您将获得 该指标分析实时 Tick 数据以计算德尔塔(买入量减去卖出量),并在每根蜡烛上方显示单一归一化数值(-10 到 +10)。 正值 表示买方占优(以您选择的买入颜色显示), 负值 表示卖方压力(以您选择的卖出颜色显示)。 主要特点 即时可视化:每根蜡烛一个数值 — 无杂乱,只有可操作的数据 6 种专业配色主题 + 完全可自定义颜色 当前蜡烛每 2 秒实时更新 可调文本位置以适应您的图表布局 优化适用于 M5 和 M15 时间框架 非常适合希望进行干净、无干扰的订单流分析而不想让图表被复杂指标淹没的交易者。

机构流动性压缩指标 该指标通过布林带宽度、成交量和平均点差的标准化测量,实时检测流动性收紧情况,以识别价格突破前的压缩阶段。 显示方式:
专业独立窗口,包含“Compression Score”柱状图与“Threshold”阈值线。 主要特点 早期检测: 在价格波动前识别压缩区域。 多因素测量: 结合布林带宽度、成交量与平均点差的标准化数据。 实时更新: 每个行情跳动(tick)即时刷新。 清晰显示: “Compression”柱状图与虚线“Threshold”参考线。 兼容性: 适用于 MT4 与 MT5 平台。 使用方法 将指标添加至目标品种图表。 根据波动性与交易时段调整阈值与权重。 解读: 当分数较高时,表示出现流动性压缩,需关注潜在突破。 参数说明 BB_Period / BB_Dev: 计算布林带宽度。 Norm_Period: 近期波动性标准化周期。 Vol_Period: 成交量标准化周期(按 tick 计)。 Spr_Period: 平均点差标准化周期(MT5 使用历史数据,MT4 使用即时代理)。 Weight_Width / Weight_Volume / We
Mean Reversion Probability – 统计性均值回归指标 简短说明
机构级指标,根据历史超延伸分析,计算价格回归到200周期均线(MA200)的统计概率。以量化精度识别市场疲劳区域。 主要功能
高级统计分析 – 基于500+历史延伸数据计算真实概率
概率评分 (0–99%) – 精确量化回归均线的可能性
疲劳检测 – 测量超延伸的持续时间与强度
多资产标准化 – 自动适配外汇、指数、黄金、加密货币、差价合约
智能警报 – 罕见但高度可靠的信号(概率 >80%,持续时间 >15 根K线)
专业级界面 – 清晰、结构化的机构风格设计 方法学
指标实时分析: 价格与MA200的标准化距离(以ATR计) 自上次回归以来的延伸时长 达到最大延伸的时间 与历史平均值比较 概率计算: 距离评分(最高60%):当前值与历史比值 持续评分(最高40%):延伸时间与平均时间比 疲劳加成(+15%):当持续时间 >1.5×最大延伸时间 极端加成(+10%):当距离 >2.5 ATR 推荐用法
机构级策略: 等待概率 >70% 且 距离 >1.5 ATR 通过较长延伸时间确认(绿色

ARB 是一种指标,用于通过自适应 ATR 通道系统和精确的多因素评分模型(0–100)识别高概率的突破机会。
它结合了波动率、成交量、动能以及多周期趋势分析,提供经过筛选、直观且可实时操作的交易信号。 运行原理 该指标基于 Adaptive Range Breakout(自适应区间突破) 的概念,这是一种现代化的突破交易方法,可根据市场波动率(ATR)和价格的动态结构自动调整阈值。
每个信号都会通过加权评分来评估其质量和可靠性,然后再确认。 评分系统组成(0–100) 每个因素都会对总体评分作出贡献,以评估信号强度: 因素 权重 描述 通道中的位置 40% 测量价格在当前 ATR 区域中的位置 接近突破程度 25% 评估价格距离关键阈值的远近 成交量确认 15% 将当前成交量与移动平均值进行比较 高级别趋势(HTF) 15% 检查是否与更高级别周期的趋势一致 近期动能 5% 融入短期价格运动的动量变化

MFCS(多因子通道评分)是一种高级指标,通过加权评分系统和自适应波动通道,提供清晰的市场动态读数。 主要特点: 自适应ATR通道,实时调整波动率 多因子评分(位置、成交量、动能、高周期趋势、波动性) 根据信号强度(0–100)分类 完整仪表板显示评分、趋势和关键指标 多周期过滤以对齐市场方向 可选成交量验证以增强可靠性 主要参数:
MFCS(多因子通道评分)是一种高级指标,通过加权评分系统和自适应波动通道,提供清晰的市场动态读数。
可调ATR周期、倍数和窗口 可配置评分权重 成交量基于移动平均过滤 可自定义仪表板并集成警报 用途:
专为寻求市场结构定量评估的交易者和技术分析师设计,帮助识别高潜力区域、衡量走势强度并优化进场时机。
该系统融合精确性与灵活性,为专业交易决策提供强大支持与数据驱动的洞察力。

市场评分系统 —— 高级多周期交易指标 专业级市场分析系统,结合技术指标、机器学习模式识别及多周期共振确认,为您提供精准的交易信号。 核心功能: 多周期分析: 在不同周期(M5、H1)之间确认信号,提高交易成功率 智能评分引擎: 基于最近 25 根K线进行加权分析,计算趋势、区间和不确定性评分 市场意图识别: 基于最近 6 根K线及成交量权重,实时判断买盘/卖盘压力 全球评分(0–100): 综合信号强度指标,配备可视化进度条 ATR 风险管理: 动态计算止损、止盈和移动止损 ADX 趋势强度过滤: 基于 DI+/DI- 判断强趋势或震荡行情 成交量环境分析: 区分爆发性波动与低波动蓄势阶段 机器学习系统: 模式识别与结果跟踪,实现自适应信号 严格模式: 基于 ADX、不确定性阈值及趋势强度过滤信号 可自定义仪表盘: 全模式或紧凑模式,可调位置与缩放 信号类型: BUY/SELL: 多指标确认的强趋势信号 RANGE BUY/SELL: 震荡区间内的逆势机会 NEUTRAL: 无明确方向,建议等待更佳入场点 仪表盘结构: 周期:高周期确认与方向分析 评分:趋势、区间、不确定性与相关性指
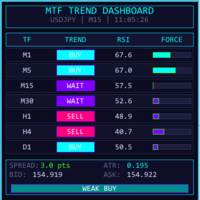
MTF TREND DASHBOARD - 多周期趋势分析面板 强大的可视化仪表板,可同时显示 7 个周期的趋势方向(M1、M5、M15、M30、H1、H4、D1)。 === 主要功能 === 基于 EMA 金叉/死叉的多周期实时趋势检测 RSI 数值及超买/超卖颜色提示 动态趋势强度条 全局市场偏向信号(Strong Buy/Sell、Bias、Weak、Neutral) 实时显示点差、ATR、买价/卖价 现代暗色主题,可自定义霓虹颜色 面板可缩放(50–200%) 可移动到图表任意角落 === 信号条件 === BUY :快 MA > 慢 MA 且 RSI > 50
SELL :快 MA < 慢 MA 且 RSI < 50
信号强度基于 MA/ATR 比率 === 自定义选项 === 快/慢 MA 周期 RSI 周期 ATR 周期 全部面板颜色 面板位置和缩放 === 推荐用法 === 非常适合趋势跟随策略。使用高周期共振(4 个及以上一致信号)可获得更强的入场机会。适用于所有品种和周期。 无重绘。轻量级。每 500ms 更新一次。

Quantum Matrix EA v2.1 Quantum Matrix EA 是一款专业级多周期外汇交易系统,适用于 EURUSD/GBPUSD,具有先进的风险管理功能,包括凯利公式仓位计算、分批止盈策略和自动回撤保护。 Quantum Matrix EA 专为追求稳定盈利的专业交易者设计。 主要功能特点 多周期分析 同时分析 M5、M15、M30、H1、H4、D1 MA 金叉/死叉 + RSI + ADX 趋势确认 入场前需满足最小周期确认数量 高级仓位管理 凯利公式 — 基于胜率与盈亏比的最优仓位计算 基于 ATR 的动态止损/止盈 — 随市场波动自动调整 回撤减仓机制 回撤 5% → 减仓 20% 回撤 10% → 减仓 50% 回撤 15% → 减仓 75% 回撤 20% → 停止交易 智能离场管理 分批止盈 — 在 1.5R 和 2.5R 目标处锁定利润 ATR 追踪止损 — 自动跟随波动 保本保护 — ATR 触发后将 SL 移至进场价上方 风险保护 每日亏损限制(达到 X% 后停止交易) 每日交易次数限制 最大持仓数量限制 市场时段过滤(伦敦/纽约) 点差过滤 成交量

Session Momentum Dashboard – 未来风格交易分析仪表盘 专业级仪表盘,用于分析三大交易时段(亚洲/伦敦/纽约),包含 Kill Zone 识别、亚洲区间突破、以及实时动能评分。 Session Momentum Dashboard 专为 ICT/Smart Money 交易者打造的一体化多时段监控工具。 主要功能: 三大交易时段分析 亚洲、伦敦、纽约时段实时状态显示。 Kill Zone 识别 伦敦 Kill Zone(7 点 – 9 点) 纽约 Kill Zone(12 点 – 14 点)
带自动提醒。 亚洲区间突破(Asian Range Breakout) 图形化显示亚洲区间 检测向上/向下突破 动能评分(Momentum Scoring) 以 RSI 为基础的动能进度条 成交量分析 成交量与平均值对比 分类: LOW / NORMAL / HIGH 交易信号 当以下三者同时出现时生成强信号:
Kill Zone + Breakout + Momentum 伦敦/纽约时段重叠 自动识别高波动时段。 可配置提醒: 进入 Kill Zone 亚洲区间突破 高

高级市场微结构分析指标 该指标在微观层面分析价格行为,以在大行情出现前检测隐藏的不平衡。与只关注价格的传统指标不同, StructureFlow 同时分析三个关键维度: 核心分析 K线微结构 上下影线与实体比例分析 实体在区间中的位置 扩张/收缩检测 内部波动率异常 吞没形态识别 市场节奏 价格速度测量 微观运动加速度 节奏对比检测(领先信号) 反转概率 形态聚类算法 历史相似度匹配 加速/拒绝概率 颜色编码系统 区间 颜色 含义 +50 至 +100 酸橙色 强烈多头不平衡 +20 至 +50 中海绿色 中等多头 +5 至 +20 深海绿色 弱多头 -5 至 +5 灰色 中性 -20 至 -5 印度红 弱空头 -50 至 -20 橙红色 中等空头 -100 至 -50 红色 强烈空头不平衡 背景区域: 深绿色区域:极强多头区 深红色区域:极强空头区 信号线: 金色 — 平滑趋势方向 功能 多周期确认(高周期对齐) 背离检测并带图表箭头 3 种视觉样式:Classic / Gradient / Filled 可调节柱体高度放大器 成交量过滤提升信号质量 提示系统(弹窗 / 声音 / 推

AMD 自适应移动平均线 (AAMA)
AAMA 是一款适用于 MetaTrader 4 的自适应移动平均指标,可根据市场状况自动调整其反应速度。 主要功能: 基于 Kaufman 效率比的自适应移动平均线——在趋势行情中快速反应,在震荡行情中过滤噪音 自动识别四个 AMD 市场阶段:积累期 (Accumulation)、上涨期 (Markup)、分配期 (Distribution)、下跌期 (Markdown) 通过 ATR 实现波动性自适应——根据当前市场状况调整灵敏度 实时信息面板显示检测到的市场阶段、置信度和适应速度 多指标集成:结合 ADX、RSI 和 MACD 精确识别市场阶段 快速/缓慢参考区域,用于可视化自适应行为 使用方法:
指标会根据市场自动调整适应速度——在强趋势时反应更快,在盘整阶段更慢。可视化面板帮助理解当前的市场阶段。所有参数(周期、颜色、灵敏度)都可根据您的交易风格自由设置。

Volume Profile Rectangle 概要 交互式 成交量分布指标 ,用于在选定区域内显示每个价格水平的成交量水平分布。它会自动创建一个可移动的矩形,并以彩色条形图显示多头与空头成交量的分布情况。 功能说明: 显示水平成交量 :以水平条形图形式可视化每个价格水平的成交量分布 多空分析 :绿色代表多头主导成交量,红色代表空头主导成交量 交互式矩形 :移动矩形后自动更新分析结果 自动创建 :启动后自动生成一个默认矩形,可立即使用 工作原理: 区域选择 :矩形(自动或手动创建)定义分析区域(时间 + 价格) 成交量分布 :将价格区间分为若干级别(可调分辨率),并分配选定K线的成交量 智能上色 :分析每个价格级别,判断多头或空头成交量是否占主导 动态显示 :当图表移动、缩放或滚动时,条形图会自动重绘 可选过滤器 :可按K线实体或全影线过滤(垂直过滤) 主要参数设置: 矩形 RectangleName :矩形名称(默认值:"VolumeRect") AutoCreateRectangle :启动时自动创建矩形 可视化 MaxBarWidthPixels :条形的最大宽度(默认 120
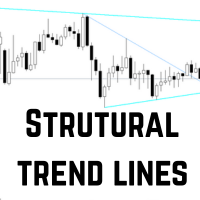
STRUCTURAL TREND LINES - MT5 Indicator
Simple indicator that automatically draws trend lines based on market structure.
Features:
- 3 degrees of structure detection (short, medium, long term)
- Configurable swing strength for each degree
- Single color per degree for clean visualization
- Adjustable number of lines per degree
- Customizable colors and line widths
How it works:
The indicator identifies swing highs and lows based on the strength parameter,
then connects these points to create t
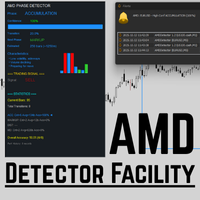
AMD Detector Facility MT5 Description Leading indicator that helps detect market structure phases — Accumulation, Markup, Distribution, Markdown — in real time. Designed for traders using Wyckoff or Smart Money Concepts methods. Features Automatic phase detection based on price dynamics and volume Multi-timeframe confirmation for higher accuracy Smart UI overlay with clear labels and tooltips Real-time alerts when a new phase starts Performance tracker (success rate & average move) Optimized
VolumeRejectionSignals v5.0 高级成交量分析指标 总体描述
VolumeRejectionSignals v5.0 是一款先进的技术指标,旨在通过对成交量拒绝的深入分析,精确识别价格的重要波动。
通过结合订单流动态与市场结构,它能够检测出买方或卖方压力减弱的区域,从而提前预判趋势反转或趋势加速。 智能评分系统
该指标基于加权评分系统,对每个信号的质量进行 0 至 100% 的评估。
信号被划分为三类: 标准型: 50–65% 强力型: 65–80% 高级型: 80% 及以上 这种分级方式有助于评估信号的可靠性,并根据信心水平调整交易策略。 过滤与自定义
VolumeRejectionSignals v5.0 提供多种可配置过滤器,可根据市场环境优化信号检测: 趋势过滤(上升、下降或中性) 波动率过滤(避免过于平静或过度波动的市场) 交易时段过滤(伦敦、纽约、亚洲) 成交量强度过滤(筛选最显著的拒绝信号) 内置多周期分析功能,可跨多个时间周期验证信号,提高分析的稳健性与一致性。 警报与可视化界面
信号实时生成,并配备完全可自定义的警报(声音、视觉或推送通

机构流动性压缩指标 该指标通过布林带宽度、成交量和平均点差的标准化测量,实时检测流动性收紧情况,以识别价格突破前的压缩阶段。 显示方式:
专业独立窗口,包含“Compression Score”柱状图与“Threshold”阈值线。 主要特点 早期检测: 在价格波动前识别压缩区域。 多因素测量: 结合布林带宽度、成交量与平均点差的标准化数据。 实时更新: 每个行情跳动(tick)即时刷新。 清晰显示: “Compression”柱状图与虚线“Threshold”参考线。 兼容性: 适用于 MT4 与 MT5 平台。 使用方法 将指标添加至目标品种图表。 根据波动性与交易时段调整阈值与权重。 解读: 当分数较高时,表示出现流动性压缩,需关注潜在突破。 参数说明 BB_Period / BB_Dev: 计算布林带宽度。 Norm_Period: 近期波动性标准化周期。 Vol_Period: 成交量标准化周期(按 tick 计)。 Spr_Period: 平均点差标准化周期(MT5 使用历史数据,MT4 使用即时代理)。 Weight_Width / Weight_Volume / We
Mean Reversion Probability – 统计性均值回归指标 简短说明
机构级指标,根据历史超延伸分析,计算价格回归到200周期均线(MA200)的统计概率。以量化精度识别市场疲劳区域。 主要功能
高级统计分析 – 基于500+历史延伸数据计算真实概率
概率评分 (0–99%) – 精确量化回归均线的可能性
疲劳检测 – 测量超延伸的持续时间与强度
多资产标准化 – 自动适配外汇、指数、黄金、加密货币、差价合约
智能警报 – 罕见但高度可靠的信号(概率 >80%,持续时间 >15 根K线)
专业级界面 – 清晰、结构化的机构风格设计 方法学
指标实时分析: 价格与MA200的标准化距离(以ATR计) 自上次回归以来的延伸时长 达到最大延伸的时间 与历史平均值比较 概率计算: 距离评分(最高60%):当前值与历史比值 持续评分(最高40%):延伸时间与平均时间比 疲劳加成(+15%):当持续时间 >1.5×最大延伸时间 极端加成(+10%):当距离 >2.5 ATR 推荐用法
机构级策略: 等待概率 >70% 且 距离 >1.5 ATR 通过较长延伸时间确认(绿色
WBP 图表信号 – 多时间框架买卖压力指标 描述:
WBP 图表信号是一款高级指标,通过分析成交量、点差和价格行为来衡量市场压力。适用于寻求精确信号和多时间框架确认的交易者,具有机构级分析风格。 主要功能: 加权买入压力 (WBP): 专有算法结合 VWAP、MA200、成交量强度、流动性因素和动量 多时间框架分析: 自动高时间框架确认,提高信号可靠性 实时多品种扫描: 同时监控6大货币对 精准信号过滤: 7种确认过滤器,包括背离、成交量、趋势及高时间框架确认 专业仪表盘: 实时显示 WBP 值、信号及高时间框架分析 机构级计算: 成交量对数刻度、VWAP 权重及信念因子 信号系统: 买入: 强买 > 75,适中买 > 65 卖出: 强卖 < 25,适中卖 < 35 指标窗口显示箭头;可自定义声音提醒 技术规格: 单独指标窗口,5个缓冲区 可调阈值与确认参数 适用于所有时间框架和品种 无重绘 – 信号在K线收盘确认 优化性能 参数: VWAP 周期 20,MA 趋势 200,EMA 平滑 5,确认柱 2,多重过滤器 适用场景: 日内交易、波段交易、机构成交量分析、多品种市场压力监控

ARB 是一种指标,用于通过自适应 ATR 通道系统和精确的多因素评分模型(0–100)识别高概率的突破机会。
它结合了波动率、成交量、动能以及多周期趋势分析,提供经过筛选、直观且可实时操作的交易信号。 运行原理 该指标基于 Adaptive Range Breakout(自适应区间突破) 的概念,这是一种现代化的突破交易方法,可根据市场波动率(ATR)和价格的动态结构自动调整阈值。
每个信号都会通过加权评分来评估其质量和可靠性,然后再确认。 评分系统组成(0–100) 每个因素都会对总体评分作出贡献,以评估信号强度: 因素 权重 描述 通道中的位置 40% 测量价格在当前 ATR 区域中的位置 接近突破程度 25% 评估价格距离关键阈值的远近 成交量确认 15% 将当前成交量与移动平均值进行比较 高级别趋势(HTF) 15% 检查是否与更高级别周期的趋势一致 近期动能 5% 融入短期价格运动的动量变化

MFCS(多因子通道评分)是一种高级指标,通过加权评分系统和自适应波动通道,提供清晰的市场动态读数。 主要特点: 自适应ATR通道,实时调整波动率 多因子评分(位置、成交量、动能、高周期趋势、波动性) 根据信号强度(0–100)分类 完整仪表板显示评分、趋势和关键指标 多周期过滤以对齐市场方向 可选成交量验证以增强可靠性 主要参数:
MFCS(多因子通道评分)是一种高级指标,通过加权评分系统和自适应波动通道,提供清晰的市场动态读数。
可调ATR周期、倍数和窗口 可配置评分权重 成交量基于移动平均过滤 可自定义仪表板并集成警报 用途:
专为寻求市场结构定量评估的交易者和技术分析师设计,帮助识别高潜力区域、衡量走势强度并优化进场时机。
该系统融合精确性与灵活性,为专业交易决策提供强大支持与数据驱动的洞察力。

Dynamic FVG Detector – MetaTrader 4 公平价值缺口指标 Dynamic FVG Detector 可在图表上自动检测并显示公平价值缺口(FVG)。它识别三根K线形成的价格低效区域,并在价格回填时实时更新这些区域。 主要功能 自动识别多头与空头 FVG 可自定义点差阈值 基于三根K线的最小结构 区域创建时立即进行历史验证 动态回填监控 根据价格行为持续调整 区域大小根据回填百分比自动缩小 区域完全填补后自动移除 实时更新 提供两种模式: 标准模式:在新K线形成时更新 实时模式:每个tick检测和更新,优化为监控最近10根K线 可视化显示 绿色(多头)、红色(空头)、灰色(已填补)矩形 区域自动向当前时间延伸 可调节透明度及已填补区域的显示 性能优化 可设置历史扫描深度 可限制最大跟踪区域数量 自动清理图表对象 防止重复检测 适用于所有时间周期 使用场景 适用于识别价格反应区域、优化入场点、设置止损与目标,以及分析市场结构。

Confluence+ 是一款多因子指标,通过结合趋势、动能和成交量来识别交易信号。依靠其动态共振系统,只有在多项技术条件同时满足时才会生成信号,从而有效减少假信号。 主要功能: 自适应趋势检测(动态均线 + ATR) 多周期确认(M15 至 D1) 高级动能过滤(RSI、随机指标、背离) 成交量与波动率分析(自动比率) 实时共振评分(0–100%) 可调参数:严格度、MTF、提醒 全彩信息面板 内置提醒:弹窗、声音、手机推送 Confluence+ 可自动适应市场环境,在外汇、指数和 XAUUSD 上无需频繁优化即可高效运行。适合 M15 日内交易和 H1 波段交易。 技术特点: 无重绘(信号在K线收盘时确认) CPU 占用 <5%,只对最近K线重新计算 2 个 Buy/Sell 箭头缓冲区 全面参数设置:趋势、动能、成交量、MTF、提醒
Volatility Matrix – 会话波动率分析器 Volatility Matrix 分析当前市场波动率,并与历史会话进行比较,以检测异常并预测突破。该指标会将当前波动率与同一小时、同一星期几的 200+ 历史会话进行比较,并计算 Z-Score 来识别波动率是否偏离正常范围。 功能特点 实时 Z-Score 监控与显示 历史会话匹配(相同小时/星期几) 动态价格区间(±1σ 和 ±2σ 标准差) 突破概率预警(5 分钟冷却时间) 专业可视化面板显示市场状态 通用市场兼容性(外汇、贵金属、指数) 技术规格 历史周期:200 个会话(可配置 50–500) 偏差阈值:2.0 标准差(可配置 1.0–3.0) 性能优化:每根 K 线仅计算一次 自动点值检测(根据小数位数) 面板尺寸:180×100 像素 四角定位,可调偏移 使用方法 指标会显示一个紧凑面板,包括: 当前 Z-Score 值(18px 大号字体) 市场状态(正常、波动升高、高波动、突破警报) 基于波动等级的颜色标识 当 Z-Score 超过 2.0 时触发警报,表示突破概率较高。 如果找到的历史会话少于 10 个,指
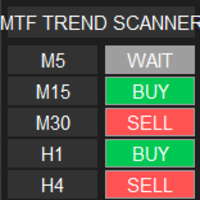
MTF Trend Scanner 是一款专业的多周期趋势分析工具,可帮助您快速识别多个周期之间的趋势一致性。 该指标提供一个紧凑的仪表盘,同时显示 M5、M15、M30、H1 和 H4 的实时趋势状态。无需切换图表——所有信息都集中在一个面板中。 工作原理 指标结合了两种经过验证的技术分析方法: 均线交叉(快速 EMA vs 慢速 EMA) RSI 筛选(高于/低于 50 水平) 信号逻辑: 买入 :快速 MA > 慢速 MA 且 RSI > 50 卖出 :快速 MA < 慢速 MA 且 RSI < 50 等待 :条件混合(趋势不明确) 主要功能 实时更新(500ms 刷新 + 每个 tick 更新) 现代、简洁的深色界面 颜色编码,便于快速识别 参数完全可自定义 轻量级,占用资源低 适用于任何品种和周期 无重绘,信号基于当前 K 线收盘价计算 参数设置 指标设置: 快速 MA 周期(默认:9) 慢速 MA 周期(默认:21) MA 方法(EMA/SMA) RSI 周期(默认:14) 视觉设置: 买/卖/中性颜色 背景和边框颜色 面板位置(X/Y 坐标) 面板角位置(0–3) 缩放比
技术说明 Nexus Signal System 是一款 MT4 指标,结合了 12 个技术指标来生成交易信号。该系统在确认信号前会分析多种因素的共振(趋势、动量、成交量、支撑/阻力区),与只使用单一指标的工具相比,可减少假信号的数量。 分析标准(评分 0–15 分): 图形形态识别(Pin Bar、吞没形态) 多时间框架分析(高时间框架趋势确认) ADX 市场状态(避免无趋势市场) 支撑/阻力区(自动识别波段点) 均线 20/50/200(趋势对齐) RSI 14 周期(动量指标) 相对成交量(机构确认) ATR(波动率) 功能特点: 带透明评分的信号(0–15 分) 自动检测支撑/阻力区并在图表上显示 初步信号(当前K线)与确认信号(已收盘K线) 止损和止盈通过 ATR 计算 实时市场信息面板 8 种颜色主题可供视觉定制 56 个可配置参数,可适应您的交易风格 使用方法: 安装: 在 MetaEditor 编译并加载到图表 关键参数: Min_Signal_Score :设置最低信号质量阈值(默认 6.5/15) MTF_Timeframe :确认用时间框架(默认 H4) Colo

高级市场微结构分析指标 该指标在微观层面分析价格行为,以在大行情出现前检测隐藏的不平衡。与只关注价格的传统指标不同, StructureFlow 同时分析三个关键维度: 核心分析 K线微结构 上下影线与实体比例分析 实体在区间中的位置 扩张/收缩检测 内部波动率异常 吞没形态识别 市场节奏 价格速度测量 微观运动加速度 节奏对比检测(领先信号) 反转概率 形态聚类算法 历史相似度匹配 加速/拒绝概率 颜色编码系统 区间 颜色 含义 +50 至 +100 酸橙色 强烈多头不平衡 +20 至 +50 中海绿色 中等多头 +5 至 +20 深海绿色 弱多头 -5 至 +5 灰色 中性 -20 至 -5 印度红 弱空头 -50 至 -20 橙红色 中等空头 -100 至 -50 红色 强烈空头不平衡 背景区域: 深绿色区域:极强多头区 深红色区域:极强空头区 信号线: 金色 — 平滑趋势方向 功能 多周期确认(高周期对齐) 背离检测并带图表箭头 3 种视觉样式:Classic / Gradient / Filled 可调节柱体高度放大器 成交量过滤提升信号质量 提示系统(弹窗 / 声音 / 推
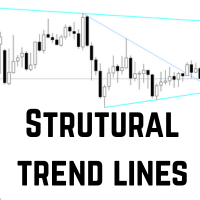
STRUCTURAL TREND LINES - MT4 Indicator
Simple indicator that automatically draws trend lines based on market structure.
Features:
- 3 degrees of structure detection (short, medium, long term)
- Configurable swing strength for each degree
- Single color per degree for clean visualization
- Adjustable number of lines per degree
- Customizable colors and line widths
How it works:
The indicator identifies swing highs and lows based on the strength parameter,
then connects these points to create t
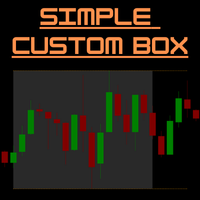
SimpleCustomBox – MT5 自定义交易区间及高低线指标 概述:
SimpleCustomBox 是一款功能强大且易于使用的 MT5 指标,可以在图表上清晰标注指定的交易时间段。自定义时间范围,直观显示区间的最高价和最低价,让你轻松做出更明智的交易决策。非常适合日内交易者、剥头皮交易者以及依赖日内价格模式的交易者。 主要功能: 自定义交易区间: 在图表上高亮显示任意时间段(例如 02:00 – 06:00)。 动态交易区间框: 自动每日更新,支持显示多天历史数据,便于回测和分析。 高低线绘制: 根据区间绘制顶部和底部价格线,可延伸至用户自定义的时间(例如延伸至 14:00)。 可视化自定义: 可调整区间框颜色、线条颜色、宽度及样式(实线、虚线、点线等)。 自动更新: 区间框和高低线实时更新,无需手动调整。 图表清理方便: 移除指标时,所有区间框和高低线将自动删除。 优势: 快速识别交易区间和波动区域。 通过精确的视觉标记提升日内交易策略的效率。 完全自定义图表显示,简化分析过程。 秒级显示多天历史区间,节省时间。 参数设置概览: 参数 功能说明 StartHour ,

AMD 自适应移动平均线 (AAMA)
AAMA 是一款适用于 MetaTrader 4 的自适应移动平均指标,可根据市场状况自动调整其反应速度。 主要功能: 基于 Kaufman 效率比的自适应移动平均线——在趋势行情中快速反应,在震荡行情中过滤噪音 自动识别四个 AMD 市场阶段:积累期 (Accumulation)、上涨期 (Markup)、分配期 (Distribution)、下跌期 (Markdown) 通过 ATR 实现波动性自适应——根据当前市场状况调整灵敏度 实时信息面板显示检测到的市场阶段、置信度和适应速度 多指标集成:结合 ADX、RSI 和 MACD 精确识别市场阶段 快速/缓慢参考区域,用于可视化自适应行为 使用方法:
指标会根据市场自动调整适应速度——在强趋势时反应更快,在盘整阶段更慢。可视化面板帮助理解当前的市场阶段。所有参数(周期、颜色、灵敏度)都可根据您的交易风格自由设置。
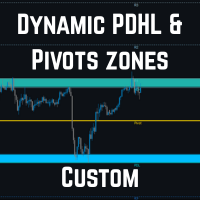
AutoPivot - 自动枢轴点指标 MT4 专业级指标,用于自动计算并显示每日、每周或每月的关键枢轴点(PP、R1、R2、R3、S1、S2、S3),同时标注前一交易日的高点与低点(PDH/PDL),帮助交易者快速识别潜在的支撑与阻力区域。 主要功能: 智能时间框架检测 :根据图表周期(H4、D1、W1)自动调整计算方式,确保在不同级别下均显示精准枢轴水平。 前日高低点标识 :自动绘制 PDH/PDL,并在图表中清晰显示与当前价格的相对位置。 支撑/阻力区域显示 :在 PDH/PDL 与相邻枢轴线之间生成半透明区域,帮助识别市场可能的反转带或突破区。 多主题外观 :提供 8 种预设配色方案(经典、暗色、亮色、蓝调、专业等),支持完全自定义颜色、线型与透明度。 价格与标签显示 :可选显示每条枢轴线对应的价格与紧凑型标签,不干扰图表视图。 自动刷新机制 :支持实时自动更新与手动刷新模式,确保在市场波动时数据始终最新。 ️ 轻量高效 :优化性能,不影响图表流畅度,可在多图表、多时间框架下同时运行。 AutoPivot 是日内交易者、波段交易者及技术分析
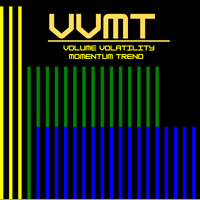
VVMT 指标:您的全方位市场仪表盘 一个功能强大的全能工具,旨在为您提供即时而深入的市场状况解读。再也不需要在多个复杂指标之间切换 —— VVMT 为您提供一个清晰、集中化的市场视图。 VVMT 指标实时分析市场的 四大核心支柱 ,并以直观的视觉方式展示,让您能够一眼“看见”市场的动态。 VVMT 的四大支柱 成交量 (V): 衡量每一次价格变动背后的力度与信心。
波动率 (V): 识别高或低活动时期,以评估风险与机会。
动量 (M): 评估价格变化的速度与加速度,用于预测反转或趋势延续。
趋势 (T): 确定主要趋势的方向与强度,从而与市场保持一致的交易。 核心功能 四合一分析: 四个强大的指标融合在一个整洁的窗口中,为您节省时间与图表空间。
即时视觉反馈: 颜色立即显示条件是强(热)还是弱(冷),帮助您更快地做出决策。
完全可自定义: 可根据您的交易风格调整,包括预设主题(Base、Thermal、Ocean)以及参数设置(平滑周期、灵敏度等)。 理解 VVMT 的颜色编码 冷色系(如深蓝、蓝色、紫色)
含义:活动非常低或较低。
市场背景:市场平静,参与者较少,或走势缺乏信心。

Institutional Flow Indicator A smart volume-based tool that detects institutional activity zones through direct order flow patterns.
It reveals where large institutions operate. An advanced volume indicator that filters out noise to identify probable institutional patterns. Key Features Smart cluster detection Automatic identification Signal classification: Violet / Yellow – Institutional Zone – Strong, sustained institutional activity Red / Green – Strong Signal – Significant buying/selling pre
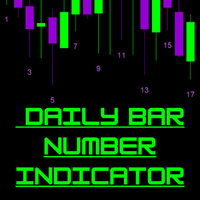
介绍:这是一个方便交易者跟踪每日K线编号的MT5指标。 MT5每日K线编号指标 每日K线编号指标可在MetaTrader 5图表上直接显示每根K线的顺序编号。它帮助交易者轻松跟踪日内K线数量并分析交易时段模式。 主要功能: 实时在每根K线下方显示编号。 可自定义颜色、字体和大小。 可选择隐藏偶数编号以获得更清晰的视图。 支持自定义交易时段(例如08:00–18:00)。 可调显示天数。 轻量且兼容所有时间周期。 注意事项:
为了在低时间周期上获得最佳性能,请限制可见天数。长时间运行后指标可能会略有偏移 —— 只需刷新图表即可修复。 使用方法:
跟踪K线序列、研究日内行为,或识别外汇、指数、商品和加密货币的重复交易时段模式。
MT5
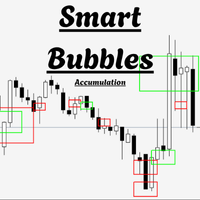
气泡指标 —— 价格减速 + 成交量激增检测 一个简单直观的可视化工具,当价格突然放缓并伴随成交量激增时,会在图表上显示彩色方块。
(包含填充功能与同心气泡效果)
它能帮助交易者更清晰地观察市场节奏,发现潜在的关键转折点。 指标功能: 识别市场在启动前“犹豫”的时刻 显示成交量放大但价格波动不大的区域 帮助提前发现潜在的突破信号 工作原理: 分析比当前图表更小的时间周期 检测异常小的K线(价格放缓) 检测异常高的成交量(成交量激增) 显示绿色(看涨)或红色(看跌)方块 主要设置: 价格敏感度: 数值越低,越敏感 成交量倍数: 数值越高,越严格 气泡大小: 调整显示效果 实用价值: 简单直观 无需复杂计算 发现有趣的市场结构与节奏 完全可自定义 非常适合用于区间交易、突破判断或理解市场动态。

MDM indicator is the IMM (Integrated Market Momentum) line, which oscillates between 0 and 1. Here's how to interpret it: General Interpretation of the IMM Line : The indicator calculates this final value by combining momentum, trend, volume, aggressiveness, and price strength scores . Generally, readings above 0.50 suggest a strong bullish zone, while readings below 0.5 0 suggest a strong bearish zone. The area between 0.45 and 0.55 is often considered neutral or consolidating. Generating Tradi

气泡指标 —— 价格减速 + 成交量激增检测 一个简单直观的可视化工具,当价格突然放缓并伴随成交量激增时,会在图表上显示彩色方块。
(包含填充功能与同心气泡效果)
它能帮助交易者更清晰地观察市场节奏,发现潜在的关键转折点。 指标功能: 识别市场在启动前“犹豫”的时刻 显示成交量放大但价格波动不大的区域 帮助提前发现潜在的突破信号 工作原理: 分析比当前图表更小的时间周期 检测异常小的K线(价格放缓) 检测异常高的成交量(成交量激增) 显示绿色(看涨)或红色(看跌)方块 主要设置: 价格敏感度: 数值越低,越敏感 成交量倍数: 数值越高,越严格 气泡大小: 调整显示效果 实用价值: 简单直观 无需复杂计算 发现有趣的市场结构与节奏 完全可自定义 非常适合用于区间交易、突破判断或理解市场动态。
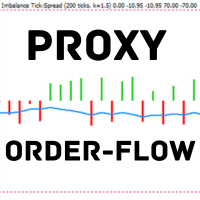
Proxy Order Flow – Imbalance Tick-Spread
基于点差不平衡的指标。 TF:
适用于所有时间周期(M1 到 D1)。 交易品种:
兼容外汇、指数、黄金和差价合约(自动适配 JPY、黄金和 CFD 品种)。 参数: TickWindow (200) – 观察的 tick 窗口 SpreadWeight (1.5) – 点差权重 NormalizationPeriod (20) – 标准化周期(z-score) Overbought / Oversold (±3.0) – 超买/超卖阈值 AlertCooldown (300s) – 警报冷却时间 结论:
Proxy Order Flow – Imbalance Tick-Spread v2.4 通过分析 OHLC 变化和点差,识别买卖压力,清晰显示市场流向与不平衡区域。

SweepMaster – LSSD & APCE 流动性扫荡,止损猎杀检测器与自适应模式置信引擎 集成三种交易模式(剥头皮、标准、波段)、APCE置信引擎、成交量吸收分析以及自适应支撑/阻力区的流动性扫荡检测指标。设计用于实时订单流分析。 推荐时间周期:H1 SweepMaster 是一个技术分析指标,用于通过价格、成交量和市场结构的综合分析,实时识别流动性扫荡、止损猎杀以及积累/分配阶段。 主要功能 交易模式 Scalping Mode:快速检测,阈值较轻 Standard Mode:平衡且可自定义参数 Swing Mode:更严格的条件用于高时间周期信号 流动性扫荡检测 识别看涨和看跌的流动性扫荡 带成交量确认的蜡烛影线分析 区分有效突破和回拒 基于时间周期的自适应支撑和阻力水平 APCE 引擎(自适应模式置信引擎) 置信评分 0–100% 检测双顶和双底 识别吞没形态 突破并回测构型验证 当前蜡烛实时计算 成交量吸收分析 基于 8 项标准的评分系统(0–100%) 成交量强度与区间压缩分析 蜡烛影线拒绝与价格平衡检测 成交量高潮识别 实时可视化指标 自适应支撑与阻力区 基于 A