Orderflow Absorption MT5
- 指标
-
Chi Sum Poon
 This is Gary Poon
I will first study of trading on demo account then to real account.
This is my only account on MQL5.com, I will not create another one for now.
If there are any queries or concerns, please refer to the broker details from my signals.
Thank you. - 版本: 1.3
- 更新: 17 十二月 2025
- 激活: 5
OrderFlow Absorption – 專業級MT5買賣差與吸收訊號指標
釋放真正訂單流分析的力量,OrderFlow Absorption 是MetaTrader 5上最強大的買賣差(Delta)直方圖與吸收訊號指標。專為想看清每一個價格波動背後真相的交易者設計,這個工具揭示了隱藏的買賣壓力與推動市場的吸收事件。
功能特色
- 買賣差直方圖視覺化: 以清晰的色彩直方圖即時顯示買方與賣方壓力。
- 吸收訊號偵測: 先進邏輯自動辨識多空吸收事件,及早預警潛在反轉。
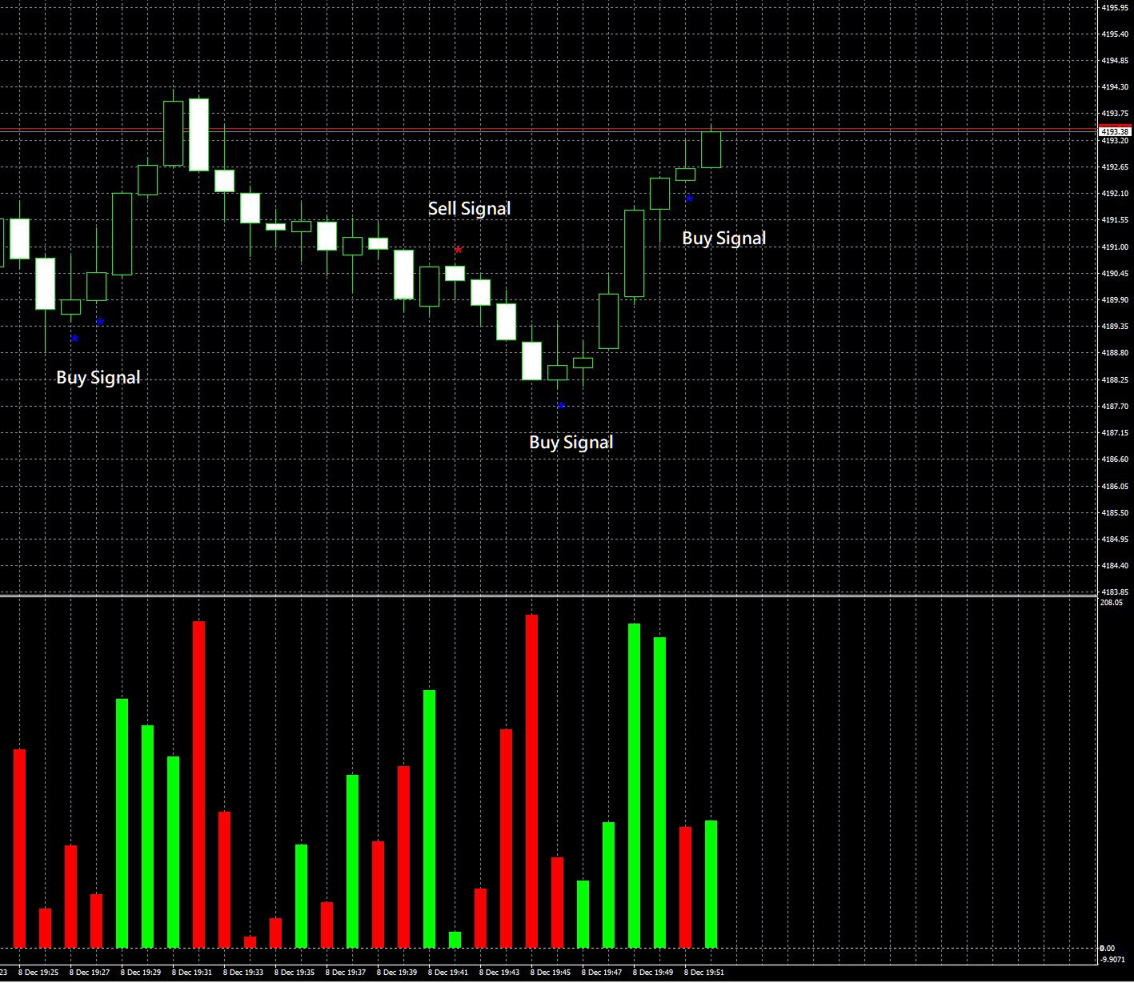
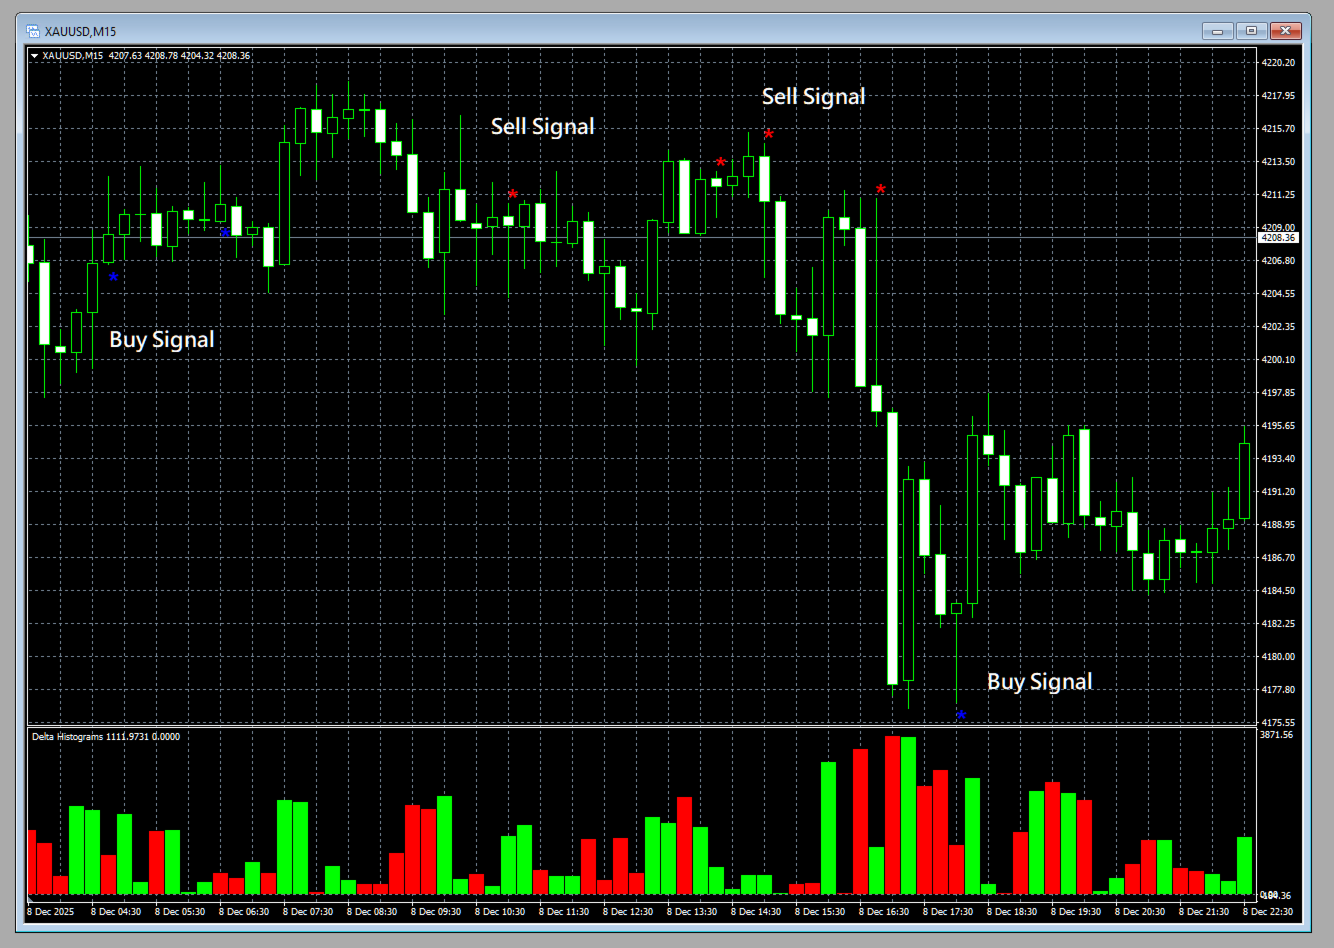
- 圖表標記: 吸收訊號直接標示於主圖表,方便視覺辨識。
- 彈出式警報: 新吸收訊號出現時即時通知。
- 自訂門檻: 過濾弱訊號,專注高勝率機會。
- 資源管理: 高效運算,適用於大型圖表也能流暢運行。
- 全品種兼容: 適用於任何商品與週期,包括外匯、指數、商品等。
- 簡易整合: 參數簡單,快速上手與調整。
OrderFlow Absorption 的邏輯說明
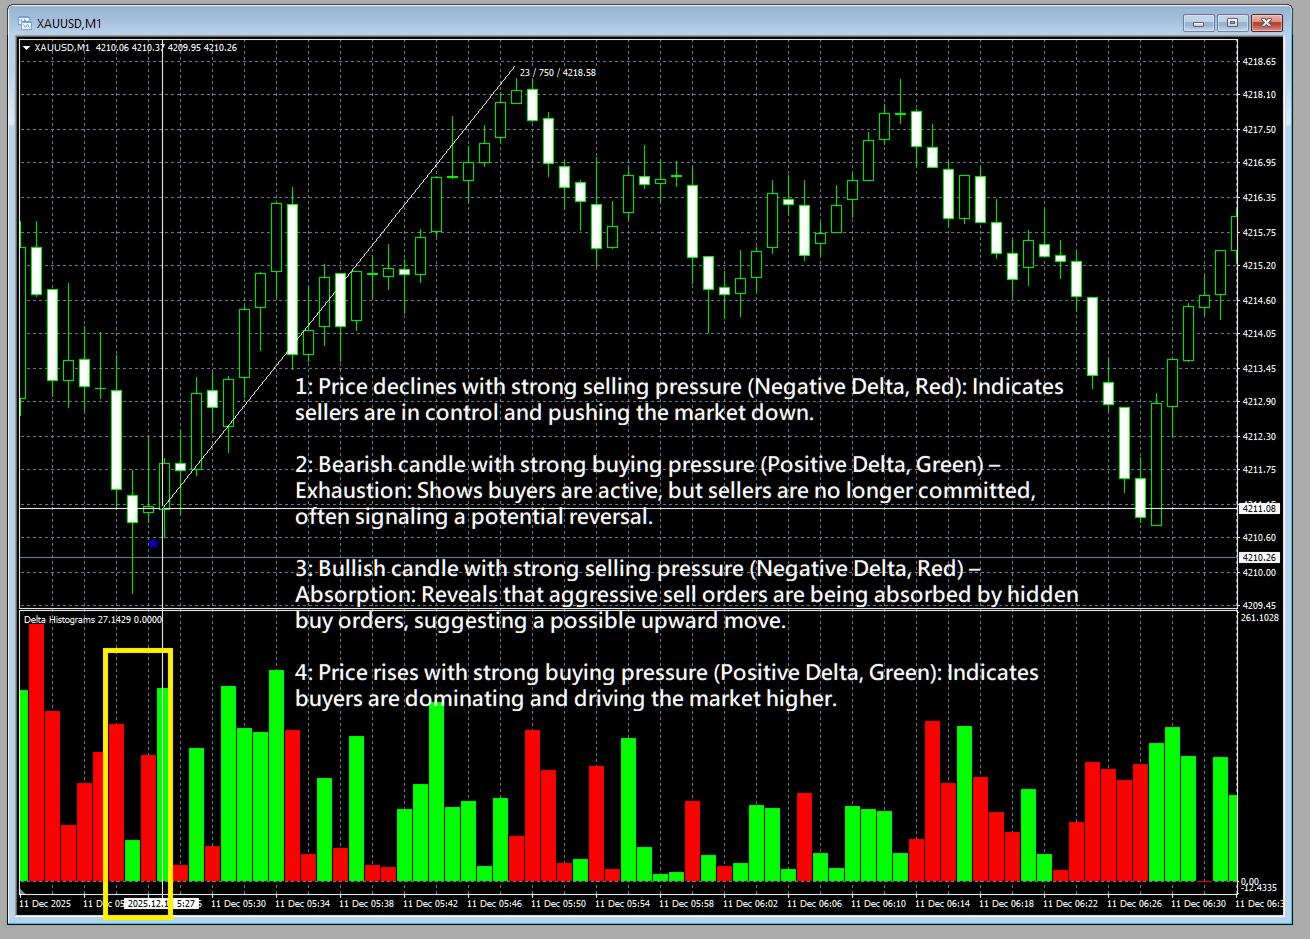
OrderFlow Absorption 採用專利演算法,能在沒有完整Tick數據的情況下,估算每根K棒的買賣壓力(Delta)。它分析成交量、價格行為、K棒結構與影線長度,偵測隱藏的吸收事件——即強勢買賣單被大量對手單吸收的時刻,這通常預示著反轉或強勢行情。
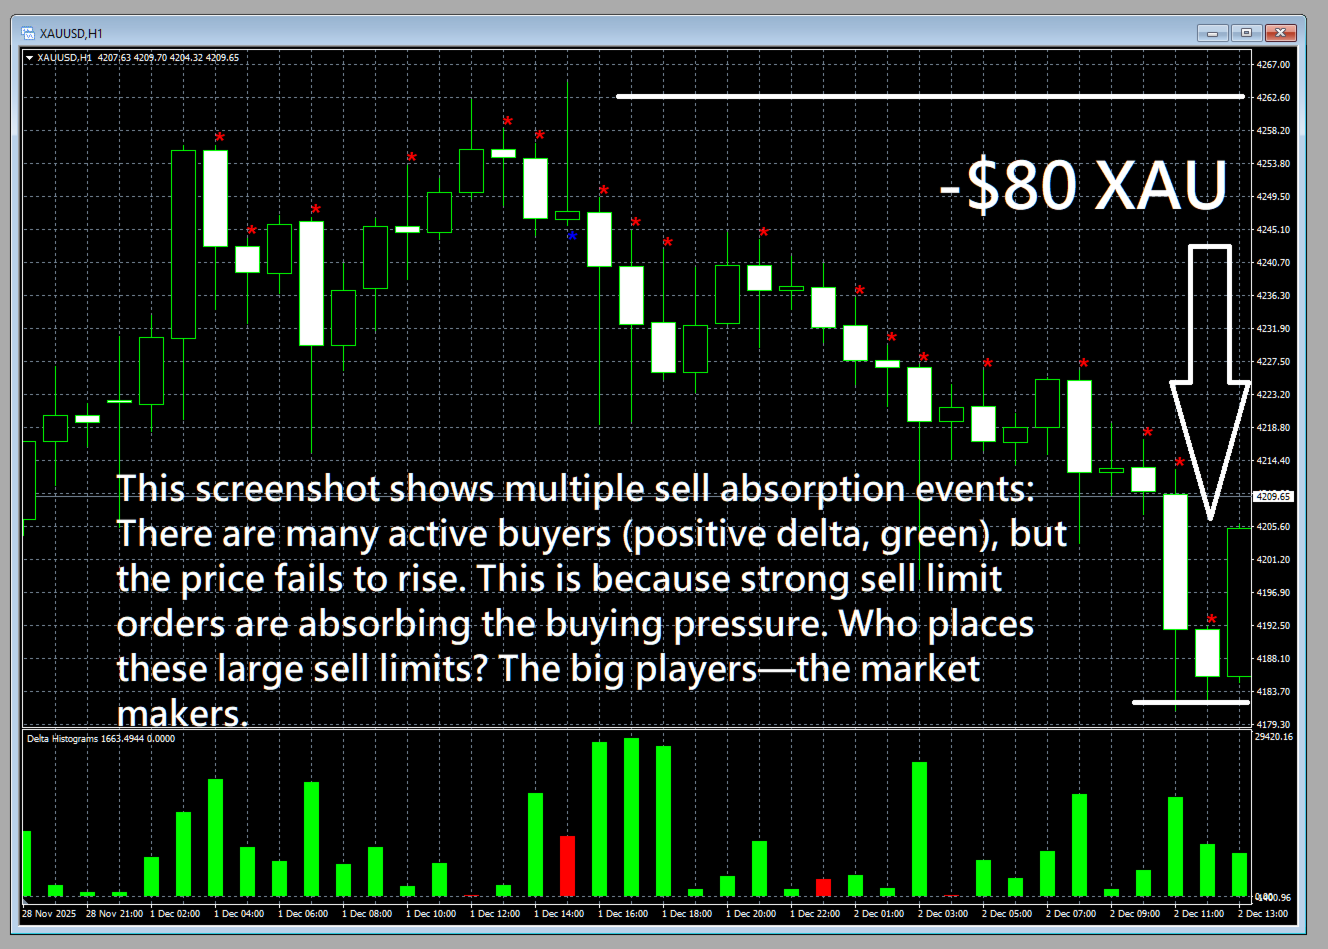
- 空方吸收: 當出現強烈買壓(正Delta)但K棒收紅,代表賣方吸收了買單。
- 多方吸收: 當出現強烈賣壓(負Delta)但K棒收綠,代表買方吸收了賣單。
這些訊號會標示於圖表,並可觸發即時警報,讓你不錯過任何關鍵市場時刻。
使用方法
- 掛載指標: 將OrderFlow Absorption加到任意圖表與週期。
- 調整參數: 設定你偏好的Delta門檻與計算K棒數量。
- 觀察直方圖: 綠色柱代表買壓,紅色柱代表賣壓。
- 尋找吸收訊號: 圖表上的「*」標記即為吸收事件,彈窗警報即時提醒。
- 聰明交易: 利用吸收訊號抓反轉、確認進場或避開假突破。
立即體驗——下載試用版!
親自體驗OrderFlow Absorption的強大功能。立即下載免費試用版,見證它如何改變你的交易。別錯過隱藏的市場機會——現在就把OrderFlow Absorption加入你的交易武器庫!

Simply amazing! It help me with easiest ways to understand the behavior of the movement of big player!