Ma Speedometer Dashboard
- 指标
- 版本: 1.0
- 激活: 5

测试演示版没有任何意义。你不会通过查看闪烁的数字了解任何信息。这是一个仪表盘。请尝试理解其理念,接下来我会帮助你完成所有内容。
符号必须用逗号(,)分隔,并按照你经纪商的显示格式输入参数,以确保它们能在仪表盘中识别。这些符号将被用于指标分析。
只需点击一次,即可直接从仪表盘打开任何货币对和任何时间周期。
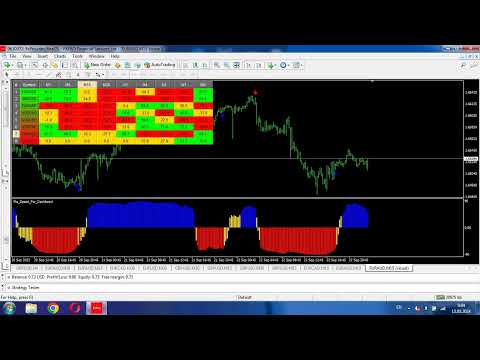
MA Speedometer Dashboard 是一款功能强大的MetaTrader 4 (MT4) 指标,旨在通过动态市场分析增强交易策略。它提供强大的功能,用于识别市场趋势、在横盘市场中交易以及退出平淡市场条件,这一切基于移动平均线的角度。作为特别赠品,客户还会获得一款特别版本的MA Speedometer指标,这是 MA Speedometer Dashboard 的基础。
主要特点:
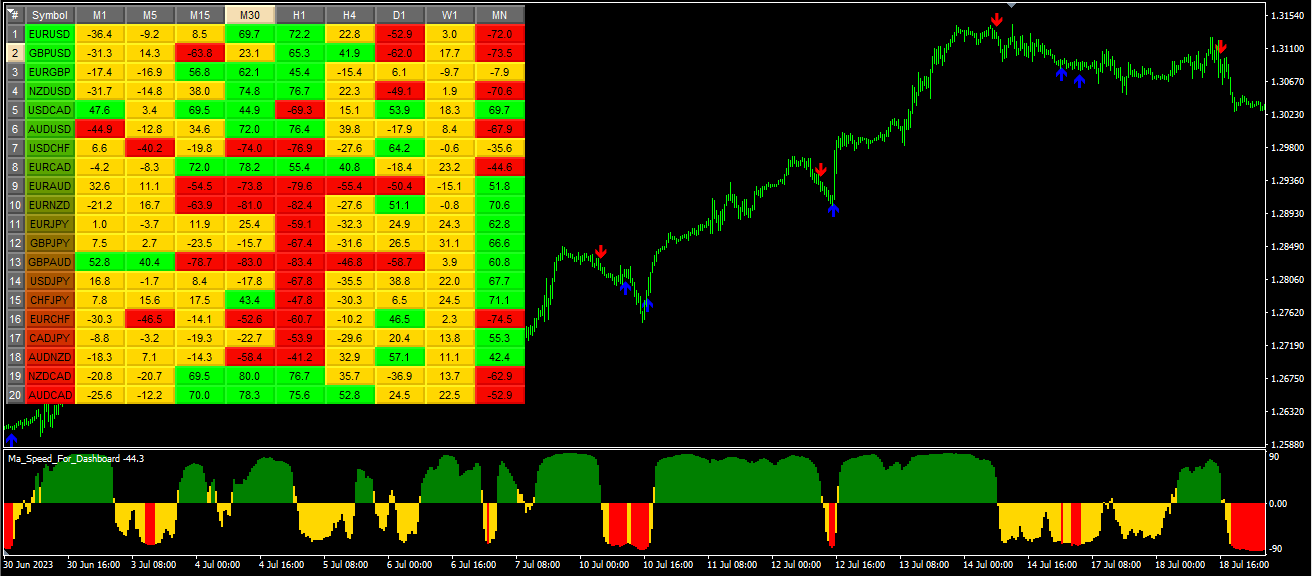
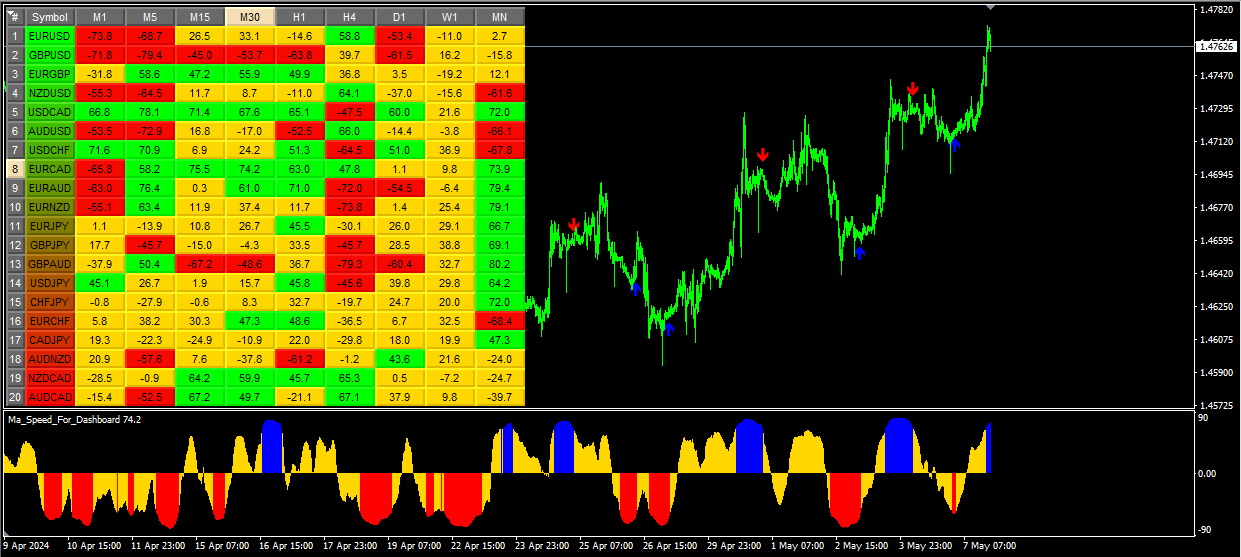
综合趋势分析:仪表盘使用移动平均线(MA)的角度来检测潜在的市场趋势。交易者可以通过颜色编码信号轻松发现强劲上升或下降趋势的开始:
- 绿色:表示强劲上升趋势的开始,提供入场机会。
- 红色:表示强劲下降趋势的开始,也提供了入场机会。
- 黄色:表示横盘或平淡市场,提示潜在的退出点。
多时间框架监控:仪表盘支持从M1到MN的多个时间框架,允许交易者在不同层面分析市场状况。这一功能适用于多种交易风格,包括日内交易和长期投资。
互动式仪表盘:互动界面允许交易者在不同货币对和时间框架之间快速切换。点击仪表盘,MT4将自动打开所选货币对和时间框架的图表,提升了使用便利性和效率。
可自定义参数:交易者可以自定义移动平均线的周期、方法和角度阈值,使仪表盘与其首选的交易策略保持一致。这一灵活性使工具能够适应不同的市场条件和交易方式。
视觉警报:仪表盘的直观设计包括视觉警报和易于读取的标签,能够增强对市场状况的认识,帮助交易者迅速做出明智的决策。
特别赠品:作为特别赠送,客户将收到一款独特的MA Speedometer指标版本。此指标是仪表盘的基础,允许进行更详细的分析。
每个输入参数的描述:
- Symbols:这是一个字符串输入参数,你可以指定用逗号分隔的符号列表,这些符号将被用于指标分析。
- StartBar:这是一个整数输入,表示计算移动平均线角度的起始柱。
- MaPeriod:这是一个整数输入,表示用于计算移动平均线的周期。
- MaMethod:这是一个枚举输入,表示用于计算移动平均线的方法,它可能包括如简单移动平均线(SMA)、指数移动平均线(EMA)等选项。
- Level_Up_M1 到 Level_Dn_MN1:这些是整数输入,表示不同时间框架(从M1到MN1)的上限和下限,用于基于移动平均线的角度确定按钮的背景颜色。
- X-Size 和 Y-Size:这些是整数输入,表示按钮的宽度和高度。
总结:MA Speedometer Dashboard 为交易者提供了一个综合的市场分析工具,适合趋势交易者和喜欢横盘市场的交易者使用。其灵活性、互动界面和可自定义参数,使其成为任何交易者工具包中的有价值补充,帮助更准确和深入地导航外汇市场的复杂性。


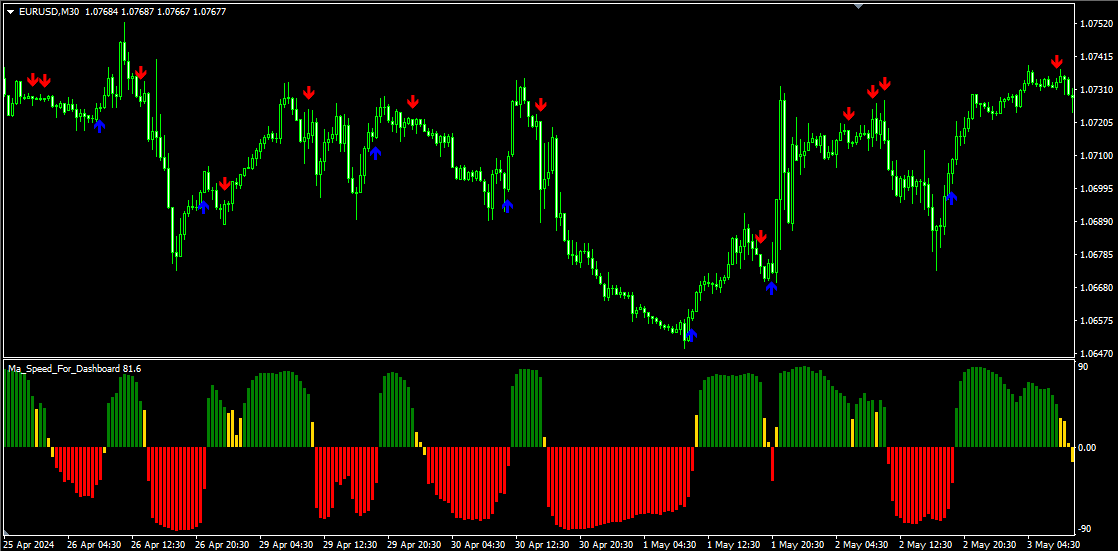

Great dashboard based on the innovative idea of MA angle changes on various instruments desired. The steeper the MA angle, the greater the momentum. Find the instruments with best momentum. Very clever idea. The bonus indicator is very helpful and gives great signals based on the same concept of MA angles, fully customizable.