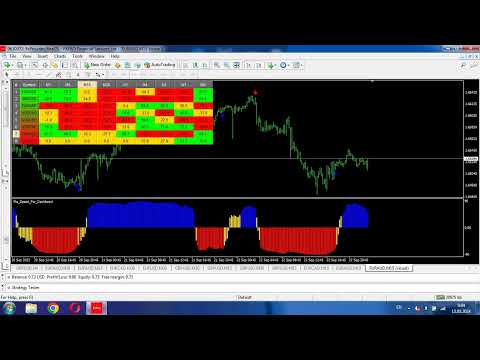
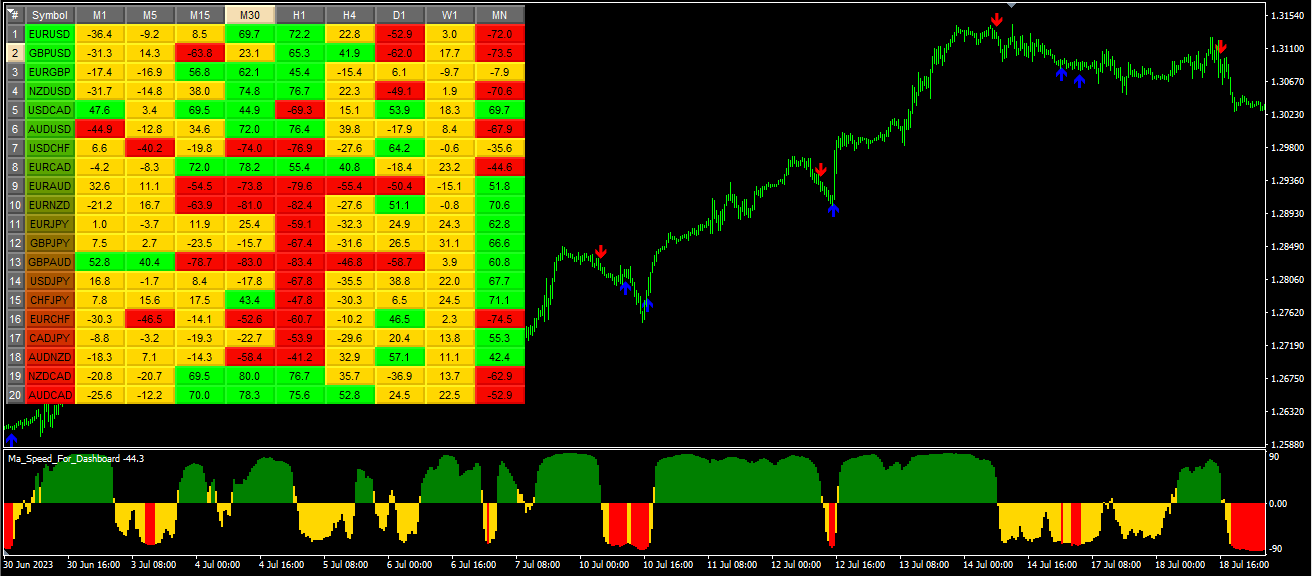
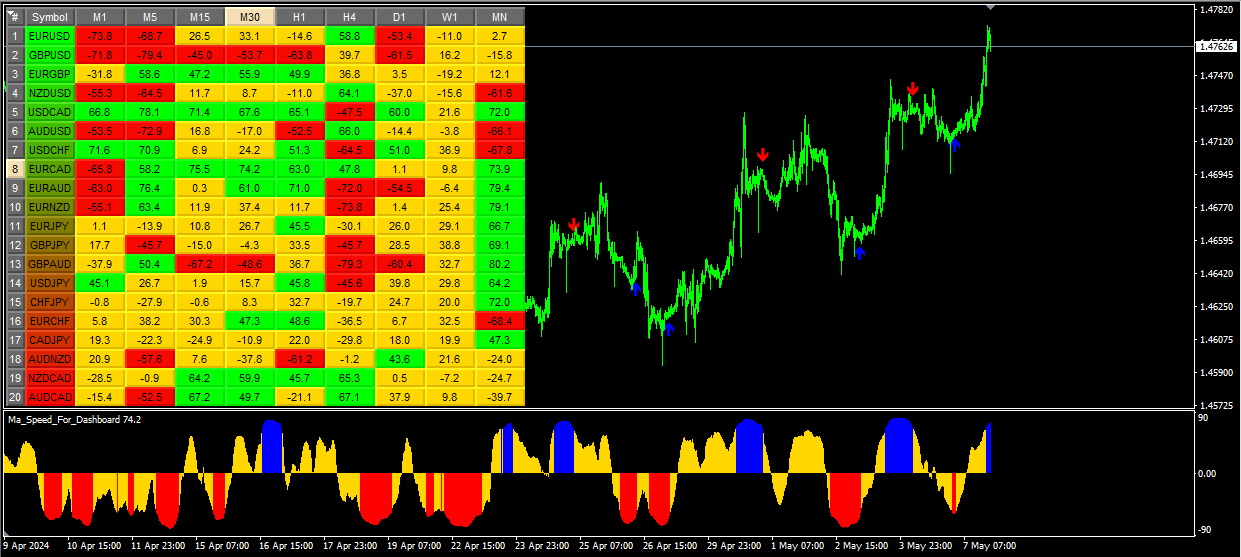
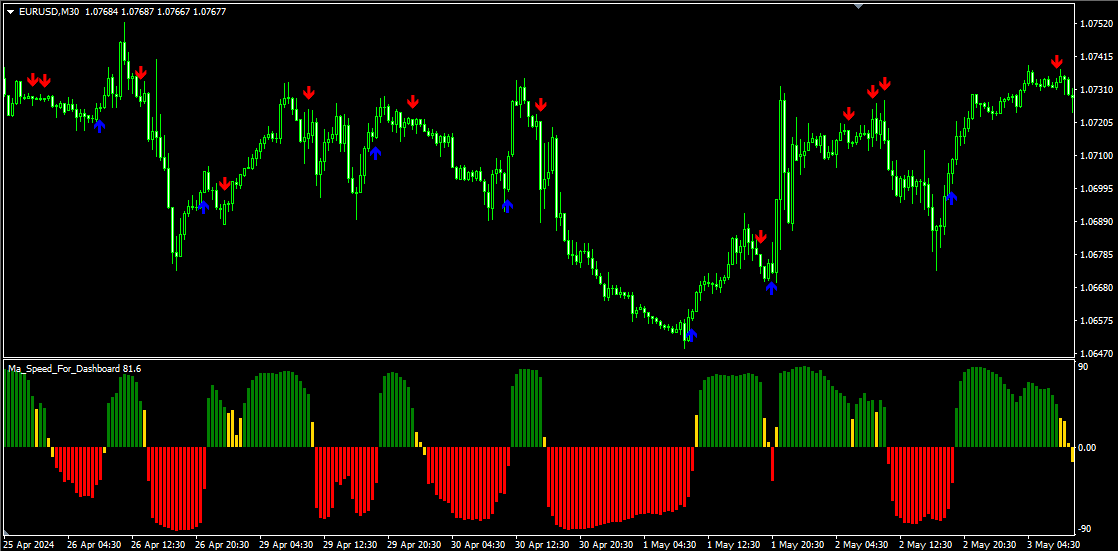
Ma Speedometer Dashboard

3.5
デモバージョンは役に立ちません。点滅する数字を見ても何も理解できません。これはダッシュボードです。コンセプトを理解しようとし、残りは私がすべてお手伝いします。

シンボルはカンマ(,)で区切り、ブローカーが表示する形式に正確に従ってパラメータに入力する必要があります。これにより、ダッシュボードで認識されるようになります。これらのシンボルはインジケーターによる分析に使用されます。

ワンクリックで、ダッシュボードから任意の通貨ペアやタイムフレームを直接開くことができます。

MA Speedometer Dashboardは、MetaTrader 4 (MT4) 向けに設計された非常に機能的なインジケーターで、動的な市場分析を通じてトレード戦略を強化します。このダッシュボードは、市場トレンドを特定し、レンジ相場で取引し、フラットな市場状況からの退出を支援する強力な機能を提供します。さらに、特別ボーナスとして、MA Speedometerインジケーターの特別バージョンが提供され、MA Speedometer Dashboardの基盤として機能します。

主な特徴:

トレンド分析:ダッシュボードは、移動平均(MA)の角度を使用して、潜在的な市場トレンドを検出します。トレーダーは、色分けされた信号を通じて、強い上昇トレンドや下降トレンドの開始を簡単に見つけることができます。
- 緑色: 強い上昇トレンドの始まりを示し、エントリーの機会を提供します。
- 赤色: 強い下降トレンドの始まりを示し、エントリーポイントを提供します。
- 黄色: フラットまたはレンジ相場を示し、退出のポイントを提案します。

マルチタイムフレーム監視:ダッシュボードは、M1からMNまでの複数のタイムフレームをサポートしており、トレーダーが詳細なレベルから広範なレベルまで市場状況を分析できます。この機能は、デイトレードや長期投資など、さまざまなトレードスタイルに対応しています。

インタラクティブダッシュボード:インタラクティブなインターフェースにより、トレーダーは異なる通貨ペアやタイムフレームを素早く切り替えることができます。ダッシュボードをクリックするだけで、MT4が選択した通貨ペアとタイムフレームのチャートを自動的に開き、使いやすさと効率性を高めます。

カスタマイズ可能なパラメータ:トレーダーは移動平均の期間、方法、角度の閾値をカスタマイズして、ダッシュボードを好みのトレード戦略に合わせることができます。この柔軟性により、ツールはさまざまな市場条件やトレードアプローチに適応できます。

視覚的なアラート:ダッシュボードの直感的なデザインには、市場の状況を示す視覚的なアラートや読みやすいラベルが含まれています。この機能により、トレーダーは状況を迅速に把握し、すばやく判断を下すことができます。

特別オファー:特別なオファーとして、クライアントにはMA Speedometerインジケーターのユニークなバージョンが提供されます。このインジケーターはダッシュボードの基盤であり、より詳細な分析を可能にします。

各入力パラメータの説明:

- Symbols: このパラメータは、カンマ(,)で区切られたシンボルのリストを指定できる文字列入力です。これらのシンボルはインジケーターによって分析に使用されます。
- StartBar: このパラメータは、移動平均角度の計算を開始するバーを表す整数入力です。
- MaPeriod: このパラメータは、移動平均を計算するために使用される期間を表す整数入力です。
- MaMethod: このパラメータは、移動平均の計算方法を表す列挙入力です。おそらく、シンプル移動平均 (SMA)、指数移動平均 (EMA) などのオプションを含むENUM_MA_METHODの値を取ることができます。
- Level_Up_M1からLevel_Dn_MN1まで: これらのパラメータは、異なるタイムフレーム(M1からMN1まで)の上限および下限を表す整数入力で、移動平均の角度に基づいてボタンの背景色を決定するために使用されます。
- X-Size と Y-Size: これらのパラメータは、それぞれボタンの幅と高さを表す整数入力です。

まとめ:MA Speedometer Dashboardは、トレンドトレーダーにもレンジ市場を好むトレーダーにも適した包括的な市場分析ツールを提供します。その柔軟性、インタラクティブなインターフェース、およびカスタマイズ可能なパラメータにより、どのトレーダーのツールキットにも価値のある追加となり、外国為替市場の複雑さをより精密に理解しながら取引を進めることができます。
レビュー 3
Ross Rodgers
158
Ross Rodgers 2024.05.11 21:24 
 

Great dashboard based on the innovative idea of MA angle changes on various instruments desired. The steeper the MA angle, the greater the momentum. Find the instruments with best momentum. Very clever idea. The bonus indicator is very helpful and gives great signals based on the same concept of MA angles, fully customizable.

おすすめのプロダクト
The "MR Volume Profile 4" indicator is a charting tool that displays trading volume at different price levels rather than time intervals. A key concept in volume profile is the point of control (POC)—the price level with the highest volume traded during the session or time range. While tools like VWAP or OBV provide volume trends, the "MR Volume Profile 4" indicator offers granular detail about where the most market activity occurs at specific price levels. This makes it a more precise tool for
Market Profile with Dashboard Indicator - Complete User Guide indicator Overview The Market Profile with Dashboard is a comprehensive trading analysis tool for MetaTrader 4 that displays market profile data, volume analysis, and key market structure information directly on your chart. This indicator helps traders identify significant price levels, market balance areas, and potential trading opportunities based on market profile theory. Core Components and Features Market Profile Display - Sh
Market Profile Heat indicator  — is a classic Market Profile implementation that can show the price density over time, outlining the most important price levels, value area, and control value of a given trading session. This indicator can be attached to timeframes between M1 and D1 and will show the Market Profile for daily, weekly, monthly, or even intraday sessions. Lower timeframes offer higher precision. Higher timeframes are recommended for better visibility. It is also possible to use a fr
The Market Sentiment Meter indicator calculates the saturation levels of the price chart. A signal to exit the oversold zone indicates a buying opportunity, and a signal to exit the overbought zone indicates a selling opportunity. Typically, for this indicator you need to set relative values for the overbought (Top) and oversold (Bottom) levels. Often a good trend can be seen visually on the price chart. However, an experienced trader must clearly understand the current distribution of forces
Volume DeltaPanel is a very powerful indicator that read the supply on Market. It calculates the Delta from movement of the price and the difference of BUY volumes and SELL volumes. The Volumes are added to price and normalized to symbol points. Its special structure allows you to get all Time Frames values available on the platform MT4. Panel can show 28 instruments simultaneously all customizable according to the offer of the Broker. A good observation of this instrument can suggest great ent
ADX Shark Scalper – The Ultimate Hybrid Indicator for Precision Scalping Dive into the markets with the ADX Shark Scalper , a powerful and versatile tool designed for traders who seek precision in every trade. This cutting-edge indicator seamlessly combines multiple advanced technical signals into one streamlined system, allowing you to spot good buy and sell opportunities with ease. At its core, the ADX Shark Scalper leverages the power of trend and momentum detection through the integration of
Was: $249  Now: $99   Market Profile defines a number of day types that can help the trader to determine market behaviour. A key feature is the Value Area, representing the range of price action where 70% of trading took place. Understanding the Value Area can give traders valuable insight into market direction and establish the higher odds trade. It is an excellent addition to any system you may be using. Blahtech Limited presents their Market Profile indicator for the MetaTrader community. Ins
Adjustable Consecutive Fractals  looks for 2 or more fractals in one direction and sends out a on screen alert, sound alert and push notification, for strong reversal points . Adjustable Consecutive Fractals, shows the fractals on chart along with a color changing text for buy and sell signals when one or more fractals appear on one side of price. Adjustable Consecutive Fractals is based Bill Williams Fractals . The standard Bill Williams fractals are set at a non adjustable 5 bars, BUT withe th
Was: $299  Now: $99   Supply Demand uses previous price action to identify potential imbalances between buyers and sellers. The key is to identify the better odds zones, not just the untouched ones. Blahtech Supply Demand indicator delivers functionality previously unavailable on any trading platform. This 4-in-1 indicator not only highlights the higher probability zones using a multi-criteria strength engine, but also combines it with multi-timeframe trend analysis, previously confirmed swings
MT4 バージョン: https://www.mql5.com/ja/market/product/166784 MT5 バージョン: https://www.mql5.com/ja/market/product/166785 流動性プロファイル 流動性プロファイルは、動的なヒートマップ形式のプロファイルを用いて、チャート上に潜在的な流動性ゾーンをマッピングする、視覚的な市場構造ツールです。 このインジケーターは、過去の価格変動とティックボリュームを分析し、流動性が集中している可能性のある価格帯を強調表示します。描画内容は以下のとおりです。 流動性ライン(潜在的な反応/スイープレベル) ヒートマッププロファイルボックス(流動性集中ゾーン) POC/最大流動性レベル(検出された最高集中度) この結果、トレーダーが以下の点を特定しやすくなる、分かりやすい視覚的なプロファイルが作成されます。 潜在的なマグネットレベル 可能性のあるスイープゾーン 現在の価格の上下の反応エリア エントリー、エグジット、リスク管理のコンテキスト 主な機能 動的な流動性ヒートマッププロファイル
This indicator displays the histogram and arrows on chart. When Simple The Best Pro are placed on a chart, they identify the trend.  The color of may be blue or red. The blue color stands for upside moves and the red color stands for downside trends. The indicator offers to set Stop Loss (SL) and  Take Profit (TP)  setting. The default value is ATR. Indicator has automatic optimization. The STB is a unique indicator that shows the tendency (button Bars) of a particular signals. The STB tells us
Time Bubble ***Specialized for GBPJPY 1H time frame*** (tested for two years with success rates about 82%) Time Circle's smart algorithm detects the price circles with time . give strong signals at the right time as result of combine the price and time. our team spent months to develop this indicator specially for GBPJPY ..with high success rates about 82% win trades over two years .tested from December 2016 to November 2018. *** in last two years total signals 1012 with 829 Wins and 183 Lo
Blahtech VWAP
Blahtech Limited
5 (3)
Was: $69    Now: $49   Blahtech VWAP - Volume Weighted Average Price (VWAP) is the ratio of price to total volume. It provides an average price over a specified time interval.  Links [  Install  |  Update  |  Documentation   ] Feature Highlights Configurable VWAP Line Sessions, intervals, anchored or continuous Previous day settlement line Standard Deviation bands Alerts at bar close or real time Automatic Broker or Tick volumes Significantly reduced CPU usage Input Parameters Expert Advisor
Demarker pullback system - is the manual trading system for choppy markets. It show 2 colored histogram.  When histogram is blue - market is quite bullish, when histogram ir orange - market is more bearish. Up arrow is plotted when histogram is in oversold zone but blue color. Down arrow is plotted when histogram is in overbought zone but orange color. These patterns shows false breakout and possible soon reverse(price is overbought but shows bearish signs and price is oversold but shows bullis
Forex Volume MT4
KEENBASE SOFTWARE SOLUTIONS
KT Forex Volumeは、通貨ペアの買いと売りのボリュームをカラーのヒストグラムで表示します。ボリュームとは、資産の買い取引と売り取引の総量を指します。 FX市場では: 買いのボリュームが売りのボリュームを上回ると、通貨ペアの価格は上昇する傾向があります。 売りのボリュームが買いのボリュームを上回ると、通貨ペアの価格は下落する傾向があります。 特徴 ティックボリュームのデータを用いてトレードを確認することで、不利な取引を回避できます。 大口トレーダーの流れに沿ったトレードを支援します。 すべてのMetaTraderアラートに対応しています。 ティックボリュームの活用 他の市場と異なり、スポットFX市場は中央集権化されていないため、リテールトレーダーにとって正確な取引ボリュームデータを得るのは困難です。 ベテランのFXトレーダーであるCaspar Marneyは2011年に論文を発表し、ティックボリュームと実際の取引ボリュームとの間に高い相関と精度があると結論付けました。 ヒストグラムの計算式 KT Forex VolumeインジケーターはChaikinオシレーターを基にし
BoxChart MT4
Evgeny Shevtsov
4.4 (5)
The market is unfair if only because 10% of participants manage 90% of funds. An ordinary trader has slim changes to stand against these "vultures". This problem can be solved. You just need to be among these 10%, learn to predict their intentions and move with them. Volume is the only preemptive factor that faultlessly works on any timeframe and symbol. First, the volume appears and is accumulated, and only then the price moves. The price moves from one volume to another. Areas of volume accumu
Trade Like an Institution. Protect Like a Professional. Early Sniper Access: Limited Launch Offer! Get ready to elevate your trading precision. We are offering an exclusive, highly limited launch price for the first Dynamic Trend Sniper users. Our Unbeatable Launch Offer: First 10 Snipers Only: $69 (Full lifetime access + all v1.x updates) Standard Retail Price (After 10 Purchases): $129 Why Act Now? This is not just a discount; it's a strategic entry point. We are committed to rewarding o
TMA AI Bands
Monique Ellen Miranda Dos Santos
TMA AI Bands インジケーターは、三角移動平均 (TMA) を基盤とし、動的な上バンドと下バンド、およびチャート上に直接プロットされた明確な買い/売り矢印を備えています。適応型最適化のための統合 AI を特徴とし、再描画なしを保証し、価格がバンドに触れた際に正確な反転シグナルを提供します。 * 通貨ペア: すべての通貨ペアで動作 * 推奨時間枠: D1 / W1 / MN * 設定可能な外部変数:   * TimeFrame – 計算期間   * HalfLength – 平均の平滑化   * BandsDeviations – バンドの標準偏差   * CenterShift, UpperShift, LowerShift – ラインの微調整   * ShowArrows, ArrowGap – 矢印の表示とオフセット制御 * クリーンなインターフェースとシンプルなビジュアルで、複雑さを避けつつ正確性を求めるトレーダーのために設計されています。
インディケータは現在のクオートを作成し、これを過去のものと比較して、これに基づいて価格変動予測を行います。インジケータには、目的の日付にすばやく移動するためのテキスト フィールドがあります。 オプション: シンボル - インジケーターが表示するシンボルの選択; SymbolPeriod - 指標がデータを取る期間の選択; IndicatorColor - インジケータの色; HorisontalShift - 指定されたバー数だけインディケータによって描画されたクオートのシフト; Inverse - true は引用符を逆にします。false - 元のビュー。 ChartVerticalShiftStep - チャートを垂直方向にシフトします (キーボードの上下矢印)。 次は日付を入力できるテキストフィールドの設定で、「Enter」を押すとすぐにジャンプできます。
Scalper Vault は、スキャルピングを成功させるために必要なすべてを提供するプロフェッショナルなスキャルピング システムです。このインジケーターは、外国為替およびバイナリー オプションのトレーダーが使用できる完全な取引システムです。推奨される時間枠は M5 です。 システムは、トレンドの方向に正確な矢印シグナルを提供します。また、トップとボトムのシグナルとギャン マーケット レベルも提供します。 インジケーターは、プッシュ通知を含むすべてのタイプのアラートを提供します。 インジケータの購入後にご連絡ください。私の個人的な取引の推奨事項と素晴らしいボーナス指標を無料で共有します! 幸せで有益な取引をお祈りします!
Institutional Flow Indicator A smart volume-based tool that detects institutional activity zones through direct order flow patterns. It reveals where large institutions operate. An advanced volume indicator that filters out noise to identify probable institutional patterns. Key Features Smart cluster detection Automatic identification Signal classification: Violet / Yellow – Institutional Zone – Strong, sustained institutional activity Red / Green – Strong Signal – Significant buying/selling pre
Gold Trend   - これは優れた株価テクニカル指標です。指標のアルゴリズムは、資産の値動きを分析し、ボラティリティと潜在的なエントリーゾーンを反映しています。 最高の指標シグナル: - 売りの場合 = 赤のヒストグラム + 赤のショートポインター + 同じ方向に黄色のシグナル矢印 + 赤色のトレンド方向矢印。 - 買いの場合 = 青のヒストグラム + 青のロングポインター + 同じ方向の水色のシグナル矢印 + 青色のトレンド方向矢印。 インジケータの利点 1. このインディケータは、高い精度でシグナルを発信します。 2. 確定した矢印シグナルは、トレンドが変化したときにのみ再描画されます。 3. どのブローカーのMetaTrader 4取引プラットフォームでも取引できます。 4. あらゆる資産(通貨、金属、暗号通貨、株式、指数など)を取引できます。 5. M15-H1タイムフレーム(中期取引)で取引するのがよい。 6. 各トレーダーがインディケータを自分用に簡単にカスタマイズできるよう、インディケータ設定で個々のパラメータ(TF、色など)を変更できます。 7.
The Rally Base Drop SND Pivots indicator uses "Rally", "Base", and "Drop" Candles to determine pivot points at which supply and demand (SND) levels are drawn. (Figure 1)   USAGE Figure 2 Rally, Base, and Drop (RBD) candles create a formula for seeing market structure through a fixed methodology. We are able to use this concept to point out pivot areas where Rallies and Drops directly meet. The RBD SND Pivots are similar to traditionally identified "fractal" pivot points, with one key differ
Description The Market Profile & Volume Profile Indicator is a powerful technical analysis tool designed to visualize market activity and price distribution over specific timeframes. Unlike standard technical indicators that focus solely on price over time, this indicator organizes price data to show where the market spent the most time (TPO) and where the most volume was traded (Volume Profile). It automatically calculates and displays key structural levels such as the Point of Control (POC) ,
The Supply and Demand Zone Indicator is a powerful and easy-to-use tool designed to help traders identify critical supply and demand zones on the chart. These zones can provide valuable insight into potential market reversals, breakouts, and important price levels where buyers or sellers are likely to take control. The best   FREE Trade Manager . If you want to create your own Hedging or Grid strategies without any coding make sure to check out the   ManHedger Key Features: Automatic Zone Detect
FREE
Сигнальный индикатор "SDATA" рассчитывается на основе стандартного отклонения от простой средней скользящей пропорционально среднеквадратичному отклонению. Настройки индикатора: Data bars - количество баров для рассчета Deviation Data - среднеквадратичное отклонение Smooth Data - сглаживание данных Code Arrow Buy - код значка на покупку Color Arrow Buy - цвет значка на покупку Code Arrow Sell - код значка на продажу Color Arrow Sell - цвет значка на продажу В момент инициализации индикатора (при
This indicator displays in a separate window the difference between the number of points which increased the price, and the number of points that decreased the price during the time interval specified in the settings. The time interval for calculation is expressed as the number of bars of the chart the indicator is attached to. This approach allows you to evaluate the movement direction (growth or fall) of the instrument's price, the strength of the movement and the size of the movement in point
The indicator enables measurement and analysis of accumulated volume (tick), in any chosen swing. The user's task is to mark individual measuring sections with the help of a "crayon's". The indicator automatically sums the volumes of individual candles. Volume analysis is a basic element of the VSA (volume spread analysis) technique. A method of using an indicator is shown on the film. Parameters description Anchor_mode - If true, one end of the measuring line is always hooked on the current ca
Zig Zag Robot: A Comprehensive Reversal Trading System The Zig Zag Robot is a powerful tool designed to accurately identify key market reversals and filter out market "noise." It goes beyond a simple Zig Zag indicator by combining multiple tools and built-in logic to provide you with ready-to-use trading signals and help you make more informed decisions. How It Works The indicator uses a multi-level approach to market analysis, which allows it to find high-probability entry points: Signal Filter
The   Real Flow Defense Levels   indicator is a proprietary tool designed to identify and plot   significant, high-conviction price zones   directly onto your main trading chart. It uses a dynamic, volume-based analysis to determine where the market has previously demonstrated the   strongest defense or concentration of activity . These plotted lines serve as   dynamic support and resistance levels , highlighting the prices where major participants are most likely to enter or defend their positi
このプロダクトを購入した人は以下も購入しています
Gann Made Easy は、ミスター・ギャンの理論を使用した取引の最良の原則に基づいた、プロフェッショナルで使いやすい外国為替取引システムです。 W・D・ガン。このインジケーターは、ストップロスとテイクプロフィットレベルを含む正確な買いと売りのシグナルを提供します。 PUSH通知を利用して外出先でも取引可能です。 ご購入後、取引方法の説明と優れた追加インジケーターを無料で入手するには、私にご連絡ください! おそらく、ギャンの取引手法についてはすでに何度も聞いたことがあるでしょう。通常、ギャンの理論は初心者のトレーダーだけでなく、すでにある程度の取引経験がある人にとっても非常に複雑なものです。なぜなら、ギャンの取引手法は理論的にはそれほど簡単に適用できるものではないからです。私はその知識を磨き、最良の原則を私の外国為替インジケーターに組み込むために数年を費やしました。 このインジケーターは非常に簡単に適用できます。必要なのは、それをチャートに添付し、簡単な取引推奨事項に従うだけです。このインジケーターは常に市場分析の仕事を行い、取引の機会を探します。適切なエントリーポイントを検出す
An exclusive indicator that utilizes an innovative algorithm to swiftly and accurately determine the market trend. The indicator automatically calculates opening, closing, and profit levels, providing detailed trading statistics. With these features, you can choose the most appropriate trading instrument for the current market conditions. Additionally, you can easily integrate your own arrow indicators into Scalper Inside Pro to quickly evaluate their statistics and profitability. Scalper Inside
M1 SNIPER は使いやすいトレーディングインジケーターシステムです。M1時間足向けに設計された矢印インジケーターです。M1時間足でのスキャルピングのためのスタンドアロンシステムとして、また既存のトレーディングシステムの一部としても使用できます。このトレーディングシステムはM1時間足での取引に特化して設計されていますが、他の時間足でも使用できます。元々、この手法はXAUUSDとBTCUSDの取引用に設計しましたが、他の市場においても役立つと考えています。 インジケーターのシグナルは、トレンドの方向と逆方向に取引できます。インジケーターのシグナルを利用して両方向に取引するのに役立つ特別な取引テクニックをご紹介します。この手法は、特別な動的なサポートとレジスタンスの価格帯を利用することに基づいています。 ご購入後、M1 SNIPER矢印インジケーターをすぐにダウンロードできます。さらに、M1 SNIPERツールのすべてのユーザーに、以下のスクリーンショットに表示されているApollo Dynamic SRインジケーターを無料で提供しています。この2つのインジケーターを組み合わせることで
まず第一に、この取引インジケーターは再描画されず、再描画されず、遅延しないことを強調する価値があります。これにより、手動取引とロボット取引の両方に理想的なものになります。 ユーザーマニュアル:設定、入力、戦略。 アトミックアナリストは、価格の強さとモメンタムを利用して市場でより良いエッジを見つけるためのPA価格アクションインジケーターです。ノイズや誤ったシグナルを除去し、取引ポテンシャルを高めるための高度なフィルターを備えています。複雑なインジケーターの複数のレイヤーを使用して、アトミックアナリストはチャートをスキャンし、複雑な数学的計算をシンプルなシグナルと色に変換します。これにより、どのような初心者トレーダーでも理解して使用し、一貫した取引の決定を行うことができます。 「アトミックアナリスト」は、新規および経験豊富なトレーダー向けにカスタマイズされた包括的な取引ソリューションです。プレミアムインジケーターとトップノッチの機能を1つの取引戦略に組み合わせ、すべてのタイプのトレーダーにとって汎用性のある選択肢にします。 デイリートレーディングとスキャルピング戦略:高速で正確な
Trend Screener
STE S.S.COMPANY
4.79 (95)
トレンドインジケーター、1つのツールに組み込まれたすべての重要なトレンド機能を備えたトレンドトレーディングとフィルタリングのための画期的なユニークなソリューション! これは、すべてのシンボル/商品(外国為替、商品、暗号通貨、インデックス、株式)で使用できる100%再描画されていないマルチタイムフレームおよびマルチ通貨インジケーターです。 期間限定オファー: サポートおよびレジスタンス スクリーナー インジケーターは、たった 50 ドルで永久的にご利用いただけます。(元の価格 250 ドル) (オファー延長) トレンドスクリーナーは、チャート内のドットで矢印トレンドシグナルを提供するインジケーターに続く効率的なインジケーターです。 トレンド分析インジケーターで使用できる機能: 1.トレンドスキャナー。 2.最大利益分析を備えたトレンドライン。 3.トレンド通貨強度メーター。 4.アラート付きのトレンド反転ドット。 5.アラート付きの強いトレンドドット。 6.トレンド矢印 毎日の分析例、毎日のシグナルパフォーマンス...など、トレンドスクリーナーインジケーターを使用して、ここで見つけること
Linear Trend Predictor ー - エントリ ポイントと方向サポート ラインを組み合わせたトレンド インジケーター。高値/安値チャネルを突破するという原理に基づいて機能します。 インジケーターのアルゴリズムは市場のノイズをフィルタリングし、ボラティリティと市場の動向を考慮します。 インジケーターの機能  平滑化手法を使用して、市場のトレンドと、買い注文または売り注文を開くためのエントリー ポイントを表示します。  任意の時間枠のチャートを分析して、短期および長期の市場の動きを判断するのに適しています。  あらゆる市場や時間枠に適応可能な入力パラメータにより、トレーダーはインジケーターを独自にカスタマイズできます。  設定されたインジケーター信号は消えず、再描画もされません。ローソク足の終値で決定されます。  いくつかの種類の通知が矢印と組み合わされています。  このインジケーターは、独立した取引システムとして使用することも、他の取引システムへの追加として使用することもできます。  あらゆるレベルの経験を持つトレーダーが使用できます。 主なパラメータ Vol
After purchase, contact me privately to receive 7 days of free testing with EA Forex Proton. This advanced MT4 trading robot automatically executes signals from any MT4 indicator, including Market Makers. The latest version also includes AI integration, allowing each trade signal to be analyzed using Artificial Intelligence. Market Makers is a powerful price action trading system designed to identify high-probability Buy and Sell opportunities based on market momentum, volatility, and price po
トレンドラインプロ   市場の真の方向転換点を理解するのに役立ちます。この指標は、真のトレンド反転と主要プレーヤーが再び参入するポイントを示します。 分かりますか     BOSライン   複雑な設定や不要なノイズなしに、より長い時間足でのトレンドの変化と重要なレベルを把握できます。シグナルは再描画されず、バーが閉じた後もチャート上に残ります。 VERSION MT 5     -     RFI LEVELS PRO インジケーター と組み合わせることで、その潜在能力を最大限に発揮します。 インジケーターが示す内容: 本当の変化   トレンド(BOSライン) 一度シグナルが現れたら、それは有効です!これは、リペイント機能を持つインジケーターとの重要な違いです。リペイント機能を持つインジケーターは、シグナルを発した後、それを変更し、資金の損失につながる可能性があります。これにより、より高い確率と精度で市場に参入できます。また、矢印が現れた後、目標値(利益確定)に達するか、反転シグナルが現れるまで、ローソク足の色を変更する機能もあります。 繰り返しエントリ       主要プレーヤーの
GOLD Impulse with Alert
Bernhard Schweigert
4.67 (12)
このインディケータは、当社の2つの製品 Advanced Currency IMPULSE with ALERT  +   Currency Strength Exotics . のスーパーコンビネーションです。 このインジケーターは全ての時間枠で作動し、8つの主要通貨と1つのシンボルの強弱のインパルスをグラフで表示します。 このインジケータは、金、エキゾチックペア、商品、インデックス、先物など、あらゆるシンボルの通貨強度の加速度を表示することに特化されています。金、銀、原油、DAX、US30、MXN、TRY、CNHなどの通貨強度の加速度(インパルスまたは速度)を表示するために、任意のシンボルを9行目に追加できる、この種の最初のものです。 新しいアルゴリズムに基づいて構築され、潜在的な取引の特定と確認がさらに容易になりました。これは、通貨の強さや弱さが加速しているかどうかをグラフィカルに表示し、その加速の速度を測定するためです。加速すると物事は明らかに速く進みますが、これはFX市場でも同じです。つまり、反対方向に加速している通貨をペアリングすれば、潜在的に利益を生む取引を特定
「 Dynamic Scalper System 」インジケーターは、トレンド波の中でスキャルピング取引を行う手法のために設計されています。 主要通貨ペアと金でテスト済みで、他の取引商品との互換性があります。 トレンドに沿った短期的なポジションオープンのシグナルを提供し、追加の価格変動サポートも提供します。 インジケーターの原理 大きな矢印はトレンドの方向を決定します。 トレンド波の中では、小さな矢印の形でスキャルピングシグナルを生成するアルゴリズムが機能します。 赤い矢印は強気方向、青い矢印は弱気方向です。 トレンドの方向には敏感な価格変動ラインが描かれ、小さな矢印のシグナルと連動します。 シグナルは次のように機能します。適切なタイミングでラインが現れるとエントリーシグナルが形成され、ラインが開いている間はポジションが保持され、完了すると取引が終了します。 推奨される動作時間枠はM1~H4です。 矢印は現在のローソク足に形成され、次のローソク足が開いている場合は、前のローソク足の矢印は再描画されません。 入力パラメータ Trend Wave Period - トレンド方向
ご紹介     Quantum Breakout PRO は 、ブレイクアウト ゾーンの取引方法を変革する画期的な MQL5 インジケーターです。 13年以上の取引経験を持つ経験豊富なトレーダーのチームによって開発された Quantum Breakout PROは 、革新的でダイナミックなブレイクアウトゾーン戦略により、あなたの取引の旅を新たな高みに押し上げるように設計されています。 クォンタム ブレイクアウト インジケーターは、5 つの利益ターゲット ゾーンを備えたブレイクアウト ゾーン上のシグナル矢印と、ブレイクアウト ボックスに基づいたストップロスの提案を提供します。 初心者トレーダーにもプロのトレーダーにも適しています。 量子EAチャネル:       ここをクリック MT5バージョン:   ここをクリック 重要!購入後、インストールマニュアルを受け取るためにプライベートメッセージを送ってください。 推奨事項: 時間枠: M15 通貨ペア: GBPJPY、EURJPY、USDJPY、NZDUSD、XAUUSD アカウントの種類: ECN、Raw、またはスプレッドが非
MetaForecast M4
Vahidreza Heidar Gholami
5 (2)
MetaForecastは、価格データのハーモニクスに基づいて、どんな市場の未来を予測し視覚化します。市場が常に予測可能ではありませんが、価格にパターンがある場合、MetaForecastは可能な限り正確な未来を予測できます。他の類似製品と比較して、MetaForecastは市場のトレンドを分析することでより正確な結果を生成することができます。 入力パラメータ Past size (過去のサイズ) MetaForecastが将来の予測を生成するために使用するバーの数を指定します。モデルは選択したバー上に描かれた黄色の線で表されます。 Future size (将来のサイズ) 予測すべき将来のバーの数を指定します。予測された将来は、ピンクの線で表示され、その上に青い回帰線が描かれます。 Degree (程度) この入力は、MetaForecastが市場で行う分析のレベルを決定します。 Degree 説明  0 Degree 0の場合、価格の全てのピークや谷、そして詳細をカバーするために、「Past size」の入力に大きな値を使用することが推奨されています。  1 (推奨) Degre
現在20%OFF! 初心者やエキスパートトレーダーに最適なソリューションです。 このインディケータは、エキゾチックペア・コモディティ・インデックス・先物など、あらゆるシンボルの通貨の強さを表示することに特化したインディケータです。金、銀、原油、DAX、US30、MXN、TRY、CNHなどの通貨の強さを表示するために、9行目にどのシンボルでも追加することができます。独自の機能を多数搭載し、新しい計算式を採用したため、ユニークで高品質、かつ手頃な価格のトレーディングツールとなっています。新しいトレンドやスキャルピングチャンスのトリガーポイントを正確に把握することができるため、あなたのトレードがどのように改善されるか想像してみてください。 ユーザーマニュアル:ここをクリック   https://www.mql5.com/en/blogs/post/708876 すべての時間枠に対応します。あなたはすぐにトレンドを見ることができるようになります! 新しいアルゴリズムに基づいて設計されているため、潜在的な取引の特定と確認がより簡単になります。これは、8つの主要通貨と1つのシンボルの強弱
The Reversal Master is an indicator for determining the current direction of price movement and reversal points. The indicator will be useful for those who want to see the current market situation better. The indicator can be used as an add-on for ready-made trading systems, or as an independent tool, or to develop your own trading systems. The Reversal Master indicator, to determine the reversal points,  analyzes a lot of conditions since the combined analysis gives a more accurate picture of t
Route Lines Prices -は、価格の方向性を予測するために設計されたインジケーターです。シンプルなインターフェースには、価格変動と将来の方向性を計算するための複数のアルゴリズムが搭載されています。これらのアルゴリズムには、使用する時間枠に基づいたボラティリティ計算と価格平滑化が含まれています。 このインジケーターには、「 Calculating price values 」値を変更するためのパラメーターが1つだけあります。デフォルト値の1は、バランスの取れた自動計算を提供し、インジケーターを手動で設定することなく使用できます。 値を2から500まで手動で変更することで、インジケーターを独自のトレーディングシステムに合わせてカスタマイズできます。 このインジケーターは、M1からH4の時間枠での使用を推奨します。あらゆる取引銘柄で使用できます。 シグナル矢印はローソク足の終値で生成され、過去の履歴には再描画されません。 メインチャートには、重複した矢印が表示されます。 複数のアラートタイプが利用可能です。内蔵のライン軌跡カウンターは、終値に基づいて動作します。これ
CRT Multi-Timeframe Market Structure & Liquidity Sweep Indicator Non-Repainting | Multi-Asset | MT5 Version Available MT5 Version:   https://www.mql5.com/en/market/product/162075 Full User Guide — explains what each feature does and why:   https://www.mql5.com/en/blogs/post/767525 Quick Start User Guide  — explains how to configure and in what order:  https://www.mql5.com/en/blogs/post/767540 Indicator Overview CRT Ghost Candle HTF Fractal is a complete institutional-grade market structure too
通貨強さウィザードは、取引を成功させるためのオールインワン ソリューションを提供する非常に強力な指標です。このインジケーターは、複数の時間枠のすべての通貨のデータを使用して、このまたはその外国為替ペアのパワーを計算します。このデータは、使いやすい通貨インデックスと通貨パワーラインの形式で表され、特定の通貨のパワーを確認するために使用できます。 必要なのは、取引したいチャートにインジケーターを接続することだけです。インジケーターは、取引する通貨の実際の強さを示します。このインジケーターは、トレンドに合わせて取引するときに有利に利用できる売買高の圧力の極値も示します。このインジケーターには、フィボナッチに基づく可能なターゲットも表示されます。 このインジケーターは、PUSH 通知を含むあらゆるタイプのアラートを提供します。 購入後ご連絡下さい。私の取引のヒントをあなたと共有し、素晴らしいボーナスインジケーターを無料で提供します! 幸せで有益な取引をお祈りします。
MT5バージョンはこちらからご利用いただけます: https://www.mql5.com/en/market/product/50048 Telegramチャンネル&グループ: https://t.me/bluedigitsfx V.I.Pグループアクセス: 有料商品の購入証明を当方の受信箱へ送信してください 推奨ブローカー: https://bit.ly/BlueDigitsFxStarTrader BlueDigitsFx Easy 123 System — MT4用の強力な反転およびブレイクアウト検出システム 初心者から上級者まで使いやすい、マーケット構造の変化、ブレイクアウト、トレンド反転を視覚的に捉えるオールインワンのノンリペイントインジケーターです。 本インジケーターは「123」パターンに従って動作します: ステップ1: 新しい高値または安値をビッグアローで表示し、エキゾーストポイント(勢いの弱まり)を示します ステップ2: 構造のブレイクを知らせ、トレンド反転の可能性を示唆します ステップ3: リトルアローとサポート/レジスタンスドットでエントリーを確定します
Auto Optimized Parabolic RSI: 高度な3Dモメンタムエンジン ほとんどのリテール向けインジケーターは、市場のボラティリティが変化した瞬間に破綻する静的な入力値に依存しているため、失敗に終わります。Auto Optimized Parabolic RSIは、自らの数学的優位性を継続的に再計算することで「インジケーターの陳腐化」問題を解決し、機関投資家レベルの定量的適応力をMT5ターミナルに直接もたらします。 最大の強み: カスタムインメモリ3D最適化   標準的な自動最適化ツールは、インジケーターの呼び出しで端末に過負荷をかけるため、頻繁にMT5プラットフォームをフリーズさせます。本ツールは、このボトルネックを完全に回避しています。RAMベースのカスタムネイティブ計算機を内蔵した内部エンジンは、チャートを読み込んだりタイムフレームを変更したりするたびに、超高速の3Dグリッド探索を実行します。RSI期間(頻度)、SARステップ(加速度)、SAR最大値(制限速度)を同時にスイープし、プラットフォームを遅延させることなく、数万通りものパラメーターの組み合わせを絶対的
Advanced Supply Demand
Bernhard Schweigert
4.91 (299)
現在40%オフ 初心者にもエキスパートトレーダーにも最適なソリューション このインジケーターは独自の機能と新しい公式を多数内蔵しており、ユニークで高品質かつ手頃な取引ツールです。このアップデートでは、2つの時間枠ゾーンを表示できるようになります。より長いTFだけでなく、チャートTFとより長いTF(ネストゾーンを表示)の両方を表示できます。すべてのSupply Demandトレーダーの皆さんのお気に召すはずです。:) 重要情報の公開 Advanced Supply Demandの可能性を最大化するには、 https://www.mql5.com/ja/blogs/post/720245 にアクセスしてください。   エントリーまたはターゲットの正確なトリガーポイントを正確に特定できれば取引がどのように改善されるか想像してみてください。新しい基盤となるアルゴリズムに基づいて構築されているため、買い手と売り手の間の潜在的な不均衡をさらに簡単に特定できます。これは、最も強い需要と供給のゾーンと、過去のパフォーマンス(古いゾーンを表示)がグラフィカルに表現されるためです。これらの機能は、最適な
Super Signal Market Slayer 非リペイント|高精度|マルチマーケット対応インテリジェントトレンド指標 トレードにおいて本当に難しいのは、 注文することではなく、相場のノイズの中で「トレンドが始まった瞬間」を見極めることです。 Market Slayer はそのために開発されました。 本インジケーターは、日中取引向けに設計された非リペイント型のインテリジェント指標です。 多層確認とトレンドフィルターにより、重要な局面でのみ明確かつ信頼性の高い Buy / Sell シグナルを表示します。 主な特長 非リペイントシグナル 一度表示されたシグナルは固定され、消えたり移動したりしません。 高精度なトレンド判定 複数銘柄で検証され、特にゴールド M5 / M15 で安定した結果を示します。 マルチマーケット対応 ゴールド、FX、指数、主要暗号資産に対応。 日中取引向け最適化 M5・M15 に特化し、ノイズを抑え実行性を向上。 直感的で分かりやすい 初心者でも理解しやすく、すぐに使用可能。 技術ロジック概要 Market Slayer は単一条件の矢印ではありません。 以
Super Reversal Indicator with Alert 概要 Super Reversal Indicator with Alert は、マルチタイムフレーム分析を用いて高確率の相場反転ポイントを特定するためのトレーディングツールです。ストキャスティクスのモメンタム、需給ゾーン、そして価格のリジェクションシグナルを組み合わせて分析を行います。 本インジケーターは、明確な視覚シグナルとリアルタイムアラートにより、トレーダーが市場の転換点を見極めるのをサポートします。 主な機能 マルチタイムフレーム ストキャスティクス分析 上位時間足のストキャスティクスを使用(ユーザー設定可能) モメンタムの変化やクロスシグナルを検出 エントリー精度を高めるための買われ過ぎ・売られ過ぎレベルを表示 反転リジェクションシグナル 重要な価格帯での強いリジェクションローソク足を検出 以下のポイントでの反転を識別 日足高値での売り反転 日足安値での買い反転 視認性を高めるため、チャート上に矢印を表示 需給ゾーン(Supply and Demand) H4およびD1の上位時間足から重要なゾーンを自動
Stratos Pali
Michela Russo
4.43 (7)
Stratos Pali Indicator   is a revolutionary tool designed to enhance your trading strategy by accurately identifying market trends. This sophisticated indicator uses a unique algorithm to generate a complete histogram, which records when the trend is Long or Short. When a trend reversal occurs, an arrow appears, indicating the new direction of the trend. Important Information Revealed Leave a review and contact me via mql5 message to receive My Top 5 set files for Stratos Pali at no cost! Dow
Dynamic Forex28 Navigator - 次世代の Forex 取引ツール。 現在 49% オフ。 Dynamic Forex28 Navigator は、長年人気のインジケーターを進化させたもので、3 つの機能を 1 つにまとめています。 Advanced Currency Strength28 インジケーター (レビュー 695 件)  + Advanced Currency IMPULSE with ALERT (レビュー 520 件) + CS28 コンボ シグナル (ボーナス)。 インジケーターの詳細 https://www.mql5.com/en/blogs/post/758844 次世代の Strength インジケーターが提供するもの  オリジナルで気に入っていたすべての機能が、新機能と精度の向上によって強化されました。 主な機能: 独自の通貨強度計算式。 すべての時間枠でスムーズかつ正確な強度ライン。 トレンドの特定と正確なエントリーに最適です。 ダイナミックマーケットフィボナッチレベル (マーケットフィボナッチ)。 このインジケーターに固有
現在40%OFF! 初心者やエキスパートトレーダーのためのベストソリューション! このダッシュボードソフトウェアは、28の通貨ペアで動作しています。それは私達の主要な指標(高度な通貨の強さ28と高度な通貨インパルス)の2に基づいています。それは全体の外国為替市場の大きい概観を与えます。それは、すべての(9)時間枠で28の外国為替ペアのための高度な通貨の強さの値、通貨の動きの速度と信号を示しています。チャート上で1つのインディケータを使用して市場全体を観察し、トレンドやスキャルピングの機会をピンポイントで見つけることができたら、あなたのトレードがどのように改善されるか想像してみてください。 このインディケータには、強い通貨と弱い通貨の識別、潜在的な取引の識別と確認がより簡単になるような機能が搭載されています。このインディケータは、通貨の強さや弱さが増加しているか減少しているか、また、すべての時間枠でどのように機能しているかをグラフィカルに表示します。 新機能として、現在の市場環境の変化に適応するダイナミックなマーケットフィボナッチレベルが追加され、すでに当社のAdvanced
- Real price is 80$ - 40% Discount (It is 49$ now) Contact me for instruction, add group and any questions! - Non-repaint - I just sell my products in Elif Kaya profile, any other websites are stolen old versions, So no any new updates or support. - Lifetime update free Related product:   Bitcoin Expert Introduction The breakout and retest strategy is traded support and resistance levels. it involves price breaking through a previous level.  The break and retest strategy is designed to help tr
Order Block Hunter
Noha Mohamed Fathy Younes Badr
5 (10)
Order block hunter indicator is the best indicator for  hunt the order blocks that area where there has been a large concentration of limit orders waiting to be executed Order blocks are identified on a chart by observing previous price action and looking for areas where the price experienced significant movement or sudden changes in direction .This indicator does that for you by using very complicated codes and helps you to take the best areas To buy and sell because it make marks at the best a
FX Power: 通貨の強弱を分析して、より賢い取引を実現 概要 FX Power は主要通貨と金の実際の強弱をあらゆる市場状況で理解するための必須ツールです。強い通貨を買い、弱い通貨を売ることで、 FX Power は取引の意思決定を簡素化し、高い確率の取引機会を見出します。トレンドを追従する場合でも、極端なデルタ値を使用して反転を予測する場合でも、このツールはあなたの取引スタイルに完全に適応します。ただ取引するだけではなく、 FX Power で賢く取引をしましょう。 1. なぜ FX Power がトレーダーにとって非常に有益なのか 通貨と金のリアルタイム強弱分析 • FX Power は主要通貨と金の相対的な強弱を計算し、マーケットダイナミクスに関する明確な洞察を提供します。 • どの資産がリードしているか、または後れを取っているかを監視して、取引するペアを賢く選びましょう。 マルチタイムフレームの包括的なビュー • 短期、中期、長期のタイムフレームで通貨と金の強弱を追跡し、マーケットトレンドに基づいて取引戦略を調整できます。 • スキャルピングからスイングトレード
Apollo Secret Trend は、任意のペアと時間枠でトレンドを見つけるために使用できるプロのトレンド インジケーターです。インジケーターは、取引するペアや時間枠に関係なく、市場のトレンドを検出するために使用できる主要な取引インジケーターになることができます。インジケーターで特別なパラメーターを使用することにより、シグナルを個人の取引スタイルに適応させることができます。 このインジケーターは、PUSH 通知を含むすべてのタイプのアラートを提供します。インジケータの信号は再描画しないでください!提供されたスクリーンショットでは、アポロ シークレット トレンド インジケーターと買われ過ぎ/売られ過ぎのオシレーター インジケーターを組み合わせて見ることができます。これは完全に無料で提供されます。 購入後、2 番目の買われすぎおよび売られすぎのオシレーター インジケーターを無料で入手するために私に連絡してください!また、システムの使用方法についても説明します。お得な特典もご用意しております!
Volatility Trend System - a trading system that gives signals for entries. The volatility system gives linear and point signals in the direction of the trend, as well as signals to exit it, without redrawing and delays. The trend indicator monitors the direction of the medium-term trend, shows the direction and its change. The signal indicator is based on changes in volatility and shows market entries. The indicator is equipped with several types of alerts. Can be applied to various trading ins
作者のその他のプロダクト
Auto Optimized Parabolic RSI: 高度な3Dモメンタムエンジン ほとんどのリテール向けインジケーターは、市場のボラティリティが変化した瞬間に破綻する静的な入力値に依存しているため、失敗に終わります。Auto Optimized Parabolic RSIは、自らの数学的優位性を継続的に再計算することで「インジケーターの陳腐化」問題を解決し、機関投資家レベルの定量的適応力をMT5ターミナルに直接もたらします。 最大の強み: カスタムインメモリ3D最適化 標準的な自動最適化ツールは、インジケーターの呼び出しで端末に過負荷をかけるため、頻繁にMT5プラットフォームをフリーズさせます。本ツールは、このボトルネックを完全に回避しています。RAMベースのカスタムネイティブ計算機を内蔵した内部エンジンは、チャートを読み込んだりタイムフレームを変更したりするたびに、超高速の3Dグリッド探索を実行します。RSI期間(頻度)、SARステップ(加速度)、SAR最大値(制限速度)を同時にスイープし、プラットフォームを遅延させることなく、数万通りものパラメーターの組み合わせを絶対的なミ
Bazooka EA
Davit Beridze
5 (3)
Bazooka EA ― MT4用トレンド&モメンタム型エキスパートアドバイザー MT5:  https://www.mql5.com/en/market/product/163078 【重要】コメント欄にて更新済みのセット(.set)ファイルを定期的に公開しています。現在の相場環境で最適なパフォーマンスを発揮できるよう、バックテストや実運用を行う際は必ず最新のファイルを使用してください。 Bazooka EA は、 MetaTrader 4 向けの完全自動売買エキスパートアドバイザーで、 トレンド確認 と モメンタムフィルター を組み合わせることで、方向性のある市場の動きを取引するよう設計されています。 本EAは、制御されたエントリーと規律ある決済に重点を置き、過度な取引や高リスクなポジション管理手法を使用しません。 Bazooka EA は、明確なルールに基づいた戦略と、調整可能なリスク管理を重視するトレーダーに適しています。 戦略概要 Bazooka EA は、以下のテクニカル要素を組み合わせて市場を分析します。 移動平均線(Moving Average) によるトレンド方向の判
Bazooka EA ― MT5用トレンド&モメンタム型エキスパートアドバイザー 【重要】コメント欄にて更新済みのセット(.set)ファイルを定期的に公開しています。現在の相場環境で最適なパフォーマンスを発揮できるよう、バックテストや実運用を行う際は必ず最新のファイルを使用してください。 Bazooka EA   は、 MetaTrader 5   向けの完全自動売買エキスパートアドバイザーで、 トレンド確認 と モメンタムフィルター を組み合わせることで、方向性のある市場の動きを取引するよう設計されています。 本EAは、制御されたエントリーと規律ある決済に重点を置き、過度な取引や高リスクなポジション管理手法を使用しません。 Bazooka EA は、明確なルールに基づいた戦略と、調整可能なリスク管理を重視するトレーダーに適しています。 戦略概要 Bazooka EA は、以下のテクニカル要素を組み合わせて市場を分析します。 移動平均線(Moving Average)   によるトレンド方向の判定 RSI   を用いたモメンタム確認 注文実行前の厳格な取引条件チェック トレンドとモメン
Auto Optimized MFI は、自動で最適なMFIの買い・売りレベルを調整するインジケーターです。過去のデータに基づいて実際のトレードシミュレーションを行い、あなたの市場や時間足に合わせて最も効果的なエントリーポイントを見つけ出します。従来の80/20といった固定的なMFI基準ではなく、実際の価格と出来高の動きに適応するのが特徴です。 動作の仕組み 指定した範囲の過去のローソク足を分析し、MFIシグナルに基づくエントリーとエグジットをシミュレーションします。勝率、ドローダウン、TP/SL(利益確定/損切り)などの成績を記録し、これらの結果から最適なMFIレベルを毎日、毎週、または毎月自動で更新します。 主な機能 設定可能なMFI期間(デフォルト:14) 最適化するローソク足の範囲を指定可能 買い/売りレベルの範囲をカスタマイズ可能 細かい調整が可能なステップサイズ設定 最小利益ターゲットの設定で弱い戦略を排除 MFIラインとシグナル矢印のスタイル設定が可能 このツールは、市場の変化に柔軟に対応したいトレーダーに最適で、固定ルールに頼らず常に市場に適応する戦略を実現します。
2024年以降のゴールド (Gold M15) テストのデフォルト設定 Kaufman Smart Regime EA: 適応型市場インテリジェンス 特別先行オファー: Smart Regime EA の能力は、その真の価値のほんの一部で提供されています。価格が最終評価額の $500 に向けて段階的に上昇し始める前に、今すぐライセンスを $50 で確保してください。これは比類なき市場ロジックへの投資です。 適応型アルゴリズム取引の力を解き放ちます。Kaufman Smart Regime EA は単なる戦略ではありません。ノイズと真の勢いを区別するために設計された、市場感知エンジンです。 コア哲学:「スマート・レジーム」検出 ほとんどのアルゴリズムは、動的な市場に静的なロジックを適用するため失敗します。 Kaufman Smart Regime EA は、Perry Kaufman の伝説的な効率比ロジックを独自に改良したものを利用し、市場の「レジーム(体制)」を決定します。混沌としたレンジ相場では休止し、真の方向性流動性が市場に参入したときにのみ、精密に攻撃します。 上位時間軸マ
Auto Optimized Bollinger Bands – 実際の市場に対応する適応型ボラティリティツール Auto Optimized Bollinger Bandsは、従来のボリンジャーバンドを強化したMT4用の高度なインジケーターで、過去のトレードシミュレーションに基づいて最適な期間と偏差の値を自動で選択します。 固定された設定に依存するのではなく、市場の実際の動きに基づいてリアルタイムで最適化を行い、ボラティリティや価格構造の変化に動的に対応できるバンドを生成します。手動での調整は不要です。 主な機能: 過去のパフォーマンスに基づいたボリンジャーバンドパラメーターの自動最適化 重要な反転ポイントでの矢印による売買シグナルを表示 アラート内蔵:サウンド、ポップアップウィンドウ、プッシュ通知 最適化の深さ、表示方法、シグナルなどのカスタマイズが可能 FX、ゴールド、株価指数、暗号通貨など様々な市場で使用可能 本ツールはデイトレードやスイングトレードに最適で、固定パラメーターの従来型インジケーターよりも、よりスマートなボラティリティ取引アプローチを提供します。
Auto Optimized RSI   は、正確な売買シグナルを提供するために設計された、使いやすいスマートな矢印インジケーターです。過去のデータを使ったトレードシミュレーションに基づき、各通貨ペアや時間足に最適なRSIの買い/売りレベルを自動で見つけ出します。 このインジケーターは、独立したトレードシステムとしても、既存の戦略の一部としても使用できます。特に短期トレーダーにとって便利なツールです。 従来のRSI(70/30など)の固定レベルとは異なり、 Auto Optimized RSI   はリアルな価格の動きとバックテスト結果に基づき、ダイナミックにレベルを調整します。勝率、ドローダウン、平均利益/損失といった重要な統計をモニターし、現在の市場に適応して、本当に機能するシグナルを提供します。 RSIが最適化されたレベルをクロスすると、チャート上に買い・売りの矢印が表示され、成功率の高いエントリーポイントを見つけるのに役立ちます。 ご購入後にご連絡いただければ、追加のツールや特別なトレードのヒントを無料でお渡しいたします! 皆様のトレードが成功しますように!
Speed Trend Matrix Ultimate (バージョン 5.10) Speed Trend Matrix (STM) は、単一のインジケーターに組み込まれた包括的なトレーディングシステムです。買われすぎや売られすぎの状態を示すだけの標準的なオシレーターとは異なり、STM は市場のボラティリティ (ATR) に対する価格の「速度」を分析します。トレンドの方向性だけでなく、その動きの背後にある強さも特定し、トレーダーが騙しに遭いやすい勢いの低い「横ばい」期間をフィルタリングします。 このツールは、すべての取引に対して完全なロードマップを必要とするトレーダー向けに設計されています。単なるエントリーシグナルを提供するだけでなく、選択したトレーディングスタイルに基づいて推奨される ストップロス (Stop Loss) と テイクプロフィット (Take Profit) の水準を自動的に計算し、チャート上に直接表示します。 基本理念 インジケーターは、価格の速度に基づいて市場の行動を 3 つの異なるゾーンに分類します。 UpZone (緑): 強い上昇の勢いがある状態。 DownZo
RSI Entry Points is the upgrade of the standard RSI indicator to avoid lagging. Indicator draws the clouds and the arrows to have clear picture where price is and what to wait for. Why standard RSI is lagging? because mostly we do not use it correctly and it is with very weak visual flexibility, less informative. With my current upgrade I tried to Fix both problems same time and I got much better results and more exact entries than standard RSI has. I Made RSI line Dynamic, it gets more flexible
RSI Entry Points is the upgrade of the standard RSI indicator to avoid lagging. Indicator draws the clouds and the arrows to have clear picture where price is and what to wait for. Why standard RSI is lagging? because mostly we do not use it correctly and it is with very weak visual flexibility, less informativity. With my current upgrade I tried to Fix both problems same time and I got much better results and more exact entries than standard RSI has. To make yourself sure check out the screens
Dashboard for Ma Speedometer:  https://www.mql5.com/en/market/product/116784 Non standard attitude to the standard moving average indicator. The essence of the indicator is to determine the strength and speed of the price direction by determining the tilt angle of the moving average. A point is taken on the fifteenth MA candle and a point on the last closed MA candle, a straight line is drawn between them, it is movable and on a hemisphere shows an angle of inclination from 90 degrees to -90. a
Check my p a id tools they   work  perfect please r ate Here is an Upgraded version with Bonus Ea in case of purchase it costs 30$ only and you get Ea as Bonus:  https://www.mql5.com/en/market/product/96835 This indicator is experimetal, it shows TMA channel arrows with Volatility filter built in to avoid lagging. Try to experiment with it, search for better conditions of use. It is possible to adjust different timeframes for TMA and for Volatility filter Same time on the current chart, so it ma
FREE
Check my p a id tools they   work  perfect! "Period Cross RSI" Is a New indicator idea that shows crosses of two RSI lines with different periods which creates ascending and descending zones for confirmation of long and short trading. This indicator is brend new and will be upgraded further, for now I recommend to use it as a confirmation, filter indicator for determination of long/short trading zones, not as a signaler indicator for now. Further upgrades can make it as a signaler indicator as w
FREE
Check my p a id tools they   work  perfect please r ate Adjustable PIN BAR indicator is usefull tool alowing to search for pin bars you wish to find on the price chart, it has 2 parameters to filter out what type of pin bars you wish to search for: 1) MinTailProc 75% (default) which means to show pin bars that has minimum size of the Nose (Tail) as 75% of full candle size. If Upper Nose (Tail) size of the candle is minimum 75% of the candle size fully than candle is painted in RED. If Lower Nose
FREE
Check my paid tools they work great and I share Ea's based on them for free please r ate The Dual Timeframe RSI (Relative Strength Index) indicator is a novel trading tool that allows traders to monitor RSI readings from two different timeframes on a single chart. This dual perspective enables traders to identify potential trend confirmations and divergences more effectively. For instance, a trader might use a 1-hour RSI alongside a daily RSI to ensure that short-term trades align with the broa
FREE
Indicator shows buy/sell arrows depending on volatility factor. Indicator does not repaint! It works on any pair and any timeframe. It is well tested through strategy builders and shows quite interesting results as a good filter indicator and as independent signaler as well (check the screenshots). It is possible to search for a lot of interesting parameters for profitable trading, some of which are shown on the screenshots. There are next inputs in indicator settings: N-volatility period; Level
Steady Ranger EA – スマートで安全なチャネル取引 バックテスト: 提供された set ファイル(コメント欄)を使用し、「始値のみ」モードでテストしてください。 動画: 字幕付きのビデオを視聴して、詳細を理解してください。 なぜ Steady Ranger EA を選ぶのか? 長期的な安定性とリスク管理を重視した取引システムであり、非現実的な利益を追求するものではありません。 多層ストップ保護: 各取引のストップロスと「損失合計制限」の両方を使用し、ドローダウンを管理。 チャネルベースの取引戦略: 価格チャネルの極端なレベルで取引を行い、適切なシグナルで決済。 適応型ロット調整: リスクを制御しながら、ロットサイズを動的に調整。 マルチタイムフレームフィルター: 一方向の強いトレンド中のエントリーを回避。 信頼性のある戦略: 長期的な安定性を実現し、フォワードテストを通過。 仕組み EA は価格チャネルに沿ってエントリーし、シグナルやストップロス、リスク管理の仕組みに基づいて決済します。過剰なポジションを防ぐため、ロットサイズを制御し、最大ロットに達すると新規ポジション
This EA is Created just for RSI Entry points Indicator ( https://www.mql5.com/en/market/product/67581 Test, to show indicators profitable parameters and to give potential buyers possibility to backtest indicator Entries. EA opens Buy orders on Buy Arrows and Sell orders on Sell Arrows of the indicator, orders are closed on opposite signals. EA is not created for Live automated trading, thats not the goal to sell EA, but any ways if you like it and need it, you can rent. Default settings are fo
MFI Modern PRO
Davit Beridze
4.92 (39)
Def ault settings   are just for visu alis ation, it c an not be profit able with it.  Get a Free EA as a Bonus when you Purchase the Indicator! Plus, Receive 4 Interesting Additional Indicators. Recommended set files for backtesting the indicator on recommended pairs are available in the comments section (last page). Please note that this product is exclusively sold on the MQL5 market. Any other sources offering it are scams, and the author bears no responsibility. To receive the bonus gifts,
Re ad First Before Testing. This Ea goes as a Bonus to  MFI Modern PRO indicator users only. Set files generated  after upgrade you can check in comments section. This Expert advisor is based on MFI Modern PRO indicator   https://www.mql5.com/en/market/product/80765 just to  give possibility to indicator users for fastly test the indicator Before buying. In comments section recommended set files are uploaded by which you can prove yourself that backtest data from indicator overview are real. Thi
MA Revolution is upgraded version of standard Moving   A verage. With the current upgrade moving average line got more sensitive with different market conditions. It gets more flexible by decreasing default period step by step while market is sharp and incrasing period back to default period step by step while market is normal again. testing of the ide a shows th at this upgr aded version gives much more acur acy for detecting m arket direction, ch anges in direction are shown much e arly th an
In case you get Laguerre S crat indicator, you will get Laguerre Scrat Ea as a Gift. To get Ea  and det a iled m anu al PDF contact me PM. Default settings are for usd/cad H4 For St able Long term Profits Laguerre Scrat is a trading system based on 4 indicator combinations in the shape of one indicator. Laguerre indicator (upgraded), CCI, Bollinger bands and market volatility factor. It generates arrows in the indicator window and nuts on the price chart, doubling arrows for a better view where
Fiter
Davit Beridze
5 (2)
インジケーターの購入者には、FiterインジケーターをベースにしたEAがボーナスとして無料で提供されます。(EAの動作を見るには、ビデオをご覧ください。)EAを受け取るにはコメントしてください。 Fiter は、ATRで調整されたRSIライン(黄色)を含む指数移動平均線(EMA)と、従来の移動平均線(赤色)を組み合わせたハイブリッドインジケーターです。この2つのラインのクロスオーバーにより、2本の単純移動平均線を使用する従来の手法よりも、はるかにスムーズで信頼性の高いトレードシグナルが生成されます。 バックテストでは、この手法の有効性が証明されており、単純移動平均線のクロスオーバーと比較して優れたパフォーマンスが確認されています。過去のデータは、Fiterがさまざまな市場環境に適応し、実際の手動トレードで主要なトレンドを特定するための貴重なツールであることを示しています。 違いを体験するには、スクリーンショットを確認するか、ストラテジーテスターでインジケーターを実行してみてください。 トレードシグナルの通知を行うアラートも含まれています。
after getting indic ator cont act me for Bonus E a. Non Repaint TMA channel with special conditioned arrows on price cross of channel lines plus market Volatility factor, which makes product much more accurate than any usual tma channel indicators.  It is proven to be profitable with Ea built based on it which you will get as a BONUS in case of indicator purchase. Good luck.
MRA Index インジケーター概要 ボーナス特典: インジケーターを購入すると、「MRA Index EA」を無料で入手できます。 最適化戦略: スキャルピングでは、過去12か月間のデータを基に設定を最適化し、次の1か月間使用します。この方法は非常に効果的であることが証明されています。 重要な注意点: デフォルト設定は視覚化のみを目的としており、収益性のために最適化されていません。適切な最適化手順は購入者のみに提供されます。 「MRA Index」インジケーターについて: 「MRA Index」は、多様な市場動向とエントリーポイントを特定するのに役立つ多機能なFXインジケーターです。専門的なチャネルと、その中を移動する動的なハイブリッドラインを備えており、売買シグナルを生成します。 主な特徴: 動的ハイブリッドライン: チャネル内を移動し、取引シグナルの基盤となります。 買い・売りシグナル: ハイブリッドラインとチャネルの特定の相互作用に基づいて生成され、市場の反転の可能性を示します。 カスタマイズ: さまざまな入力パラメーターを調整して、トレーダーの戦略に適応できます。 オプショ
MetaTrader 4 (MT4)のローソク足パターンインジケーター このカスタマイズ可能なインジケーターは、主要な強気および弱気のローソク足パターンを特定し、トレーダーのテクニカル分析と意思決定をサポートします。 主な機能: パターン検出 : 強気 : ハンマー、強気の包み足、モーニングスター、三兵、強気のハラミ、逆ハンマー。 弱気 : 流れ星、弱気の包み足、イブニングスター、三羽ガラス、弱気のハラミ、首吊り線。 カスタマイズ : 戦略に応じて特定のパターンを有効または無効にできます。矢印でパターンを表示(強気は青、弱気は赤)、サイズや間隔も調整可能です。 移動平均線の統合 : 任意で移動平均線をチャートに表示できます(期間、方法、時間枠、適用価格の設定が可能)。 アラートシステム : 検出されたパターンに対して、画面メッセージ、音声、プッシュ通知、メールアラートを提供します。 複数パターン検出: 収束 : 1つのローソク足に複数のパターンを表示し、強力なシグナルを示します。 強気の収束 : 複数の青い矢印は、上昇トレンドの強化を示します。 弱気の収束 : 複数の赤い矢印は、下降ト
Chart Patterns All in One」をデモモードでお試しいただき、ボーナスを獲得してください。デモモードで試した後、メッセージを送っていただければボーナスをお渡しします。 購入後にコメントを残すと、高品質なインジケーター8つをボーナスとして受け取れます。 Chart Patterns All-in-One インジケーターは、トレーダーがテクニカル分析で一般的に使用されるさまざまなチャートパターンを視覚化するのに役立ちます。このインジケーターは市場の潜在的な動きを特定するのに役立ちますが、収益性を保証するものではありません。購入前にデモモードでテストすることをお勧めします。 現在のオファー : 「Chart Patterns All in One」インジケーターが50%割引。 含まれるパターン : 1-2-3 パターン : 3つの主要なポイント(高値または安値)を使用して市場の反転を検出します。 買い : 2つの連続する安値の後に、前の高値よりも低い高値が出現。 売り : 2つの連続する高値の後に、前の安値よりも高い安値が出現。 可視化 : 特定されたポイントを線と矢印
「Candle Info」インジケーターは、MetaTrader 4 (MT4) で直接チャート上にローソク足の重要なフォーメーションを分析し、可視化するためのツールです。高値更新 (HH)、安値更新 (LL)、高値切り上げ (HL)、安値切り下げ (LH) といったフォーメーションを検出し、相場のトレンドや価格変動の洞察を提供します。     主な機能: - **ローソク足フォーメーション:** HH、LL、HL、LH のフォーメーションを検出し、ラベル表示。また、HH & HL(上昇トレンド)や LL & LH(下降トレンド)などの組み合わせも識別します。 - **セッションフィルター:** 主要な取引セッション(東京、ロンドン、ニューヨーク、シドニー)に基づいてフォーメーションをフィルタリングし、市場の重要な時間帯に集中できます。 - **アラート機能:** 新しいフォーメーションを通知するため、画面上のアラート、プッシュ通知、メール通知、音声アラートを設定可能です。 - **カスタマイズ:** テキストの色やサイズを調整し、表示するセッションやフォーメーションを選択できま
このインジケーターはテスターではなく、ライブチャート用です。 PRO Trend Divergence インジケーターは、 トレンド継続のダイバージェンス を検出するための高度なテクニカル分析ツールです。これは、現在のトレンドが今後も続く可能性を示すシグナルです。一般的なインジケーターがトレンドの反転に焦点を当てるのに対し、このツールは、一時的な押し目や調整中であってもトレンドが依然として強いままである市場状況を特定するのに役立ちます。 トレンド継続のダイバージェンス は、価格がトレンドに沿って動く(上昇トレンドでは安値が高く、下降トレンドでは高値が低くなる)一方で、選択されたインジケーターが逆方向に動くことで確認されます。これにより、トレンドが今後も続くことが示されます。 PRO Trend Divergence インジケーターは、トレーダーが自信を持ってトレンドを追い、早すぎる退出を避けるのに役立ちます。 特徴とメリット 複数のインジケーターに対応 MACD、RSI、Stochastic、CCI、Momentum、OBV、VW-MACD、CMF、MFI に対応。 チャート上の視覚
SpeedAngle インジケーター は、MetaTrader 4 (MT4) 用の高度なツールで、価格の動きの角度を計算し、動的な視覚的ヒントやカスタマイズ可能なアラートを提供します。これにより、トレーダーはトレンドの反転やモメンタムの変化を簡単に特定できます。 主な機能 角度ベースのトレンド分析: ユーザーが指定した期間に基づいて角度を計算し、価格のモメンタムと方向を表示します。 動的な視覚表現: 計算された角度に応じて色が変化するサークルを表示: LevelMax を超える場合: 強い上昇モメンタムを示します。 LevelMin を下回る場合: 強い下降モメンタムを示します。 範囲内の場合: レンジ相場や弱い動きを示します。 カスタマイズ可能なアラート: 「極値から」または「中間から」のシナリオを選択し、音声、メール、プッシュ通知でアラートを提供。 売買シグナルの矢印: オプションで売買の可能性を示す矢印を表示。 高い柔軟性: レベル、色、アラート設定などを調整可能。 メリット 市場分析を簡素化: 視覚的なヒントとアラートで、重要な価格条件を素早く特定。 時間を節約: アラートに
フィルタ:
Walter Birklbauer
325
Walter Birklbauer 2025.06.02 22:12 
 

I have posted my reasoning in the discussion. I think the idea is good—if only the angles were accurate. The author has provided a somewhat misleading description, to which he responds quickly and routinely in the comments. To his credit, he did offer a goodwill version of the bonus indicator. But all of that is of no use if the angles shown in it are worthless because they change with the zoom level. That’s not an angle—it’s a dud.

Davit Beridze
11781
開発者からの返信 Davit Beridze 2025.06.03 12:32
Dear Customer Thank you for your feedback. I appreciate you taking the time to share your thoughts, and I want to clarify some points regarding your review. First and foremost, I understand your concern about the "angle accuracy" and its behavior with zoom levels. It's crucial to distinguish between the two indicators you mentioned: "MA Speedometer" (the paid indicator you received as a gift from my goodwill): This indicator, as you correctly observed, is sensitive to chart zoom levels because of how MT4 internally calculates angles from visible chart coordinates. This is a known characteristic for any indicator that calculates angles directly based on pixel distances on the chart. Due to this, as a general rule in technical analysis, it's recommended to avoid constant zooming when evaluating angles derived this way. "Ma_Speed" (the base and Bonus indicator for the Dashboard you purchased): As explicitly stated in the product description and shown in the screenshots, the Dashboard is built upon a different, specially designed version of the "MA Speedometer" concept. This "Ma_Speed" indicator uses a different calculation methodology that is not affected by chart zoom levels. Its angle calculation is based on price points relative to the _Point property, ensuring consistency regardless of your chart's zoom setting. This is why it serves as the reliable base for the Dashboard's multi-symbol and multi-timeframe analysis. My intention in providing you with the "MA Speedometer" (the first indicator) as a complimentary bonus was an act of goodwill, thinking it might offer additional value or insights. However, it appears there was a misunderstanding, and you were comparing the Dashboard's readings (which come from the zoom-independent "Ma_Speed" indicator) with the zoom-sensitive "MA Speedometer." These are distinct products with different underlying calculation methods for their visual angles. I am always committed to providing clear product descriptions and supporting my users. I believe the description for the Dashboard accurately reflects its functionality and the underlying indicator it uses. The "Ma_Speed" indicator, which the Dashboard is built upon, is indeed designed to provide consistent angle readings, unaffected by zoom. I hope this clarification helps resolve the misunderstanding. If you have any further questions or if there's anything else I can do to assist you with the "Dashboard," please do not hesitate to contact me directly. I am here to ensure you have a positive experience with my products. Sincerely.
lauro1956
5752
lauro1956 2024.09.10 13:08 
 

ユーザーは評価に対して何もコメントを残しませんでした

Ross Rodgers
158
Ross Rodgers 2024.05.11 21:24 
 

Great dashboard based on the innovative idea of MA angle changes on various instruments desired. The steeper the MA angle, the greater the momentum. Find the instruments with best momentum. Very clever idea. The bonus indicator is very helpful and gives great signals based on the same concept of MA angles, fully customizable.

Davit Beridze
11781
開発者からの返信 Davit Beridze 2024.05.11 21:25
Thanks Ross
レビューに返信