Auto Optimized Bollinger Bands
- 指标
- 版本: 1.9
- 更新: 4 八月 2025
- 激活: 5

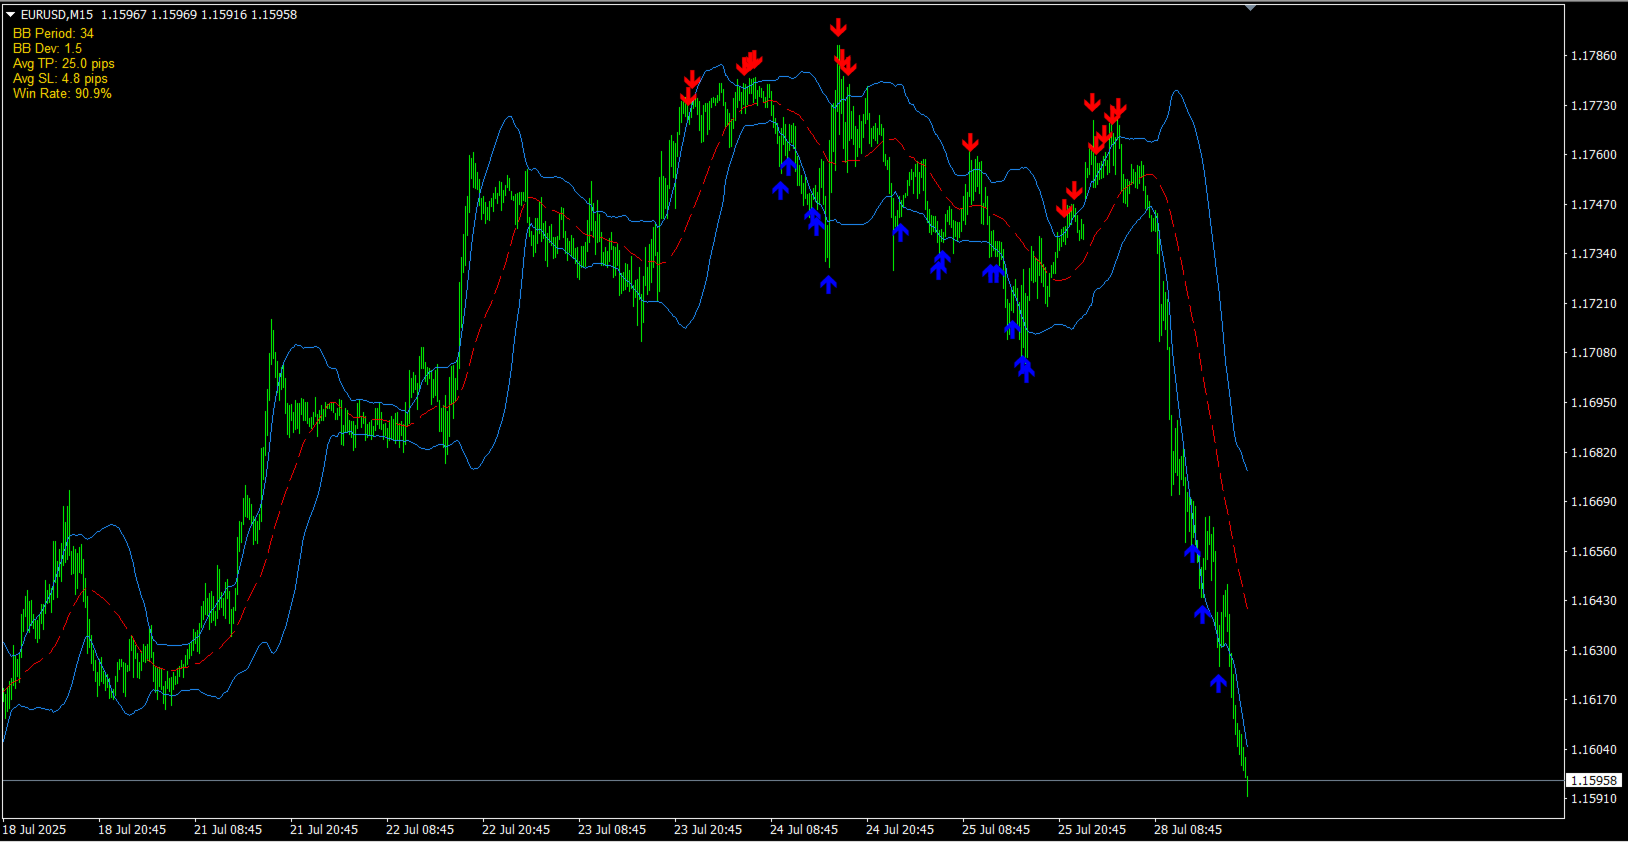
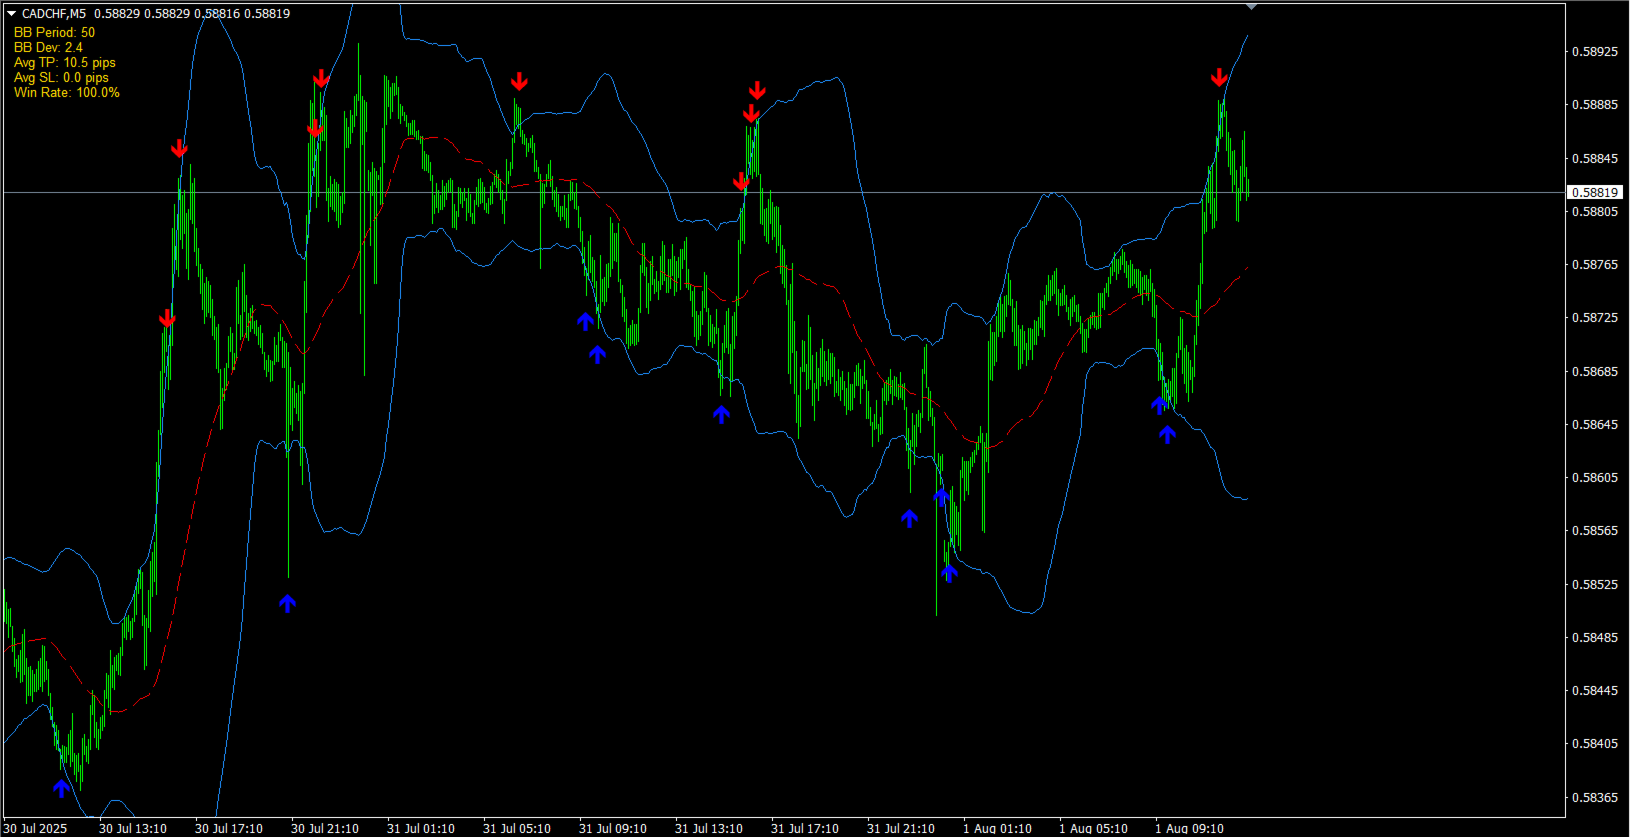
Auto Optimized Bollinger Bands – 适用于真实市场的自适应波动性工具
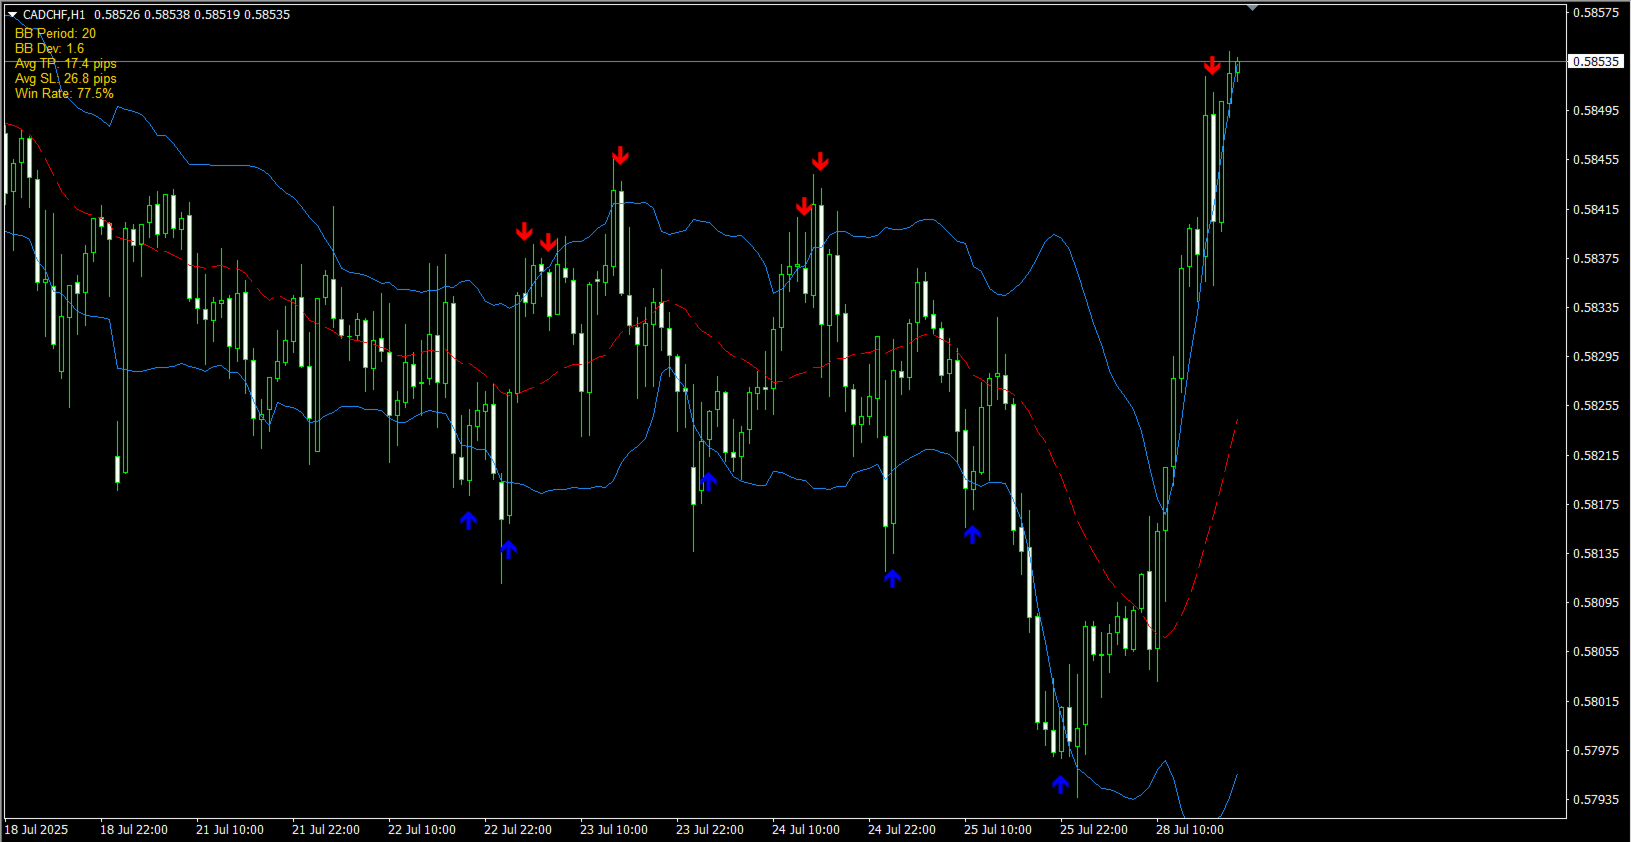
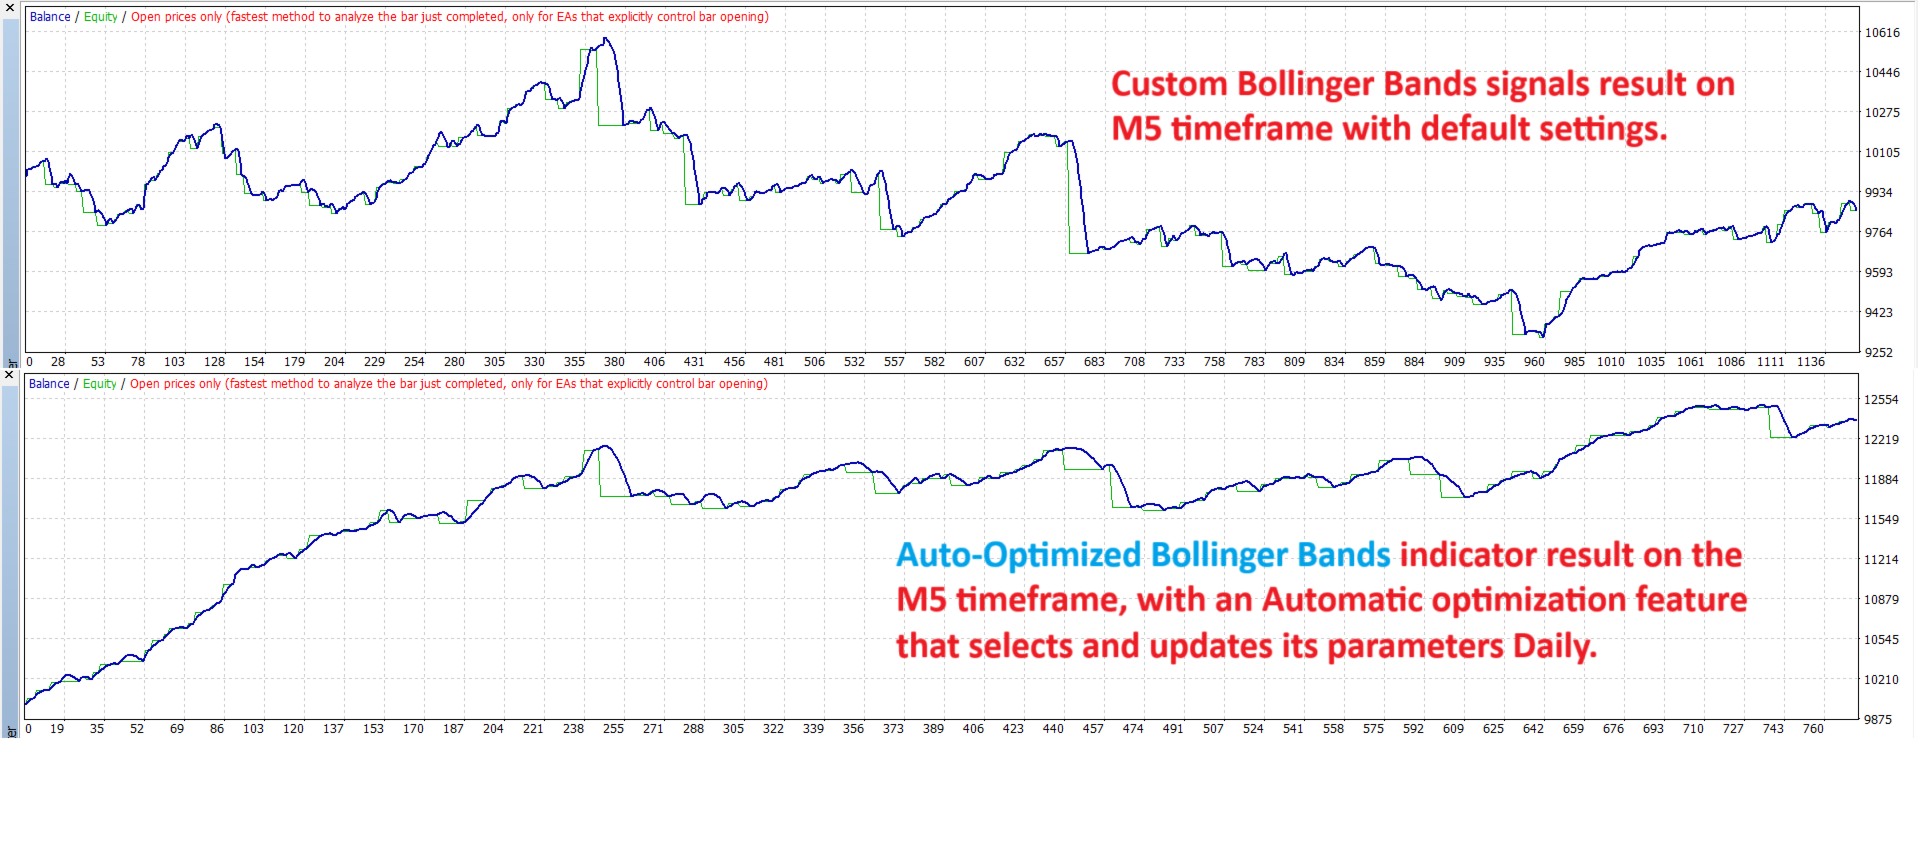
Auto Optimized Bollinger Bands 是一款先进的 MT4 指标,通过历史交易模拟,自动选择最优的布林带周期和偏差设置,从而改进了传统的布林带方法。
该指标不是使用固定参数,而是实时优化,根据实际市场行为寻找最有效的设置,使布林带能够根据波动性和价格结构的变化动态调整,无需手动调节。
主要功能:
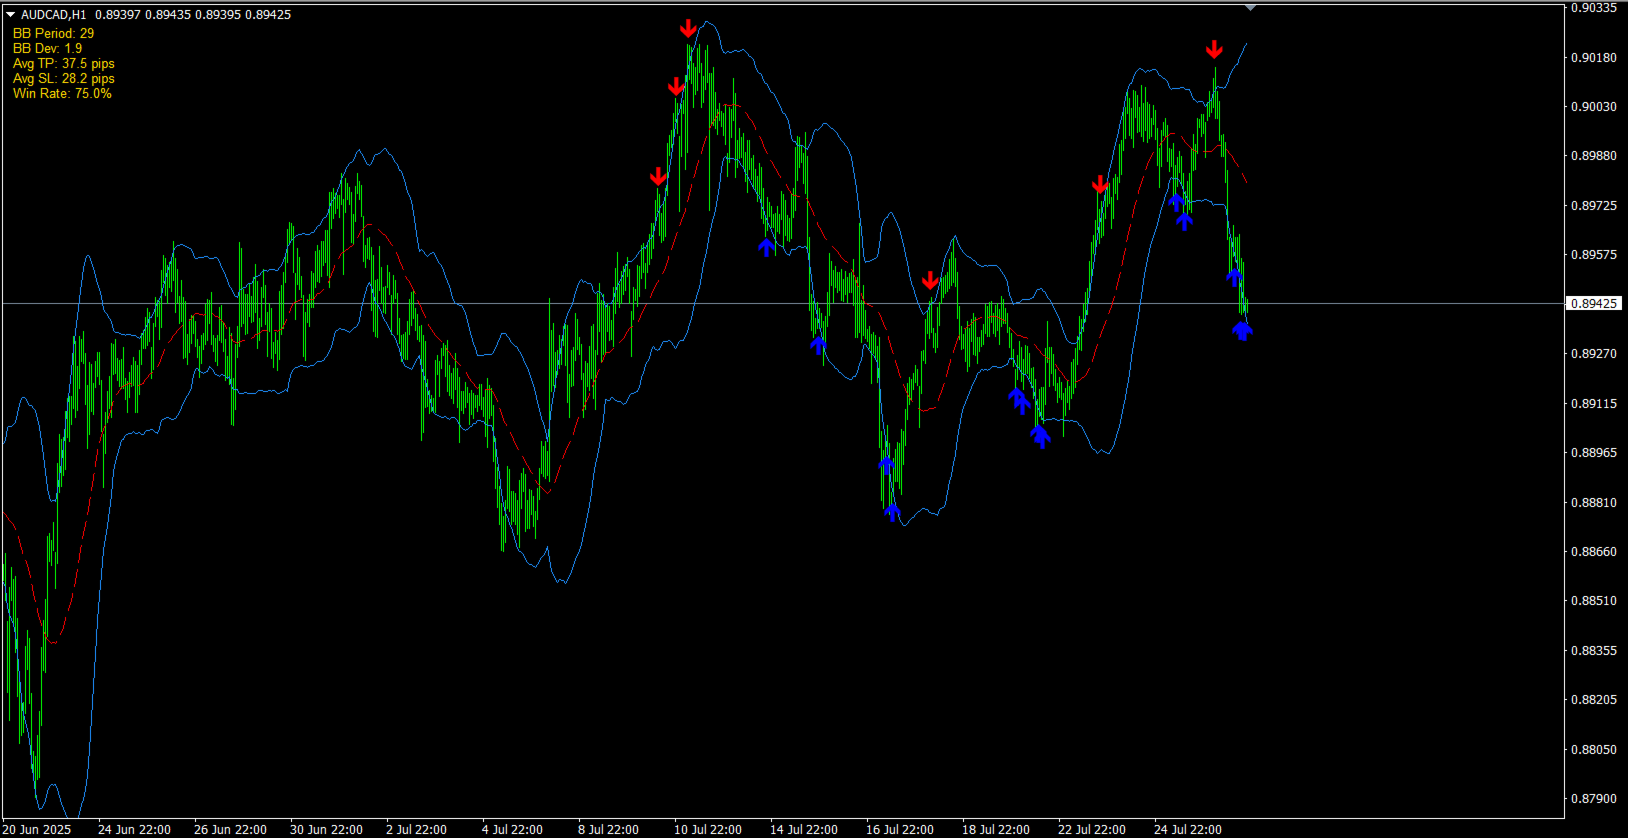
- 基于历史表现自动寻找最优布林带参数
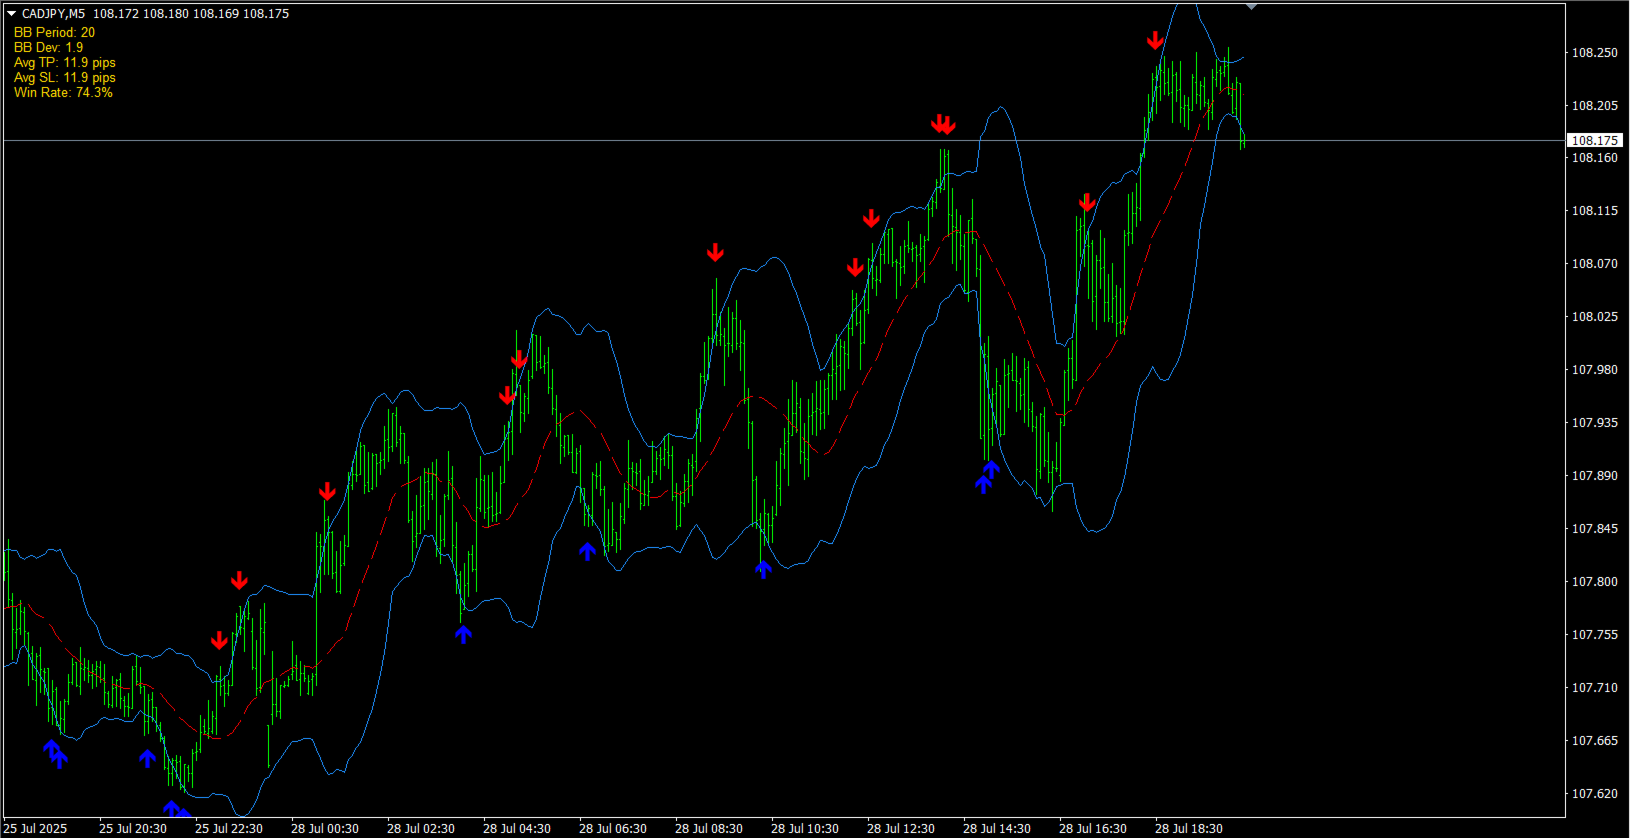
- 在关键价格反转点显示自适应买入/卖出箭头信号
- 内置提示功能:声音、弹窗、推送通知
- 优化深度、显示方式和信号参数均可自定义
- 适用于外汇、黄金、指数、加密货币等市场
本工具非常适合日内交易者和波段交易者,提供比传统固定设置更智能的波动性交易方式。


I like the indicator at the moment. I'm using it in my trading. Thanks to the developer!!!