Ma Speedometer Dashboard
- Göstergeler
- Sürüm: 1.0
- Etkinleştirmeler: 5

Demo sürümün hiçbir faydası yoktur. Yanıp sönen sayılara bakarak hiçbir şey anlayamazsınız. Bu bir kontrol panelidir. Kavramı anlamaya çalışın, geri kalan her konuda size yardımcı olacağım.
Semboller virgüller (,) ile ayrılmalı ve parametrelere tam olarak brokerınızın gösterdiği şekilde girilmelidir, böylece panelde tanınabilirler. Bu semboller gösterge tarafından analiz için kullanılacaktır.
Tek tıklamayla herhangi bir çifti ve herhangi bir zaman dilimini doğrudan panelden açabilirsiniz.
MA Speedometer Dashboard, MetaTrader 4 (MT4) için dinamik piyasa analizi yoluyla ticaret stratejilerini geliştirmek amacıyla tasarlanmış son derece işlevsel bir göstergedir. Piyasa trendlerini tespit etmek, yatay piyasalarda işlem yapmak ve durgun piyasa koşullarından çıkmak için güçlü özellikler sunar, bunların hepsi hareketli ortalamaların açılarına dayanmaktadır. Özel bir teklif olarak, müşteriler ayrıca MA Speedometer göstergesinin özel bir sürümünü alırlar, bu gösterge MA Speedometer Dashboard’un temelini oluşturur.
Ana özellikler:
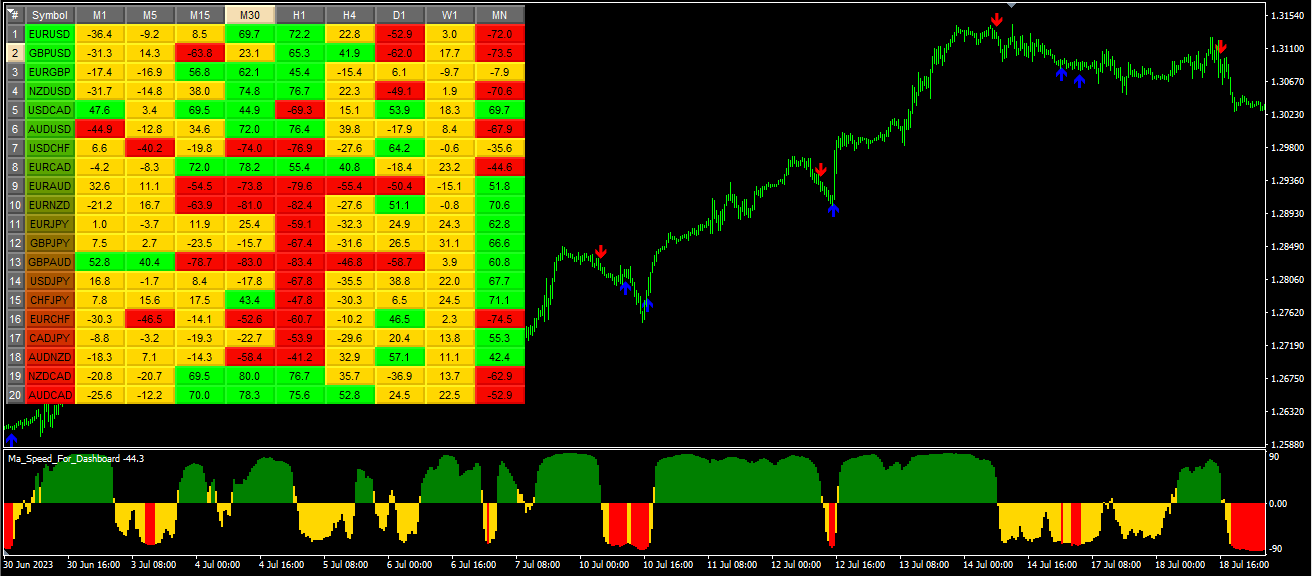
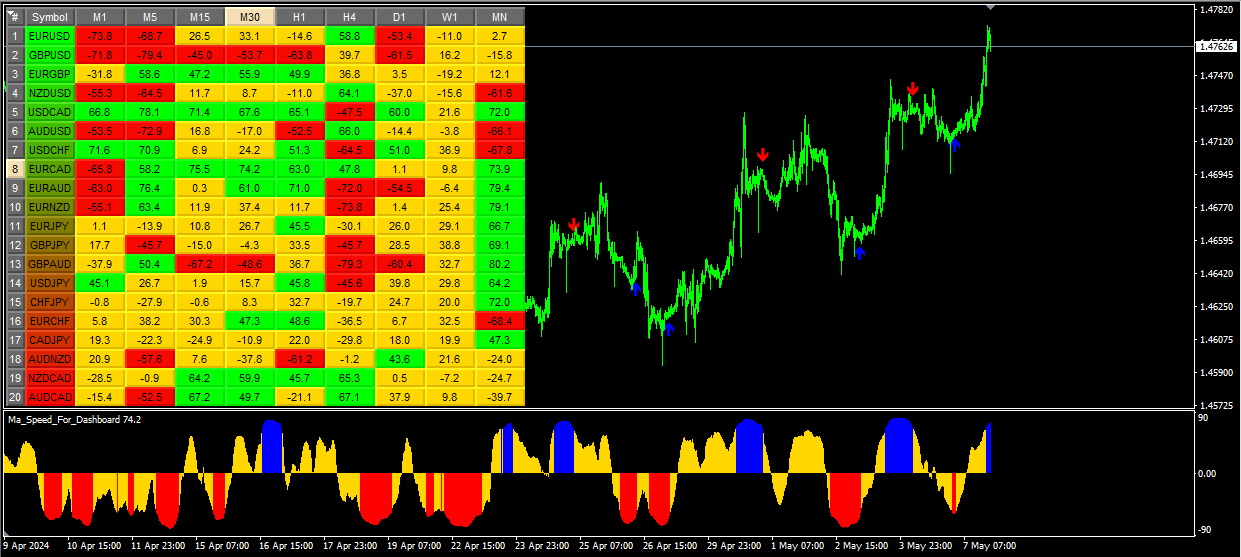
Trend analizi: Panel, potansiyel piyasa trendlerini tespit etmek için hareketli ortalamaların (MA) açılarını kullanır. Trader'lar, renk kodlu sinyaller aracılığıyla güçlü yukarı veya aşağı trendlerin başlangıcını kolayca görebilirler:
- Yeşil: Güçlü bir yukarı trendin başlangıcını gösterir ve giriş fırsatı sunar.
- Kırmızı: Güçlü bir aşağı trendin başlangıcını gösterir ve yine giriş fırsatı sunar.
- Sarı: Yatay veya durgun piyasaları işaret eder ve çıkış noktalarını önerir.
Çoklu zaman dilimi takibi: Panel, M1'den MN'ye kadar çeşitli zaman dilimlerini destekler, bu da trader'ların piyasa koşullarını hem mikro hem de geniş düzeyde analiz etmelerini sağlar. Bu özellik, gün içi işlemden uzun vadeli yatırıma kadar çeşitli ticaret stilleri için uygundur.
Etkileşimli panel: Etkileşimli arayüz, trader'ların farklı döviz çiftleri ve zaman dilimleri arasında hızlıca geçiş yapmalarına olanak tanır. Panelde bir yere tıkladığınızda, MT4 seçilen döviz çifti ve zaman dilimi için otomatik olarak bir grafik açar, bu da kullanım kolaylığı ve verimliliği artırır.
Özelleştirilebilir parametreler: Trader'lar, hareketli ortalama periyodunu, yöntemini ve açı eşiklerini özelleştirerek paneli tercih ettikleri ticaret stratejilerine uyarlayabilirler. Bu esneklik, aracı farklı piyasa koşullarına ve ticaret yaklaşımlarına adapte edilebilir hale getirir.
Görsel uyarılar: Panelin sezgisel tasarımı, çeşitli piyasa koşulları için görsel uyarılar ve kolayca okunabilen etiketler içerir. Bu özellik, trader'ların durumu hızlıca kavramalarına ve daha bilinçli kararlar almalarına yardımcı olur.
Özel teklif: Özel bir teklif olarak, müşteriler MA Speedometer göstergesinin benzersiz bir sürümünü hediye olarak alırlar. Bu gösterge, panelin temelini oluşturur ve daha ayrıntılı analizler yapmayı sağlar.
Her bir giriş parametresinin açıklaması:
- Symbols: Bu parametre, virgüller (,) ile ayrılmış semboller listesini belirleyebileceğiniz bir dize girişidir. Bu semboller gösterge tarafından analiz için kullanılacaktır.
- StartBar: Bu parametre, hareketli ortalama açısını hesaplamaya başlamak için başlangıç çubuğunu temsil eden bir tam sayı girişidir.
- MaPeriod: Bu parametre, hareketli ortalama hesaplamasında kullanılan periyodu temsil eden bir tam sayı girişidir.
- MaMethod: Bu parametre, hareketli ortalama hesaplaması için kullanılan yöntemi temsil eden bir seçim girişidir. Basit Hareketli Ortalama (SMA), Üstel Hareketli Ortalama (EMA) gibi seçenekler içeren ENUM_MA_METHOD'dan bir değer alabilir.
- Level_Up_M1'den Level_Dn_MN1'e kadar: Bu parametreler, çeşitli zaman dilimleri (M1'den MN1'e kadar) için üst ve alt seviyeleri temsil eden tam sayı girişleridir. Hareketli ortalamanın açısına bağlı olarak düğmelerin arka plan rengini belirlemek için kullanılırlar.
- X-Size ve Y-Size: Bu parametreler, sırasıyla düğmelerin genişliğini ve yüksekliğini temsil eden tam sayı girişleridir.
Özet: MA Speedometer Dashboard, trend trader'ları ve yatay piyasaları tercih eden trader'lar için kapsamlı bir piyasa analizi aracı sunar. Esnekliği, etkileşimli arayüzü ve özelleştirilebilir parametreleri sayesinde, herhangi bir trader'ın ticaret araç setine değerli bir katkı sağlar ve forex piyasasının karmaşıklıklarında daha hassas ve bilgiye dayalı bir şekilde gezinmeye yardımcı olur.


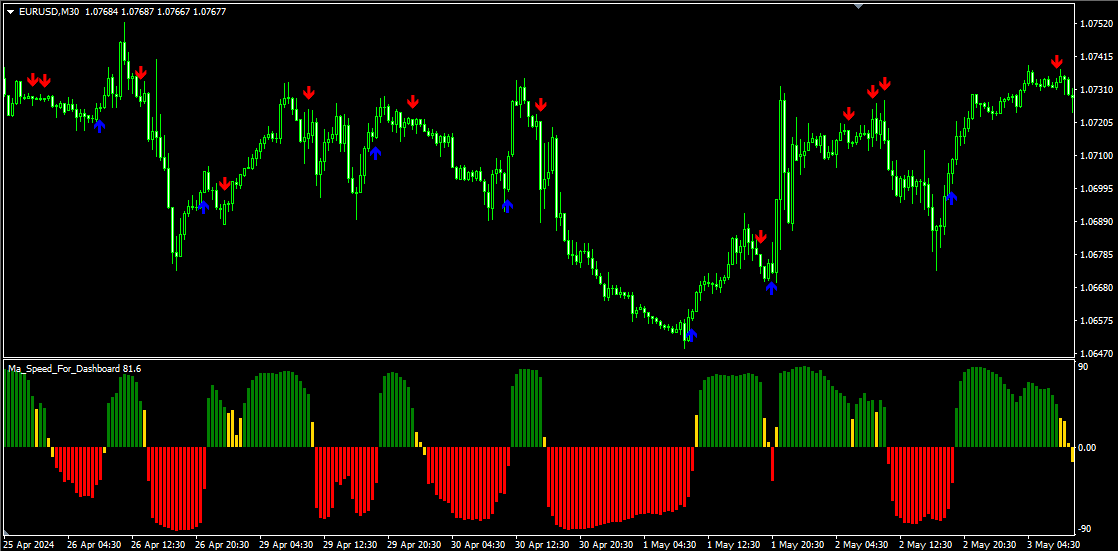

Great dashboard based on the innovative idea of MA angle changes on various instruments desired. The steeper the MA angle, the greater the momentum. Find the instruments with best momentum. Very clever idea. The bonus indicator is very helpful and gives great signals based on the same concept of MA angles, fully customizable.