Filtered TMA Arrows

3.8

Check my paid tools they work perfect

please rate

Here is an Upgraded version with Bonus Ea in case of purchase it costs 30$ only and you get Ea as Bonus: https://www.mql5.com/en/market/product/96835

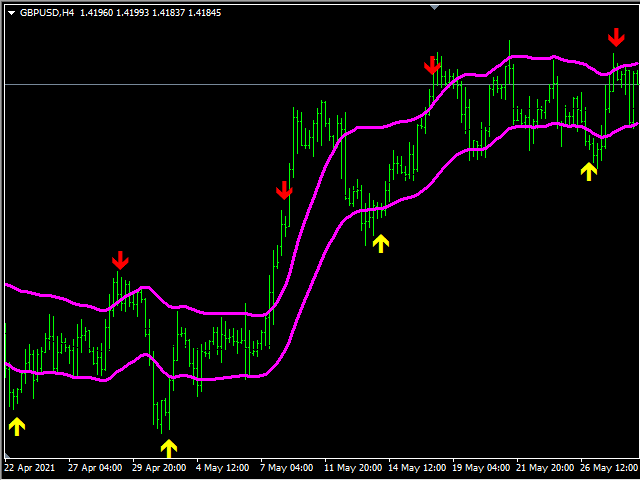
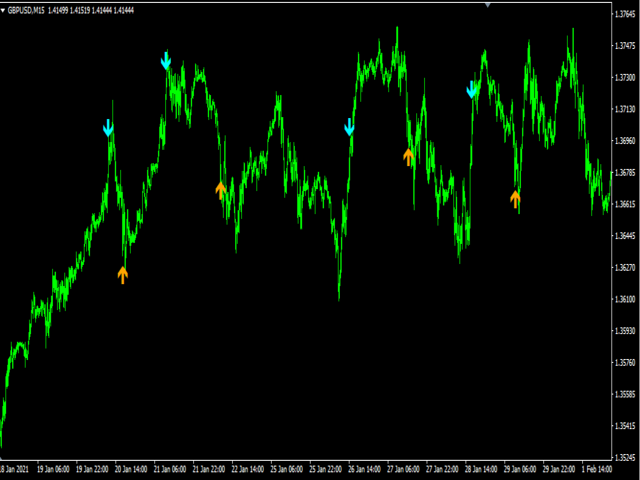
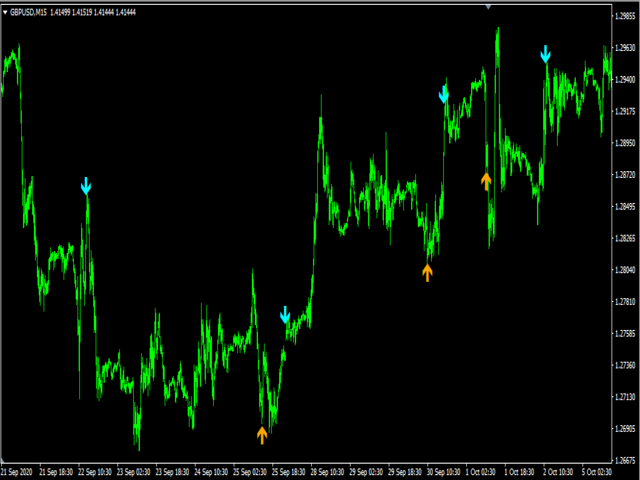
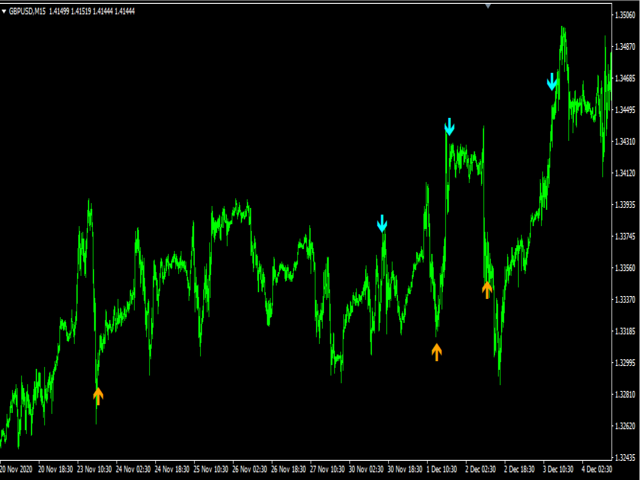
This indicator is experimetal, it shows TMA channel arrows with Volatility filter built in to avoid lagging. Try to experiment with it, search for better conditions of use. It is possible to adjust different timeframes for TMA and for Volatility filter Same time on the current chart, so it makes indicator flexible to avoid wrong entries and be more exact!. If sharp trend situations are bad for TMA channel, they can be good for Volatility entries so both these same time can filter out wrong entry points and make channel much smoother. lets discuss it in comments :) if anyone finds out interesting set files share in comments section. Indicator Does Not Repaint! thats important.

评分 5
xxcoincoin
45
xxcoincoin 2023.08.21 14:47 
 

Really good indie well done ! Can be really useful !

rainwalker123
3433
rainwalker123 2021.05.26 10:39 
 

Did some trades, and the indicator predicts big movements, even in the M1 timeframe. Higly recommended

IK02XXyn
167
IK02XXyn 2024.11.09 13:37 
 

Gracias por compartir, da muy buenas señales de entrada y salidas

推荐产品
Wise Men Indicator demo
Bohdan Kasyanenko
3 (2)
The indicator displays signals according to the strategy of Bill Williams on the chart. Demo version of the indicator has the same features as the paid, except that it can work only on a demo account . Signal "First Wise Man" is formed when there is a divergent bar with angulation.  Bullish divergent bar - with lower minimum and closing price in the upper half. Bearish divergent bar - higher maximum and the closing price at the bottom half. Angulation is formed when all three lines of Alligator
FREE
PZ The Zone
PZ TRADING SLU
4.33 (3)
This indicator displays buy or sell signals according to Bill Williams' definition of the Trading Zone. [ Installation Guide | Update Guide | Troubleshooting | FAQ | All Products ] Easy to use and understand Avoid trading flat markets Deterministic indicator with clear rules The indicator is non-repainting It implements alerts of all kinds It has straightforward trading implications. A blue arrow is a buy signal A red arrow is a sell signal According to Bill Williams trading in the zone helps to
FREE
Follow The Line
Oliver Gideon Amofa Appiah
3.94 (16)
FOLLOW THE LINE GET THE FULL VERSION HERE: https://www.mql5.com/en/market/product/36024 This indicator obeys the popular maxim that: "THE TREND IS YOUR FRIEND" It paints a GREEN line for BUY and also paints a RED line for SELL.  It gives alarms and alerts of all kinds. IT DOES NOT REPAINT and can be used for all currency pairs and timeframes. Yes, as easy and simple as that. Even a newbie can use it to make great and reliable trades. NB: For best results, get my other premium indicators for more
FREE
Basic Harmonic Pattern
Mehran Sepah Mansoor
4.58 (59)
该指标可识别预测市场反转点的最常用谐波形态。这些谐波形态是外汇市场上不断重复出现的价格形态,暗示着未来可能的价格走势/ 免费 MT5 版本 此外,该指标还内置了市场进入信号以及各种止盈和止损。需要注意的是,虽然谐波形态指标本身可以提供买入/卖出信号,但建议您使用其他技术指标来确认这些信号。例如,在进行买入/卖出之前,您可以考虑使用 RSI 或 MACD 等震荡指标来确认趋势方向和动能强度。 该指标的仪表盘扫描器:( Basic Harmonic Patterns Dashboard ) 包括的谐波形态 加特里 蝶形 蝙蝠型 螃蟹 鲨鱼 赛弗 ABCD 主要输入 Max allowed deviation (%): 该参数是指谐波图形形成时的允许偏差。该参数决定了谐波图样的结构可以变化多少,而指标不会将其视为有效图样。因此,如果设置的百分比越高,则模式识别的灵活性就越大,而如果设置的值越低,则限制性就越大。例如:如果设定值为 30%,那么指标将把当前价格 ±30% 范围内符合形态比例的形态视为有效形态。 Depth: 该参数决定了谐波形态的每个波浪中必须出现的最少条数,也就
FREE
Fibomathe for MT4
Almaquio Ferreira De Souza Junior
Fibomathe Indicator: Support and Resistance Tool for MT4 The Fibomathe Indicator is a technical analysis tool designed for MetaTrader 4 (MT4) that assists traders in identifying support and resistance levels, take-profit zones, and additional price projection areas. It is suitable for traders who use structured approaches to analyze price action and manage trades. Key Features Support and Resistance Levels: Allows users to define and adjust support and resistance levels directly on the chart. L
FREE
Pin Bars
Yury Emeliyanov
5 (4)
主要用途:"Pin Bars"旨在自动检测金融市场图表上的pin bars。 针杆是具有特征主体和长尾的蜡烛,可以发出趋势反转或修正的信号。 它是如何工作的:指标分析图表上的每个蜡烛,确定蜡烛的身体,尾巴和鼻子的大小。 当检测到与预定义参数相对应的引脚柱时,指示器会根据引脚柱的方向(看涨或看跌)在图表上用向上或向下箭头标记它。 参数: TailToBodyRatio-定义尾部长度和针杆主体尺寸之间的最小比率。 NoseToTailRatio-设置"鼻子"和销杆尾部之间的最大允许比率。 ArrowSize-定义标记的pin条与图表上指向它的箭头之间的距离。 应用:"Pin Bars"指标可用于识别潜在的趋势反转点,并产生进入市场或平仓的信号。 当正确使用并与其他技术指标和分析方法相结合时,该指标能够改善交易结果。 其他产品 :   https://www.mql5.com/ru/users/yura1994ru/seller#products 重要事项: 该指标不是一个现成的交易系统,应该与其他分析工具结合使用。 建议在真实账户上使用指标之前,先在历史数据上测试和优化指标的参数。
FREE
Ppr PA
Yury Emeliyanov
4.5 (2)
"Ppr PA" is a unique technical indicator created to identify "PPR" patterns on the currency charts of the MT4 trading platform. These patterns can indicate possible reversals or continuation of the trend, providing traders with valuable signals to enter the market. Features: Automatic PPR Detection:   The indicator automatically identifies and marks PPR patterns with arrows on the chart. Visual Signals:   Green and red arrows indicate the optimal points for buying and selling, respectively. Ar
FREE
Double HMA lines MTF
Pavel Zamoshnikov
5 (1)
This is a multi-timeframe version of the popular Hull Moving Average (HMA). The Double HMA MTF Light indicator combines two timeframes on a single chart. The HMA of the higher timeframe defines the trend, and the HMA of the current timeframe defines short-term price movements. The indicator is freely distributed and hasn't audio signals or messages. Its main function is the visualization of price movements. If you need advanced functionality of the HMA multi-timeframe indicator (information ab
FREE
Extremum Reverse Bar
Yurij Izyumov
2.8 (5)
This indicator has been created for finding the probable reversal points of the symbol price. A small candlestick reversal pattern is used it its operation in conjunction with a filter of extremums. The indicator is not redrawn! If the extremum filter is disabled, the indicator shows all points that have a pattern. If the extremum filter is enabled, the condition works – if the history Previous bars 1 candles back contains higher candles and they are farther than the Previous bars 2 candle, such
FREE
Sm Ichimoku Scanner
Steeve Christian Martol
5 (5)
Multi Time Frame Indicator acts as a Scanner based on the Ichimoku Trading System. The outcome is displayed on a board. This helps you to make "at a glance" a mental picture of the System without having to open the chart. Up to 10 Currencies can be watched. Scanned elements And Legend "KUMO Futur" - Green : The Kumo Futur is Bullish. "KUMO Futur" - Red : The Kumo Futur is Bearish. "PRICE Cross KJ" - Green : The Price is Above the Kijun Sen.  "PRICE Cross KJ" - Red : The Price is Below the Kijun
FREE
WH Price Wave Pattern MT4
Wissam Hussein
4.4 (5)
Welcome to our   Price Wave Pattern   MT4 --(ABCD Pattern)-- The ABCD pattern is a powerful and widely used trading pattern in the world of technical analysis. It is a harmonic price pattern that traders use to identify potential buy and sell opportunities in the market. With the ABCD pattern, traders can anticipate potential price movements and make informed decisions on when to enter and exit trades. EA Version : Price Wave EA MT4 MT5 version : Price Wave Pattern MT5 Features :  Automatic
FREE
PZ Pivot Points
PZ TRADING SLU
4.6 (10)
This indicator displays pivot points in the chart, including historical vales, and supports many calculation modes for Pivot Points and S/R levels. [ Installation Guide | Update Guide | Troubleshooting | FAQ | All Products ] It plots historical levels for backtesting purposes It allows you to select the reference timeframe It implements different Pivot Point calculation modes It implements different SR calculation modes It implements customizable colors and sizes Calculation Modes The indicator
FREE
Market Profile 3
Hussien Abdeltwab Hussien Ryad
3 (2)
Market Profile 3 MetaTrader 4 indicator  — is a classic Market Profile implementation that can show the price density over time, outlining the most important price levels, value area, and control value of a given trading session. This indicator can be attached to timeframes between M1 and D1 and will show the Market Profile for daily, weekly, monthly, or even intraday sessions. Lower timeframes offer higher precision. Higher timeframes are recommended for better visibility. It is also possible t
FREE
PREVIOUS INDICATOR’S DATA MA CROSSOVER https://www.mql5.com/en/users/earobotkk/seller#products P/S: If you like this indicator, please rate it with 5 stars in the review section, this will increase its popularity so that other users will be benefited from using it. This indicator notifies and draws an arrow on the chart whenever    the MA line has crossed over its previous indicator’s data MA filtered by MA Trend.   It also displays total pips gained from all the entry set-ups. Setting ·   You c
FREE
Major Support and Resistance Zones
Mohammad Abbas Mohammad Dashti
This indicator provides a clean, visual-first approach to identifying key support and resistance levels by distinguishing between price rejection (the wicks) and established value (the bodies). By isolating these two areas into minimalist rectangle zones, it allows you to see exactly where the market is most likely to react without the clutter of price labels or unnecessary statistics. Key Features Wick vs. Body Logic : Automatically calculates the gap between the highest/lowest candle bodies an
FREE
FlatBreakout
Aleksei Vorontsov
FlatBreakout (Free Version) Flat Range Detector and Breakout Panel for MT4 — GBPUSD Only FlatBreakout is the free version of the professional FlatBreakoutPro indicator, specially designed for flat (range) detection and breakout signals on the GBPUSD pair only. Perfect for traders who want to experience the unique fractal logic of FlatBreakout and test breakout signals on a live market without limitations. Who Is This Product For? For traders who prefer to trade breakout of flat ranges (breakout,
FREE
PZ Chart Overlay
PZ TRADING SLU
5 (1)
图表覆盖 指标在同一张图表上显示几种工具的价格走势,使您能够评估货币对相对彼此波动的差异。 [ 安装指南 | 更新指南 | 故障排除 | 常见问题 | 所有产品 ] 轻松找到超买或超卖的货币对 在同一图表上绘制最多六个货币对 必要时显示倒置符号 适应图表大小,缩放和时间表 自动价格水平计算 可定制的价格水平密度 可自定义的颜色和尺寸 什么是反向货币对? 反转货币对意味着显示两种货币之间的汇率,从而反转交易的主要货币。例如,如果要将EURUSD,GBPUSD和USDJPY绘制到同一覆盖图中,则有必要反转USDJPY以使价格反映反向汇率:JPYUSD。这样,日元/美元价格将与覆盖图的其他两个符号呈正相关关系移动,从而使图表更易于研究。 测试指标 该指标使用来自多个交易品种的价格数据绘制单个图表。由于MetaTrader 4测试仪(在撰写本文时)不支持多货币回溯测试,因此该指标无法回溯测试,因为它将不会收到来自其他本应覆盖的交易品种的报价。要测试它,请租用一个月。 输入 符号设置-键入要在覆盖图上显示的货币对或符号的名称。您需要至少输入其中之一,以便覆盖图具有两个货币对(本机和外
FREE
Adjustable Fractal MT4
Dmitry Timin
4.76 (25)
Adjustable Fractal MT4 is a modification of Bill Williams' Fractals indicator. The fractal consists of a two sets of arrows - up (upper fractals) and down (lower fractals). Each fractal satisfies the following conditions: Upper fractal - maximum (high) of a signal bar exceeds or is equal to maximums of all bars from the range to the left and to the right; Lower fractal - minimum (low) of a signal bar is less or equal to minimums of all bars from the range to the left and to the right. Unlike a s
FREE
StrikePin
Mike Pascal Plavonil
1 (1)
The StrikePin indicator is a technical, analytical tool designed to identify trend reversals and find optimal market entries.  The StrikePin indicator is based on the pin bar pattern, which is the Price Action reversal pattern. An entry signal, in a trending market, can offer a very high-probability entry and a good risk to reward scenario. Be careful: the indicator is repainting since it is looking for highest high and lowest lows.  You should avoid to use it in experts but you can use it in
FREE
How would you like to instantly know what the current trend is? How about the quality of that trend? Finding the trend on a chart can be subjective. The Fractal Trend Finder indicator examines the chart for you and reveals what the current trend is based on objective criteria. Using the Fractal Trend Finder you can easily tell if you are trading with the trend or against it. It also identifies those times when the market is not trending. Theoretically, you could trade with the trend when the tre
FREE
The Magic SMA indicator is of great help in determining trend direction. It can be an excellent addition to your existing strategy or the basis of a new one. We humans can make better decisions when we see better visually. So we designed it to show a different color for rising and falling trends. Everyone can customize this in the way that suits them best. By setting the Trend Period, we can optimize it for longer or shorter trends for our strategy. It is great for all time frames. IF YOU NEED
FREE
Stoch–Cross Scalper is an Expert Advisor based on the Stochastic oscillator indicator using the 80 threshold as overbought and 20 as oversold while utilizing a 14 day rolling period to analyze High and Low closing prices in relation to the current close price. The Stochastic oscillator is a commonly used indicator and many trading philosophies are based upon it. This expert is the result of over ten years of my fine tuning and perfecting this trading system. Almost all of the indicators availabl
FREE
和谐图案最适合预测市场转折点。和谐图案为您提供高胜率和一天内的高交易机会。 该指标识别了最受欢迎的和谐图案,这些图案预测市场反转点。 基于和谐交易书籍。 重要说明: 该指标不会重绘或滞后(它在D点检测到模式);它不会重新绘制(模式要么有效,要么取消)。 使用方法: 将指标拖放到您的MT5图表上。 将模式检测设置为TRUE(ABCD; Gartley)。 根据您的喜好调整偏差(较大的偏差=更多的模式;较小的偏差=更少的模式)。 根据您的喜好自定义颜色。 根据需要启用或禁用关于入场点、TP和SL的警报。 检测到模式时: 该算法在D点检测到模式。 如果启用了警报,它将通知您检测到的模式。 如果模式无效,则触发一个带有“模式已取消”消息的警报。 成功的模式在蜡烛关闭时触发“入场警报”。 如果价格达到TP1、TP2、TP3、TP4或SL,则会发出带有终端消息的警报。 价格现在为40美元,仅剩下几份副本,最终价格将为70美元。 发展计划: 该指标的当前版本(1.1)将检测Gartley和ABCD模式。 版本1.1将包括Butterfly、Bat和Crab模式。 未来版本将包括其他模式、潜在PRZ检
FREE
The Auto Fibonacci Indicator is a professional technical analysis tool that automatically draws Fibonacci retracement levels based on the most recent closed Daily (D1) or 4-Hour (H4) candle. These levels are widely used by traders to identify key support , resistance , and trend reversal zones . This version is designed for manual trading and supports a powerful trading strategy using Fibonacci levels combined with a 50-period EMA (Exponential Moving Average) , which you can easily add from MT4
FREE
BE auto
Muhammad Ridzuan Mohd Radzali
5 (2)
Indicator automatically draw bullish and bearish engulfing without any rules. Bearish and Bullish engulf is well known area for supply and demand area marking. This indicator can be used in any strategy that required supply demand zone. Show Last Engulf : Enable this option to show unfresh engulfing  Candle to calculate : set 0 will load all history bar and can use up more memory Bearish Engulfing Colour : Pick any colour that suit Bearish Engulfing Colour  : Pick any colour that suit -Use this
FREE
Two Period RSI
Libertas LLC
5 (4)
Two Period RSI compares long-term and short-term RSI lines, and plots a fill between them for improved visualization. Fill is colored differently according to an uptrend (short period RSI above long period RSI) or a downtrend (short period RSI below long period RSI). Short-term RSI crossing long-term RSI adds a more robust trend confirmation signal than using single period RSI alone. This is a small tool to help visualize and confirm RSI trends. We hope you enjoy! Looking for RSI alerts? You can
FREE
PZ Penta O MT4
PZ TRADING SLU
2.33 (3)
The Penta-O is a 6-point retracement harmonacci pattern which usually precedes big market movements. Penta-O patterns can expand and repaint quite a bit. To make things easier this indicator implements a twist: it waits for a donchian breakout in the right direction before signaling the trade. The end result is an otherwise repainting indicator with a very reliable trading signal. The donchian breakout period is entered as an input. [ Installation Guide | Update Guide | Troubleshooting | FAQ | A
FREE
Heiken Ashi Button
Lee Teik Hong
4.75 (4)
Heiken Ashi Button Heiken-Ashi , often spelled Heikin-Ashi, is a Japanese word that means "Average Bar." The Heiken-Ashi approach can be used in conjunction with candlestick charts to spot market trends and forecast future prices. It's useful for making candlestick charts easier to read and analysing patterns. Traders can use Heiken-Ashi charts to determine when to stay in trades while the trend continues and close trades when the trend reverses. The majority of earnings are made when markets a
FREE
Forex Market Profile and Vwap
Lorentzos Roussos
4.86 (7)
外汇市场概况(简称FMP) 这不是什么: FMP 不是经典的字母编码 TPO 显示,不显示整体图表数据配置文件计算,并且不将图表分段并计算它们。 它能做什么 : 最重要的是,FMP 指示器将处理位于用户定义频谱左边缘和用户定义频谱右边缘之间的数据。 用户只需用鼠标拉动指示器的每一端即可定义频谱。 当指标右边缘被拉到实时柱并进一步(到未来)时,指标被认为是“实时的”(它会更新新柱) 该指标将一个“锚点”对象放在它所附加的图表上,然后将该锚点与硬盘驱动器上的文件相关联。 这允许您在图表上运行一个持续的 FMP,您的设置在重新启动时持续存在,直到图表 - 或指标 - 关闭。 FMP 指标可以在一个图表上运行多个自身实例,并且您可以命名它们。(名称在指标数据中显示为半透明,以便您能够区分它们) 指标的数据窗口被快速切换控件包围,当它们的状态发生变化时,这些控件会更新该图表的指标设置的“内存”。 左手柄、右手柄和数据窗口的显示可以自定义。您可以从 13 种不同的样式组合中进行选择,或者选择每个部分的单独样式(从 13 种中选择)。 您可以选择显示与光谱左侧对齐、在中间对称居中、与光谱右侧
FREE
MTF Alligator
Alexander Pekhterev
4.75 (8)
This is an indicator detecting trend direction. It uses the popular Bill Williams Alligator. It shows market state on all timeframes on one chart. As is well known, traders gain the main profit on the Forex market trading by trend, and losses usually occur when the market is flat. So, in order to gain profit a trader should learn to detect trend market and direction of a current trend in a rapid manner. This indicator has been developed for this purpose. MTF Alligator helps to: Profitably trade
FREE
该产品的买家也购买
Gann Made Easy
Oleg Rodin
4.83 (156)
Gann Made Easy 是一个专业且易于使用的外汇交易系统,它基于使用先生理论的最佳交易原则。 W.D.江恩。该指标提供准确的买入和卖出信号,包括止损和获利水平。您甚至可以使用推送通知在旅途中进行交易。 购买后请联系我,免费获取交易提示、奖金和 GANN MADE EASY EA 助手! 您可能已经多次听说过江恩交易方法。通常 Gann 的理论不仅对于新手交易者而且对于那些已经有一定交易经验的人来说都是非常复杂的东西。这是因为江恩的交易方法在理论上并不那么容易应用。我花了几年时间来完善这些知识,并将最好的原则应用到我的外汇指标中。 该指标非常易于应用。您所需要的只是将其附加到您的图表并遵循简单的交易建议。该指标不断进行市场分析工作并寻找交易机会。当它检测到一个好的入口点时,它会为您提供一个箭头信号。该指标还显示止损和获利水平。 换句话说,当您像先生一样进行交易时,该指标会为您提供最佳江恩建议。江恩亲自告诉你此时此刻该做什么。但最好的部分是您不需要了解任何有关江恩交易原则的知识,因为该指标会为您完成整个市场分析工作。
Scalper Inside PRO
Alexey Minkov
4.74 (69)
An exclusive indicator that utilizes an innovative algorithm to swiftly and accurately determine the market trend. The indicator automatically calculates opening, closing, and profit levels, providing detailed trading statistics. With these features, you can choose the most appropriate trading instrument for the current market conditions. Additionally, you can easily integrate your own arrow indicators into Scalper Inside Pro to quickly evaluate their statistics and profitability. Scalper Inside
Game Changer Indicator
Vasiliy Strukov
4.79 (19)
Game Changer 是一款革命性的趋势指标,适用于任何金融工具,可将您的 Metatrader 平台升级为强大的趋势分析工具。它适用于任何时间框架,能够帮助您识别趋势、发出潜在反转信号、作为追踪止损机制,并提供实时警报,以便您及时响应市场反应。无论您是经验丰富的专业人士,还是寻求优势的初学者,这款工具都能让您充满信心、纪律严明地进行交易,并清晰地理解潜在的趋势动态。该指标支持重绘功能。 购买后请立即联系我,即可获得专属赠品。您可以免费获得我们的“强支撑”和“趋势扫描器”指标,请私信联系我。 请注意,我不会在 Telegram 上出售我的 EA 或特殊设置,它们仅通过 Mql5 提供,我的设置文件也仅发布在我的博客上。谨防诈骗,切勿从其他任何人处购买任何设置。 设置 启用趋势变化提醒 - 真/假 - 趋势变化时在图表上显示提醒 发送推送通知 - 真/假 - 启用向手机推送提醒通知 发送邮件通知 - 真/假 - 趋势变化时向邮箱发送邮件通知
Miraculous 指标 – 100% 不重绘的外汇和二元期权工具,基于江恩九方图 这个视频介绍的 Miraculous 指标 是一款专为外汇和二元期权交易者开发的高精度、强大交易工具。该指标的独特之处在于它建立在传奇的 江恩九方图 和 江恩振动法则 之上,使其成为现代交易中可用的最精确预测工具之一。 Miraculous 指标 完全不重绘 ,这意味着它的信号在 K 线收盘后不会改变或消失——你看到的就是你得到的。这为交易者提供了可靠且一致的基础,让他们能够自信地进出场交易。 主要特点: 基于江恩九方图和江恩理论构建 100% 不重绘的信号系统 适用于所有时间周期(M1、M5、H1、H4、日线、周线) 适用于外汇和二元期权交易 清晰的买卖信号,准确率高 可用于剥头皮、日内交易或波段交易 兼容大多数 MT4 平台 这款工具旨在帮助初学者和专业交易者做出更好、更明智的决策。无论您是交易货币、指数还是二元期权,Miraculous 指标都将为您在市场中提供所需的优势。
RFI levels PRO
Roman Podpora
5 (1)
该指标能够准确显示反转点和价格回落区域。     行业领军人物 。您能洞察新趋势的形成,并以最高的精准度做出决策,掌控每一笔交易。 与……结合时,展现其最大潜力     趋势线专业版   指标  VERSION MT5 该指标显示的内容: 新趋势开始时的反转结构和反转水平及其激活。 显示屏   获利了结   和   止损   风险回报比最低的水平     RR 1:2       。 具有智能减值逻辑的止损。 显示指定指标中两种趋势类型的反转形态。 指标: 根据     趋势线     (全球趋势变化) 潮流专业版     (趋势快速变化) 简单有效   扫描器   实时趋势(新增)。 多时间框架工具筛选。 展示   利润   在 LOGIC AI 信号之后。 以下列出今日走势积极的金融工具。(RB键) 能够为终端启用通知(警报)功能,并向移动设备推送通知。 逻辑人工智能     — 利用人工智能寻找最佳切入点。 只有在启用 MTF(多时间框架分析)模式时,该功能才可用。 兼容性。 当与趋势线指标结合使用时,该指标能发挥其最大潜力。 这     RFI LEVELS PRO    
M1 Sniper
Oleg Rodin
5 (19)
M1 SNIPER 是一款易于使用的交易指标系统。它是一个专为 M1 时间框架设计的箭头指标。该指标可以作为独立的系统在 M1 时间框架下进行剥头皮交易,也可以作为您现有交易系统的一部分使用。虽然该交易系统专为 M1 时间框架交易而设计,但它也可以用于其他时间框架。我最初设计此方法是为了交易 XAUUSD 和 BTCUSD。但我发现这种方法在其他市场交易中也同样有用。 指标信号既可以顺势交易,也可以逆势交易。我教授一种特殊的交易技巧,帮助您利用指标信号进行双向交易。该方法基于使用特殊的动态支撑位和阻力位区域。 购买后,您可以立即下载 M1 SNIPER 箭头指标。此外,我还为所有 M1 SNIPER 工具用户免费提供下方屏幕截图所示的 Apollo Dynamic SR 指标!这两个指标的组合可以帮助您更轻松、更准确地利用 M1 时间框架进行交易。 购买后请联系我,免费获取交易提示和奖励指标! 祝您交易成功!
Dynamic Forex28 Navigator
Bernhard Schweigert
4.43 (7)
Dynamic Forex28 Navigator - 下一代外汇交易工具。 当前 49% 折扣。 Dynamic Forex28 Navigator 是我们长期流行的指标的演变,将三种功能合二为一: 高级货币强度 28 指标 (695 条评论)+ 高级货币 IMPULSE 带警报 (520 条评论)+ CS28 组合信号(奖励)。 有关指标的详细信息 https://www.mql5.com/en/blogs/post/758844 下一代强度指标提供什么? 您喜欢的原始指标的一切,现在通过新功能和更高的精度进行了增强。 主要特点: 专有货币强度公式。  所有时间范围内的平滑和准确的强度线。 非常适合识别趋势和精确进入。 动态市场斐波那契水平(市场斐波那契)。  此指标独有的独特功能。 斐波那契应用于货币强度,而不是价格图表。 适应实时市场活动以获得准确的反转区域。 实时市场动量。  第 9 行显示市场是活跃还是被动。 对于定时交易至关重要。 全面的警报和显示。  每种货币最强的买入和卖出动量。 ​​28 对的双重动量买入和卖出。 超买/超卖警告外部范围和止损。 反转
訂閱指標注意事項 此信號只支援電腦版MT4 不支援MT5、手機、平板 指標只顯示當日進場箭頭 非直播指標顯示歷史箭頭 (直播為展示用) 指標為交易輔助性質 非EA自動交易 無跟單功能 指標只標示進場位置 無出場(止盈)指示 進場止損點位設定30-50 PIPS 或是前高前低做為防守 止損不需拉太遠 紅色箭頭為多方進場訊號 綠色箭頭為空方進場訊號 撐阻力強度用箭頭大小表示 此指標適用於波段策略 不適合當沖策略盤整 多空反轉時不適用 指標載入後 右下角都會預設顯示盤整 載入指標一小時後 才會顯示多空 加入Youtube頻道會員 可參加每個月一次實體抽獎活動(台灣以外地區,獎品折現金用Paypal匯出) 每月抽獎時間為非農數據公布當週的週末盤勢分析(2100) 得獎者必須抽獎時在線上,逾期不候
Currency Strength Wizard
Oleg Rodin
4.84 (57)
货币强度向导是一个非常强大的指标,为您提供成功交易的一体化解决方案。该指标使用多个时间范围内所有货币的数据来计算这个或那个外汇对的力量。此数据以易于使用的货币指数和货币电力线的形式表示,您可以使用它们来查看这种或那种货币的力量。 您所需要的只是将指标附加到您要交易的图表上,该指标将向您显示您交易的货币的真实强度。该指标还向您显示买卖量压力的极值,您可以在顺势交易时利用这些压力。该指标还显示了基于斐波那契的可能目标。该指标可用于各种交易时间范围。该指标支持各种货币对的交易。 该指标为您提供所有类型的警报,包括推送通知。 购买后请联系我。我将与您分享我的交易技巧,并免费为您提供丰厚的红利指标! 祝您交易愉快,获利丰厚!
GOLD Impulse with Alert
Bernhard Schweigert
4.64 (11)
这个指标是我们2个产品 Advanced Currency IMPULSE with ALERT  +   Currency Strength Exotics 的一个超级组合。 它适用于所有时间框架,并以图形方式显示8种主要货币和一种符号的强势或弱势冲动! 该指标专门用于显示任何符号的货币强度加速,如黄金、异国货币对、商品、指数或期货。这是它的第一个指标,任何符号都可以被添加到第9行,以显示黄金、白银、石油、DAX、US30、MXN、TRY、CNH等的真实货币强度加速(冲动或速度)。 建立在新的基础算法上,它使识别和确认潜在的交易更加容易。这是因为它以图形方式显示了一种货币的强势或弱势是否正在加速,并测量了这种加速的速度--把它想象成你汽车中的速度表。当你加速时,事情显然会发生得更快,这在外汇市场上也是一样的,即如果你配对的货币正在向相反的方向加速,你就会发现一个潜在的有利可图的交易。 动态市场斐波那契28水平被用作警报触发器,将适应市场活动。如果冲动击中黄色触发线,你将收到警报。然后你就知道作为一个交易员应该做什么。货币对和方向已经给出。只需点击警报按钮,就可以切换到该货
Trend Lines PRO
Roman Podpora
5 (1)
TREND LINES PRO 帮助您了解市场真正的方向转变点。该指标显示真实的趋势反转点以及主要参与者重新入场的时机。 您可以看到 BOS线、 趋势变化和更高时间框架的关键水平——无需复杂的设置或不必要的干扰。信号不会重绘,并在K线收盘后仍然保留在图表上。 VERSION MT 5    -   与……搭配使用时,可发挥其最大潜力   RFI LEVELS PRO 指示器 该指标显示的内容: 实际变化 趋势(BOS 线) 一旦信号出现,它就始终有效!这与会重绘的指标有着重要的区别,后者可能会发出信号后又改变信号,从而导致资金损失。现在,您可以更精准、更准确地进入市场。此外,还有一个功能,会在箭头出现后为K线着色,直到达到目标价位(止盈)或出现反转信号为止。 重复条目   以及主要玩家的充值 为了提高寻找入场点时的视觉清晰度,我们创建了一个模块,该模块首先显示买入/卖出区域,并在该区域内寻找最佳入场点。此外,我们还加入了智能逻辑来管理止损位,该逻辑会随着时间的推移逐步降低止损位的大小,从而降低入场交易时的初始风险(移动止损位)。 信号强度水平(BOS) 该指标采用三个显著性等级来衡量
Volatility Trend System - a trading system that gives signals for entries. The volatility system gives linear and point signals in the direction of the trend, as well as signals to exit it, without redrawing and delays. The trend indicator monitors the direction of the medium-term trend, shows the direction and its change. The signal indicator is based on changes in volatility and shows market entries. The indicator is equipped with several types of alerts. Can be applied to various trading ins
Advanced Supply Demand
Bernhard Schweigert
4.91 (299)
现在优惠 40%! 任何新手或专业交易者的最佳解决方案! 该指标是一款独特、高质量、且价格合理的交易工具,因为我们已经整合了许多专有功能和新公式。 依据此更新,您将能够显示双重时间帧区域。 您不仅可以显示一个较高的时间帧,还可以同时显示图表时间帧,加上更高的时间帧:显示嵌套时区。 供需双方所有交易者都会喜欢它。 :) 重要信息披露 高级供需的最大潜力,请访问 https://www.mql5.com/zh/blogs/post/720245   想象您的交易如何得以改善,是因为您能够精准定位入场或目标位吗? 构建于新的底层算法,它可以更轻松地识别出买卖双方之间的潜在失衡。 这是因为它以图形方式展示供需最强劲区域,及其过去的表现(显示旧区域)。 这些功能旨在帮助您更轻松地发现最佳入场区域和价位。 现在您可以针对您的交易品种和时间帧来优化和编辑区域强度! 高级供需指标适用于所有产品和时间帧。 它是一个新的公式,非常新的功能是两个区域强度函数可由用户输入进行调整! 这在交易中是一大优势。 当您学习如何使用专有功能,例如带有价格游离最小 X 因子的区域强度时,您能够判断该区域强劲与否。 供需
Currency Strength Exotics
Bernhard Schweigert
4.88 (33)
目前8折优惠! 对任何新手或专家交易者来说都是最好的解决方案! 这个指标是专门用来显示任何符号的货币强度,如异国货币对、商品、指数或期货。它是同类产品中的第一个,任何符号都可以添加到第9行,以显示黄金、白银、石油、DAX、US30、MXN、TRY、CNH等的真实货币强度。这是一个独特的、高质量的、负担得起的交易工具,因为我们已经纳入了一些专有的功能和一个新的公式。想象一下,你的交易将如何改善,因为你能够准确地确定新趋势或剥头皮机会的触发点? 用户手册:点击这里   https://www.mql5.com/en/blogs/post/708876 它适用于所有时间框架。你将很快能够看到TREND! 根据新的基础算法设计,它使识别和确认潜在交易变得更加容易。这是因为它以图形方式显示了8种主要货币和一种符号的强弱。 该指标显示了8种主要货币(澳元加元瑞士法郎欧元英镑日元新西兰美元)的强弱线,再加上一个符号! 该指标显示了符号的真实价值。例如:对于XAUUSD(黄金):价格以美元报价。如果黄金在上涨,你怎么能知道是黄金的强势还是美元的弱势?只有当黄金走强时,我们才会进行交易。该指
Buy Sell Arrow Swing MT4
Sahib Ul Ahsan
5 (1)
Looking for a powerful yet lightweight swing detector that accurately identifies market structure turning points? Want clear, reliable buy and sell signals that work across any timeframe and any instrument? Buy Sell Arrow MT Swing is built exactly for that — precision swing detection made simple and effective. This indicator identifies Higher Highs (HH) , Higher Lows (HL) , Lower Highs (LH) , and Lower Lows (LL) with remarkable clarity. It is designed to help traders easily visualize market stru
目前八折优惠! 对任何新手或专家交易者来说都是最好的解决方案! 这个仪表板软件适用于28种货币对。它基于我们的两个主要指标(高级货币强度28和高级货币冲动)。它对整个外汇市场提供了一个伟大的概述。它显示高级货币强度值,货币运动速度和28个外汇对在所有(9)时间段的信号。想象一下,当你可以使用图表上的单一指标观察整个市场,以确定趋势和或剥头皮的机会时,你的交易将得到改善 我们已经在这个指标中建立了一些功能,使你更容易识别强势和弱势货币,同时识别和确认潜在的交易。该指标以图形方式显示货币的强势或弱势是增加还是减少,以及它在所有时间段的表现。 增加的新功能是动态市场斐波那契水平,它适应当前的市场条件变化,这是一个已经在我们的高级货币强度28和高级货币冲动指标中使用的成熟的加分项。 在交易时,总是将弱势货币和强势货币配对,这个新指标将帮助你做到这一点。 用户手册:点击这里  https://www.mql5.com/en/blogs/post/708783 特点  显示每个时间段的ACS28和GAP-speed(冲动)的货币强度值。 列:颜色代码以7种颜色显示货币强度:强势
FX Volume
Daniel Stein
4.63 (38)
FX Volume:从经纪商视角洞察真实市场情绪 简要概述 想要提升您的交易策略? FX Volume 可提供零售交易者和经纪商的持仓实时数据——远早于诸如 COT 之类的延迟报告。不论您希望获得持续稳定的收益,还是想在市场中多一分制胜的砝码, FX Volume 都能帮您识别重大失衡、确认突破以及完善风险管理。立即开启体验,让真实的成交量数据为您的交易决策带来革新! 1. 为什么 FX Volume 对交易者格外有用 极具准确度的早期预警 • 快速捕捉有多少交易者正在买入或卖出某个货币对——比大多数人提前一步。 • FX Volume 是 唯一 能够整合多家零售经纪商真实成交量数据并以简洁方式呈现的工具。 强力风险管理 • 及时识别多头或空头仓位的巨大不平衡,这往往预示着潜在的趋势反转,帮助您更自信地设置止损和目标位。 • 独家而真实的数据让每一次交易决策更具可靠性。 优化进场与出场点 • 发现“过度集中”的交易(大多数交易者都在同一方向),并通过真实成交量来确认突破。 • 避免依赖常见指标可能带来的误导信号,而是利用真实的实时成交量。 适配各种交易策略 • 将 FX
IQ Gold Gann Levels
INTRAQUOTES
5 (4)
Presenting one-of-a-kind Gann Indicator for XAUUSD IQ Gold Gann Levels is a non-repainting, precision tool designed exclusively for XAUUSD/Gold intraday trading. It uses W.D. Gann’s square root method to plot real-time support and resistance levels, helping traders spot high-probability entries with confidence and clarity. William Delbert Gann (W.D. Gann) was an exceptional market analyst whose trading technique was based on a complex blend of mathematics, geometry, astrology, and ancient calcul
Smart Sweep Sniper MT4
Vincent Georges David Ferrier
# Smart Sweep Sniper MT4 Version MT4 Midnight Pro Edition , specialized for scalping and day trading in Prop Firm, Available here PROTOCOL - Institutional Liquidity Grab & SMC available here ## The Institutional Edge — Detect Where Smart Money Acts, Enter When It Matters If you like it, leave a positive review to support its development. If you encounter a bug, let us know before posting a review. When you complete your challenge, share your certificate in the comments. Happy trading! Smart Sw
PRO Renko System
Oleg Rodin
5 (30)
PRO Renko Arrow Based System for trading renko charts.  准确的信号交易任何外汇工具. 另外,我将免费提供系统的附加模块! PRO Renko系统是RENKO图表上高度准确的交易系统。该系统是通用的。 该交易系统可应用于各种交易工具。 该系统有效地中和了所谓的市场噪音,打开了获得准确反转信号的通道。 该指标易于使用,只有一个参数负责产生信号。 您可以很容易地使算法适应您感兴趣的交易工具和renko酒吧的大小。 我很乐意通过提供任何咨询支持来帮助所有客户有效地使用该指标。 祝您交易成功!购买后,立即写信给我! 我将与您分享我的建议和我的renko发电机。 另外,我将免费提供系统的附加模块!
Atomic Analyst
Issam Kassas
5 (3)
首先值得强调的是,该交易指标是非重绘、非延迟的指标,这使其成为手动和机器人交易的理想选择。 用户手册:设置、输入和策略。 Atomic Analyst是一种PA价格行动指标,利用价格的力量和动量来寻找市场上更好的机会。配备了高级过滤器,可帮助去除噪音和假信号,并提高交易潜力。使用多层复杂的指标,Atomic Analyst扫描图表,并将复杂的数学计算转化为任何初学者都能理解并用来做出一致交易决策的简单信号和颜色。 “Atomic Analyst”是专为新手和经验丰富的交易者量身定制的综合交易解决方案。它将高级指标和一流功能融合为一体的交易策略,使其成为所有类型交易者的多功能选择。 日内交易和剥头皮策略:专为快速准确的日内交易和短期交易而设计。 日内和摆动交易策略:可用作追求价格大幅波动的日内和摆动交易者的可靠工具。 多货币和市场:凭借其可靠的精度,在不同的工具和市场上运作。 多个时间框架:可在多个时间框架上使用,性能良好。 稳定性:所有指标均不重绘、不重绘和不滞后,确保可靠的信号。 信号清晰度:提供箭头信号,用于清晰的入场和出场点。 实时警报:通过交易入场、SL和TP警报通知交易者
El indicador "MR BEAST ALERTAS DE LIQUIDEZ" es una herramienta avanzada diseñada para proporcionar señales y alertas sobre la liquidez del mercado basándose en una serie de indicadores técnicos y análisis de tendencias. Ideal para traders que buscan oportunidades de trading en función de la dinámica de precios y los niveles de volatilidad, este indicador ofrece una visualización clara y detallada en la ventana del gráfico de MetaTrader. Características Principales: Canal ATR Adaptativo: Calcula
Gold Scalper Super
Aleksandr Makarov
5 (2)
Gold Scalper Super is an easy-to-use trading system. The indicator can be used as a standalone scalping system on the M1 time frame, as well as part of your existing trading system. Bonus: when purchasing an indicator, Trend Arrow Super is provided free of charge, write to us after purchase. The indicator 100% does not repaint!!! If a signal appears, it does not disappear! Unlike indicators with redrawing, which lead to the loss of a deposit, because they can show a signal and then remove it.
IQ FX Gann Levels
INTRAQUOTES
5 (2)
IQ FX Gann Levels a precision trading indicator based on W.D. Gann’s square root methods . It plots real-time, non-repainting support and resistance levels to help traders confidently spot intraday and scalping opportunities with high accuracy. William Delbert Gann (W.D. Gann) was an exceptional market analyst, whose trading technique was based on a complex blend of mathematics, geometry, astrology, and ancient mathematics which proved to be extremely accurate. Setup & Guide:  Download  MT5 Ver
FX Power MT4 NG
Daniel Stein
4.95 (21)
FX Power:分析货币强度,助您做出更明智的交易决策 概述 FX Power 是一款专业工具,帮助您全面了解主要货币和黄金在任何市场条件下的真实强度。通过识别强势货币用于买入,弱势货币用于卖出, FX Power 简化了交易决策,并帮助您发现高概率的交易机会。不论您是想跟随趋势还是通过极端的 Delta 值预测反转,这款工具都能完美适应您的交易风格。别再盲目交易——用 FX Power 让您的交易更加智慧。 1. 为什么 FX Power 对交易者极具价值 实时货币和黄金强度分析 • FX Power 实时计算并显示主要货币和黄金的相对强度,助您全面了解市场动态。 • 监控领先或落后资产,轻松识别值得交易的货币对。 全面的多时间框架视图 • 跟踪短期、中期和长期时间框架的货币和黄金强度,以便将您的交易策略与市场趋势保持一致。 • 无论是快进快出的短线交易还是更长期的投资策略, FX Power 都能为您提供所需的信息。 Delta 动态分析用于趋势和反转 • 极端 Delta 值常常预示反转机会,而平缓的 Delta 变化则确认趋势延续。 • 使用 Delta 分析,轻
Step into the world of Forex trading with confidence, clarity, and precision using   Gold Indicator   a next-generation tool engineered to take your trading performance to the next level. Whether you’re a seasoned professional or just beginning your journey in the currency markets, Gold Indicator equips you with powerful insights and help you trade smarter, not harder. Built on the proven synergy of three advanced indicators, Gold Indicator focuses exclusively on medium and long-term trends eli
Harmonic Pattern Plus MT4
Young Ho Seo
4.44 (18)
Introduction Harmonic Patterns are best used to predict potential turning point. Traditionally, Harmonic Pattern was identified manually connecting peaks and troughs points in the chart. Manual harmonic pattern detection is painfully tedious and not suitable for everyone. You are often exposed under subjective pattern identification with manual pattern detection. To avoid these limitations, Harmonic Pattern Plus was designed to automate your harmonic pattern detection process. The functionality
Pips Stalker
Abdulkarim Karazon
5 (2)
Pips Stalker是一种多头空头箭头型指标,该指标帮助各级别交易者做出更好的市场交易决策,该指标从不重新绘制,并以RSI作为主要信号逻辑,一旦给出箭头,它就不会重新绘制或反绘,箭头也不会延迟。 PIPS STALKER ARROW的功能 : 统计面板 这是一个独特的信息仪表盘,显示整体胜率百分比和有用统计数据,如连续最大胜负交易数,以及其他有用信息。 TP和SL,内置资金管理 该指标在每个箭头上都标注了TP和SL对象,因此交易者内置了资金和风险管理,SL基于ATR,TP基于当前ATR SL价值的风险与回报比。 无需重新涂色,高度可调 该指标提供了多种提升信号质量的选项,使其在任何交易对上都能正常工作,只需少量周期调整,面板会显示当前设置和期间是否有利可图。 推荐时间框架:M1。 重新调整启动资本:100美元。 推荐账户类型:原始价差。
CRT Multi-Timeframe Market Structure & Liquidity Sweep Indicator Non-Repainting | Multi-Asset | MT5 Version Available MT5 Version:   https://www.mql5.com/en/market/product/162075 Full User Guide — explains what each feature does and why:   https://www.mql5.com/en/blogs/post/767525 Quick Start User Guide  — explains how to configure and in what order:  https://www.mql5.com/en/blogs/post/767540 Indicator Overview CRT Ghost Candle HTF Fractal is a complete institutional-grade market structure too
Meravith
Ivan Stefanov
5 (3)
做市商工具。 Meravith 将: 分析所有时间周期并显示当前正在运行的趋势。 标注流动性区域(成交量均衡区),即多头与空头成交量相等的位置。 在您的图表上直接显示来自不同时间周期的所有流动性水平。 生成并展示基于文本的市场分析供您参考。 根据当前趋势计算目标位、支撑位和止损位。 计算交易的风险回报比。 根据您的账户余额计算仓位大小,并估算潜在利润。 在市场出现重大变化时,Meravith 还会发出警告。 指标的主要线条: 多头/空头成交量衰竭线 —— 作为目标位使用。 趋势线 —— 指示市场趋势方向。根据市场是多头还是空头而改变颜色,并作为趋势支撑。其颜色主要反映市场情绪。 成交量均衡线(Eq)—— Eq(Volume Equilibrium)是系统的核心。它表示买卖双方成交量的平衡点,即市场流动性所在位置。向上突破 Eq 表示多头倾向,向下突破 Eq 表示空头倾向。突破后,应等待回调——当价格回到相反趋势的偏离线或衰竭线附近时。 使用方法:只需将其添加到图表中。 Meravith 可以分析一切——趋势和回调。 趋势线与某条成交量衰竭线之间的距离越大,说明该方向的成交量越高。 趋
作者的更多信息
Bazooka EA MT5
Davit Beridze
5 (2)
Bazooka EA —— 适用于 MT5 的趋势与动量交易专家顾问 重要提示:我们会定期在“评论”区发布更新后的 set 文件。请务必在进行回测和实盘交易时使用最新版本,以确保在当前市场波动环境下获得最佳性能。 Bazooka EA   是一款用于   MetaTrader 5   的全自动交易专家顾问,专为捕捉市场的 方向性行情 而设计,结合了 趋势确认 与 动量过滤 机制。 该 EA 注重受控入场与纪律化出场,避免过度交易及高风险的仓位管理方式。 Bazooka EA 适合偏好结构清晰、基于规则、并具备可配置风险管理的交易者。 策略说明 Bazooka EA 通过以下技术组合分析市场状态: 基于 移动平均线 的趋势方向识别 使用   RSI   进行动量确认 在下单前进行严格的交易条件验证 只有当趋势方向与动量条件同时满足时,EA 才会开仓,从而减少在震荡行情和低概率区域中的交易。 交易管理 EA 提供灵活且透明的仓位管理方式: 固定   止损(Stop Loss)   与   止盈(Take Profit) 出现 反向信号 时自动平仓 趋势变化 时平仓 限制同时持仓的最大交易数
Bazooka EA
Davit Beridze
5 (3)
Bazooka EA —— 适用于 MT4 的趋势与动量交易专家顾问 MT5:  https://www.mql5.com/en/market/product/163078 重要提示:我们会定期在“评论”区发布更新后的 set 文件。请务必在进行回测和实盘交易时使用最新版本,以确保在当前市场波动环境下获得最佳性能。 Bazooka EA 是一款用于 MetaTrader 4 的全自动交易专家顾问,专为捕捉市场的 方向性行情 而设计,结合了 趋势确认 与 动量过滤 机制。 该 EA 注重受控入场与纪律化出场,避免过度交易及高风险的仓位管理方式。 Bazooka EA 适合偏好结构清晰、基于规则、并具备可配置风险管理的交易者。 策略说明 Bazooka EA 通过以下技术组合分析市场状态: 基于 移动平均线 的趋势方向识别 使用 RSI 进行动量确认 在下单前进行严格的交易条件验证 只有当趋势方向与动量条件同时满足时,EA 才会开仓,从而减少在震荡行情和低概率区域中的交易。 交易管理 EA 提供灵活且透明的仓位管理方式: 固定 止损(Stop Loss) 与 止盈(Take Profit)
从 2024 年开始的黄金 (Gold M15) 测试默认设置 Kaufman Smart Regime EA: 自适应市场智能 特别首发优惠: Smart Regime EA 的强大功能以远低于其真实价值的价格发布。请立即以 $50 购入您的许可,在此价格开始逐步、分阶段上涨至最终定价 $500 之前锁定。这是一项对无与伦比的市场逻辑的投资。 释放自适应算法交易的力量。Kaufman Smart Regime EA 不仅仅是一个策略;它是一个市场感知引擎,旨在区分市场噪音和真正的动能。 核心理念:“智能机制”检测 大多数算法失败是因为它们对动态市场应用了静态逻辑。 Kaufman Smart Regime EA 利用 Perry Kaufman 传奇效率比逻辑的专有改编,来确定市场的“机制”(Regime)。它在混乱的盘整期间保持休眠,并在真正的方向性流动性进入市场时精确打击。 通过 更高时间框架矩阵 过滤价格行为,该 EA 确保您始终与主要的机构流动保持一致,而不是逆势而行。 验证层 原始信号永远不够。该 EA 在执行任何交易之前,采用 三重验证协议 。这减少了“误报”,并确保
Speed Trend Matrix Ultimate (版本 5.10) Speed Trend Matrix (STM) 是一套封装在单个指标中的完整交易系统。与仅仅显示超买或超卖状态的标准振荡器不同,STM 分析相对于市场波动率 (ATR) 的价格“速度”。它不仅识别趋势方向,还能识别运动背后的强度,过滤掉缺乏动能的“平盘”期,避免交易者在市场震荡中频繁止损。 该工具专为需要每笔交易都有清晰“路线图”的交易者设计。它不仅提供入场信号,还会根据您选择的交易风格,直接在图表上自动计算并投射建议的 止损 (Stop Loss) 和 止盈 (Take Profit) 水平。 核心理念 该指标根据价格速度将市场行为分为三个明显的区域: UpZone (绿色): 存在强劲的看涨动能。 DownZone (红色): 存在强劲的看跌动能。 FlatZone (灰色): 价格缺乏维持趋势的速度。此过滤器有助于您在市场横盘整理或方向不明时保持观望。 关键功能 1. 四种动态离场策略 STM v5 最显著的特点是其适应性。您可以在四种不同的计算模式之间切换,以适应您的具体交易个性: Mode ATR
RSI Entry Points
Davit Beridze
5 (5)
RSI Entry Points is the upgrade of the standard RSI indicator to avoid lagging. Indicator draws the clouds and the arrows to have clear picture where price is and what to wait for. Why standard RSI is lagging? because mostly we do not use it correctly and it is with very weak visual flexibility, less informative. With my current upgrade I tried to Fix both problems same time and I got much better results and more exact entries than standard RSI has. I Made RSI line Dynamic, it gets more flexible
Auto Optimized MFI
Davit Beridze
5 (1)
Auto Optimized MFI 是一款自适应指标,通过对历史数据进行真实交易模拟,自动调整最适合您市场和时间周期的 MFI 买入/卖出水平。不同于传统固定的 80/20 阈值,它根据实际价格与成交量的行为进行优化,帮助您找到更有效的进出场区域。 工作原理 该指标会扫描指定范围内的历史K线,并基于MFI信号进行交易模拟,记录每次交易的胜率、回撤、止盈止损等表现。根据这些结果,它会自动在每日、每周或每月周期内更新最优的 MFI 水平,使策略始终贴近当前市场状态。 主要功能 可自定义的 MFI 周期(默认:14) 优化所用的历史K线数量(优化范围) 买入/卖出水平的边界设定 可调节的步进间距,用于精细优化 设置最小利润目标,过滤无效策略 MFI线和信号箭头的样式可自定义 这款工具非常适合寻求策略自动优化的交易者,使您的交易系统能随着市场动态不断调整,而不再依赖固定规则。
Auto Optimized Bollinger Bands – 适用于真实市场的自适应波动性工具 Auto Optimized Bollinger Bands 是一款先进的 MT4 指标,通过历史交易模拟,自动选择最优的布林带周期和偏差设置,从而改进了传统的布林带方法。 该指标不是使用固定参数,而是实时优化,根据实际市场行为寻找最有效的设置,使布林带能够根据波动性和价格结构的变化动态调整,无需手动调节。 主要功能: 基于历史表现自动寻找最优布林带参数 在关键价格反转点显示自适应买入/卖出箭头信号 内置提示功能:声音、弹窗、推送通知 优化深度、显示方式和信号参数均可自定义 适用于外汇、黄金、指数、加密货币等市场 本工具非常适合日内交易者和波段交易者,提供比传统固定设置更智能的波动性交易方式。
Auto Optimized RSI
Davit Beridze
5 (2)
Auto Optimized RSI: 专业市场自适应系统 大多数交易者失败的原因是:在动态的市场中使用了静态的工具。 在每个图表上都使用固定的 RSI 层级(如 70/30)是一个数学错误。如果你只是在寻找没有逻辑 support 的“神奇箭头”,那么这个指标并不适合你。 本工具专为那些明白“优化是交易生存唯一关键”的专业人士设计。 普通指标不考虑你交易的具体品种或时间周期。 Auto Optimized RSI 则完全不同。它通过对历史数据进行内部仿真模拟,找出近期价格真实发生反转的精确水平。它不靠猜测,而是依靠计算。 技术优势: 自适应逻辑: 根据当前市场波动自动重新计算买入/卖出区域。 数学验证: 直接在图表上显示实时表现指标(胜率 Win Rate、回撤 Drawdown、盈亏比)。在交易前,你就能看到数据证明。 信号过滤: 与那些会“重绘”的虚假指标不同,本算法通过交叉优化阈值,旨在捕捉高概率的反转机会。 简洁专业: 界面清晰,拒绝杂乱。只提供精准的信号箭头和决策所需的核心数据。 专业交易者福利: 购买后请联系我,即可获得基于此逻辑的 赠品自动化交易机器人 (EA)
Auto Optimized RSI   是一款智能且易于使用的箭头指标,旨在实现精准交易。它利用基于历史数据的模拟,自动识别当前品种和时间周期中最有效的 RSI 买入和卖出水平。 该指标既可以作为独立的交易系统使用,也可以结合您的其他交易策略一起使用。尤其适合日内交易者使用。 与传统 RSI 指标使用固定的 70/30 水平不同, Auto Optimized RSI   会根据真实的价格行为和回测结果动态调整水平。它会跟踪胜率、回撤和平均盈亏等关键指标,从而适应市场当前的走势,并基于“实际有效”的逻辑发出信号。 当 RSI 穿越经过优化的关键区域时,指标会在图表上显示 Buy 和 Sell 箭头,帮助交易者找到成功率更高的进场机会。 购买后请务必联系我,以获取额外赠送的工具和专属交易建议! 祝您交易顺利,稳步盈利!
RSI Entry Points MT5
Davit Beridze
5 (1)
RSI Entry Points is the upgrade of the standard RSI indicator to avoid lagging. Indicator draws the clouds and the arrows to have clear picture where price is and what to wait for. Why standard RSI is lagging? because mostly we do not use it correctly and it is with very weak visual flexibility, less informativity. With my current upgrade I tried to Fix both problems same time and I got much better results and more exact entries than standard RSI has. To make yourself sure check out the screens
MA Speedometer
Davit Beridze
4.6 (10)
Dashboard for Ma Speedometer:  https://www.mql5.com/en/market/product/116784 Non standard attitude to the standard moving average indicator. The essence of the indicator is to determine the strength and speed of the price direction by determining the tilt angle of the moving average. A point is taken on the fifteenth MA candle and a point on the last closed MA candle, a straight line is drawn between them, it is movable and on a hemisphere shows an angle of inclination from 90 degrees to -90. a
Period Cross RSI
Davit Beridze
5 (6)
Check my p a id tools they   work  perfect! "Period Cross RSI" Is a New indicator idea that shows crosses of two RSI lines with different periods which creates ascending and descending zones for confirmation of long and short trading. This indicator is brend new and will be upgraded further, for now I recommend to use it as a confirmation, filter indicator for determination of long/short trading zones, not as a signaler indicator for now. Further upgrades can make it as a signaler indicator as w
FREE
Adjustable Pin Bar
Davit Beridze
4.67 (3)
Check my p a id tools they   work  perfect please r ate Adjustable PIN BAR indicator is usefull tool alowing to search for pin bars you wish to find on the price chart, it has 2 parameters to filter out what type of pin bars you wish to search for: 1) MinTailProc 75% (default) which means to show pin bars that has minimum size of the Nose (Tail) as 75% of full candle size. If Upper Nose (Tail) size of the candle is minimum 75% of the candle size fully than candle is painted in RED. If Lower Nose
FREE
Check my paid tools they work great and I share Ea's based on them for free please r ate The Dual Timeframe RSI (Relative Strength Index) indicator is a novel trading tool that allows traders to monitor RSI readings from two different timeframes on a single chart. This dual perspective enables traders to identify potential trend confirmations and divergences more effectively. For instance, a trader might use a 1-hour RSI alongside a daily RSI to ensure that short-term trades align with the broa
FREE
Indicator shows buy/sell arrows depending on volatility factor. Indicator does not repaint! It works on any pair and any timeframe. It is well tested through strategy builders and shows quite interesting results as a good filter indicator and as independent signaler as well (check the screenshots). It is possible to search for a lot of interesting parameters for profitable trading, some of which are shown on the screenshots. There are next inputs in indicator settings: N-volatility period; Level
Steady Ranger EA
Davit Beridze
3 (2)
Steady Ranger EA – 智能安全的通道交易 回测: 使用提供的 set 文件(位于“评论”部分)在“仅开盘价”模式下进行测试。 视频: 观看字幕版以获得完整理解。 为什么选择 Steady Ranger EA? 一款长期稳定、风险可控的交易系统,专注于安全性和一致性,而非夸大收益。 多层止损保护: 结合单笔交易止损和“总亏损限制”控制回撤。 通道交易策略: 在通道极端水平开仓,依据信号平仓,同时严格控制风险。 自适应仓位调整: 通过动态调整手数避免过度风险。 多时间框架过滤: 规避强趋势行情下的不必要交易。 可靠且经过验证: 经过长期稳定测试,适用于实盘交易。 EA 如何工作? EA 依据价格通道开仓,并根据信号、止损或风控机制平仓。避免过度曝险,限制最大持仓规模,以确保稳健交易。 主要输入参数 交易设置: 初始手数、手数倍增、止损、止盈。 风险管理: 保本水平、跟踪止损、最大持仓量。 市场条件: 最大点差、滑点容忍度、最小订单间距。 交易时间: 可自定义的交易时间、交易时段结束后的清仓选项。 指标与过滤: 布林带、RSI、波动率过滤、多时间框架设置。 挂单选项: 支持挂
This EA is Created just for RSI Entry points Indicator ( https://www.mql5.com/en/market/product/67581 Test, to show indicators profitable parameters and to give potential buyers possibility to backtest indicator Entries. EA opens Buy orders on Buy Arrows and Sell orders on Sell Arrows of the indicator, orders are closed on opposite signals. EA is not created for Live automated trading, thats not the goal to sell EA, but any ways if you like it and need it, you can rent. Default settings are fo
MFI Modern PRO
Davit Beridze
4.92 (39)
Def ault settings   are just for visu alis ation, it c an not be profit able with it.  Get a Free EA as a Bonus when you Purchase the Indicator! Plus, Receive 4 Interesting Additional Indicators. Recommended set files for backtesting the indicator on recommended pairs are available in the comments section (last page). Please note that this product is exclusively sold on the MQL5 market. Any other sources offering it are scams, and the author bears no responsibility. To receive the bonus gifts,
Re ad First Before Testing. This Ea goes as a Bonus to  MFI Modern PRO indicator users only. Set files generated  after upgrade you can check in comments section. This Expert advisor is based on MFI Modern PRO indicator   https://www.mql5.com/en/market/product/80765 just to  give possibility to indicator users for fastly test the indicator Before buying. In comments section recommended set files are uploaded by which you can prove yourself that backtest data from indicator overview are real. Thi
MA Revolution
Davit Beridze
5 (1)
MA Revolution is upgraded version of standard Moving   A verage. With the current upgrade moving average line got more sensitive with different market conditions. It gets more flexible by decreasing default period step by step while market is sharp and incrasing period back to default period step by step while market is normal again. testing of the ide a shows th at this upgr aded version gives much more acur acy for detecting m arket direction, ch anges in direction are shown much e arly th an
Laguerre Scrat
Davit Beridze
5 (1)
In case you get Laguerre S crat indicator, you will get Laguerre Scrat Ea as a Gift. To get Ea  and det a iled m anu al PDF contact me PM. Default settings are for usd/cad H4 For St able Long term Profits Laguerre Scrat is a trading system based on 4 indicator combinations in the shape of one indicator. Laguerre indicator (upgraded), CCI, Bollinger bands and market volatility factor. It generates arrows in the indicator window and nuts on the price chart, doubling arrows for a better view where
Fiter
Davit Beridze
5 (2)
购买此指标的用户将免费获得基于 Fiter 指标的EA作为奖励。(观看视频了解EA的实际操作。)请评论以获取EA。 Fiter 是一个混合指标,它将指数移动平均线 (EMA) 与经过ATR调节的RSI线(黄色)结合使用,同时配合传统的移动平均线(红色)。这两条线的交叉点生成的交易信号比经典的两条简单移动平均线的交叉信号更平滑、更可靠,帮助交易者更好地捕捉市场趋势。 回测结果证明了这种方法的有效性,显示出比简单移动平均线交叉更优越的表现。历史数据表明,Fiter 能够很好地适应各种市场条件,成为在实际手动交易中识别主要趋势的有力工具。 想要体验不同之处,请查看截图或在策略测试器中运行该指标。指标还包括警报功能,及时通知您可能的交易信号,帮助您抓住每一个重要的市场机会。
after getting indic ator cont act me for Bonus E a. Non Repaint TMA channel with special conditioned arrows on price cross of channel lines plus market Volatility factor, which makes product much more accurate than any usual tma channel indicators.  It is proven to be profitable with Ea built based on it which you will get as a BONUS in case of indicator purchase. Good luck.
MRA Index
Davit Beridze
5 (5)
MRA Index 指标概述 赠品优惠: 购买该指标即可免费获得“MRA Index EA”。 优化策略: 对于剥头皮交易,我基于过去 12 个月的数据进行优化,并在接下来的一个月内使用这些设置。这种方法已被证明非常有效。 重要说明: 默认设置仅供可视化使用,未经过盈利优化。正确的优化指南仅提供给购买者。 关于“MRA Index”指标: “MRA Index”是一款多功能外汇指标,可帮助交易者识别潜在的市场趋势和入场点。它具有一个专门的通道和在该通道内移动的动态混合线,用于生成买入和卖出信号。 主要特点: 动态混合线: 在通道内移动,并作为生成交易信号的基础。 买入和卖出箭头: 基于混合线与通道的特定交互生成,指示潜在的市场反转。 自定义功能: 交易者可以通过调整各种输入参数来优化指标以适应其策略。 可选过滤器: ATR(平均真实范围): 可启用或禁用,以调整灵敏度。 布林带(BB): 帮助根据价格走势过滤信号。 FTR 过滤器: 提供带有颜色编码的市场趋势可视化功能。 自定义选项: 该指标提供多个输入参数,具有灵活性,包括 ATR、MFI、RSI、布林带和标准差的设置。此外,交易者
Ma Speedometer Dashboard
Davit Beridze
3.5 (2)
测试演示版没有任何意义。你不会通过查看闪烁的数字了解任何信息。这是一个仪表盘。请尝试理解其理念,接下来我会帮助你完成所有内容。 符号必须用逗号(,)分隔,并按照你经纪商的显示格式输入参数,以确保它们能在仪表盘中识别。这些符号将被用于指标分析。 只需点击一次,即可直接从仪表盘打开任何货币对和任何时间周期。 MA Speedometer Dashboard 是一款功能强大的MetaTrader 4 (MT4) 指标,旨在通过动态市场分析增强交易策略。它提供强大的功能,用于识别市场趋势、在横盘市场中交易以及退出平淡市场条件,这一切基于移动平均线的角度。作为特别赠品,客户还会获得一款特别版本的MA Speedometer指标,这是 MA Speedometer Dashboard 的基础。 主要特点: 综合趋势分析:仪表盘使用移动平均线(MA)的角度来检测潜在的市场趋势。交易者可以通过颜色编码信号轻松发现强劲上升或下降趋势的开始: - 绿色:表示强劲上升趋势的开始,提供入场机会。 - 红色:表示强劲下降趋势的开始,也提供了入场机会。 - 黄色:表示横盘或平淡市场,提示潜在的退出点。
Sure, here is the shortened version in Chinese: MetaTrader 4 (MT4)的K线形态指标 这个可定制的指标可以识别主要的多头和空头K线形态,帮助交易者进行技术分析和决策。 主要功能: 形态识别 : 多头 :锤子线、吞没形态、早晨之星、三只白兵、多头母子线、倒锤子线。 空头 :流星线、吞没形态、黄昏之星、三只黑乌鸦、空头母子线、上吊线。 自定义选项 :根据策略启用或禁用特定形态。通过箭头显示形态(蓝色代表多头,红色代表空头),可调大小和间距。 移动平均线集成 :可选的自定义移动平均线(周期、方法、时间框架)。 警报系统 :屏幕消息、声音、推送通知和电子邮件警报,用于提醒检测到的形态。 多形态检测: 形态聚合 :在同一根K线上显示多个形态,信号更强。 多头聚合 :多个蓝色箭头表示更强的上涨趋势。 空头聚合 :多个红色箭头表示更强的下跌趋势。 混合形态 :同时出现多头和空头形态表明市场不确定性。 此指标通过清晰的视觉表现增强了交易决策,帮助交易者更好地捕捉市场的反转和趋势延续,提升整体交易表现。
Chart Patterns All in One
Davit Beridze
4.47 (19)
以演示模式试用 "Chart Patterns All in One" 并获得奖励。试用后,请发送消息给我以领取奖励。 购买后留言即可获得8个高质量的指标作为赠品。 Chart Patterns All-in-One 指标帮助交易者可视化技术分析中常用的各种图表形态。它帮助识别潜在的市场行为,但不保证盈利。建议在购买前在模拟模式下测试该指标。 当前优惠 : “Chart Patterns All in One” 指标享受 50% 折扣。 包含的形态 : 1-2-3 形态 :通过三个关键点(高点或低点)检测市场反转。 买入 :连续两个低点后出现较低的高点。 卖出 :连续两个高点后出现较高的低点。 可视化 :线条和箭头连接识别的点。 双顶和双底 :当价格形成两个连续的高点(双顶)或低点(双底)且它们大致相等时,表明反转趋势。 双顶 :看跌反转。 双底 :看涨反转。 可视化 :线条连接峰值或低谷,箭头标记反转点。 三顶和三底 :与双顶/双底类似,但有三个连续的高点或低点,信号更强的反转趋势。 三顶 :看跌反转。 三底 :看涨反转。 可视化 :线条和箭头标记形态。 三角形 :在趋势延续前识别
Candle Info"指标适用于MetaTrader 4 (MT4),帮助交易者直接在图表上分析和可视化关键蜡烛形态。通过识别如更高高点 (HH)、更低低点 (LL)、更高低点 (HL) 和更低高点 (LH) 等形态,提供市场趋势和潜在价格走势的洞察。 主要功能: 蜡烛形态: 识别并标记HH、LL、HL、LH,以及诸如HH & HL(看涨趋势)和LL & LH(看跌趋势)的组合。 交易时段过滤: 允许根据主要交易时段(东京、伦敦、纽约、悉尼)过滤形态,便于集中关注重要的市场时间。 警报: 可配置的屏幕、推送、邮件和声音警报,提醒交易者新形态。 自定义: 调整文字颜色、大小,并选择显示哪些时段或形态。 非常适合趋势交易和基于时段的策略,"Candle Info"指标简化了市场分析,帮助交易者更快做出明智的决策。
PRO Trend Divergence
Davit Beridze
5 (2)
此指标适用于实时图表,不适用于测试器。 PRO Trend Divergence 指标是一款先进的技术分析工具,专注于检测 趋势延续背离 ,这是一种表明当前趋势可能会持续的信号。与传统指标强调趋势反转不同,这款工具帮助交易者识别趋势依然强劲的市场状态,即使在短暂回调或小幅调整时也是如此。 趋势延续背离 出现在价格沿趋势方向移动时(上升趋势中的更高低点或下降趋势中的更低高点),但所选指标却出现背离,确认趋势可能继续。 PRO Trend Divergence 指标使交易者能够自信地跟随趋势,减少过早退出的风险。 特点与优势 多指标支持 支持 MACD、RSI、Stochastic、CCI、Momentum、OBV、VW-MACD、CMF 和 MFI。 图表上的可视信号 显示背离线条,并支持颜色和样式的自定义。 关键枢轴点集成 利用关键的高点和低点来优化信号,减少噪音。 灵活高效 提供信号确认、筛选和时间周期选择的自定义参数。
SpeedAngle
Davit Beridze
SpeedAngle 指标 是一款先进的 MetaTrader 4 工具,可计算价格运动角度,提供动态视觉提示和可自定义的警报,帮助交易者识别趋势反转和动量变化。 主要功能 基于角度的趋势分析: 通过用户定义的周期计算角度,显示价格动量和方向。 动态视觉效果: 显示根据角度阈值变化颜色的彩色圆圈: 高于 LevelMax: 表示强劲的上升动量。 低于 LevelMin: 表示强劲的下降动量。 在范围内: 表明价格整合或轻微波动。 可自定义警报: 提供“从极值”或“从中间”两种场景的警报,并支持声音、电子邮件和推送通知。 买入/卖出箭头: 可选箭头显示潜在交易信号。 高度可配置: 调整阈值、颜色、警报设置等。 优点 简化市场分析: 通过视觉提示和警报快速识别关键价格条件。 节省时间: 警报通知您交易机会,无需时刻监控图表。 适合任何策略: 可用于短线交易、波段交易和趋势跟随策略。 输入参数亮点 计算: 定义回溯周期( StartBar )和历史数据限制( MaxBarsHistory )。 视觉效果: 自定义圆圈和线条颜色。 警报: 启用声音、电子邮件或推送通知。 阈值: 设置 Leve
筛选:
5073095
95
5073095 2025.08.04 10:02 
 

buongiorno a me non funzionano le frecce tutto il resto è ok ma no frecce anche se sono abilitate

Davit Beridze
11504
来自开发人员的回复 Davit Beridze 2025.08.04 10:04
show the issue in the comments section
lgm77312197
25
lgm77312197 2025.03.15 11:06 
 

为什么没有箭头呢

Davit Beridze
11504
来自开发人员的回复 Davit Beridze 2025.03.15 14:34
you should change timeframes and play with Volatile inputs! First ask and if it does not work only after make negative Review!
IK02XXyn
167
IK02XXyn 2024.11.09 13:37 
 

Gracias por compartir, da muy buenas señales de entrada y salidas

Davit Beridze
11504
来自开发人员的回复 Davit Beridze 2024.11.09 15:37
thanks! try my paid tools the work great :) Especially Chart Patterns All in One and PRO Trend Divergence
xxcoincoin
45
xxcoincoin 2023.08.21 14:47 
 

Really good indie well done ! Can be really useful !

rainwalker123
3433
rainwalker123 2021.05.26 10:39 
 

Did some trades, and the indicator predicts big movements, even in the M1 timeframe. Higly recommended

Davit Beridze
11504
来自开发人员的回复 Davit Beridze 2021.05.26 11:55
thanks for the review :) you are welcome :) in case of ideas about some improvement use comments section as well please. Lets make it even better.
回复评论