Ma Speedometer Dashboard
- 지표
- 버전: 1.0
- 활성화: 5

데모 버전은 사용할 필요가 없습니다. 깜빡이는 숫자를 보아도 아무것도 이해할 수 없습니다. 이것은 대시보드입니다. 개념을 이해하려고 노력하면 나머지는 제가 도와드리겠습니다.
심볼은 쉼표(,)로 구분하고 브로커가 표시하는 형식과 정확히 일치하게 입력해야 대시보드에서 인식됩니다. 이 심볼들은 인디케이터 분석에 사용됩니다.
한 번의 클릭으로 대시보드에서 바로 모든 통화쌍과 시간 프레임을 열 수 있습니다.
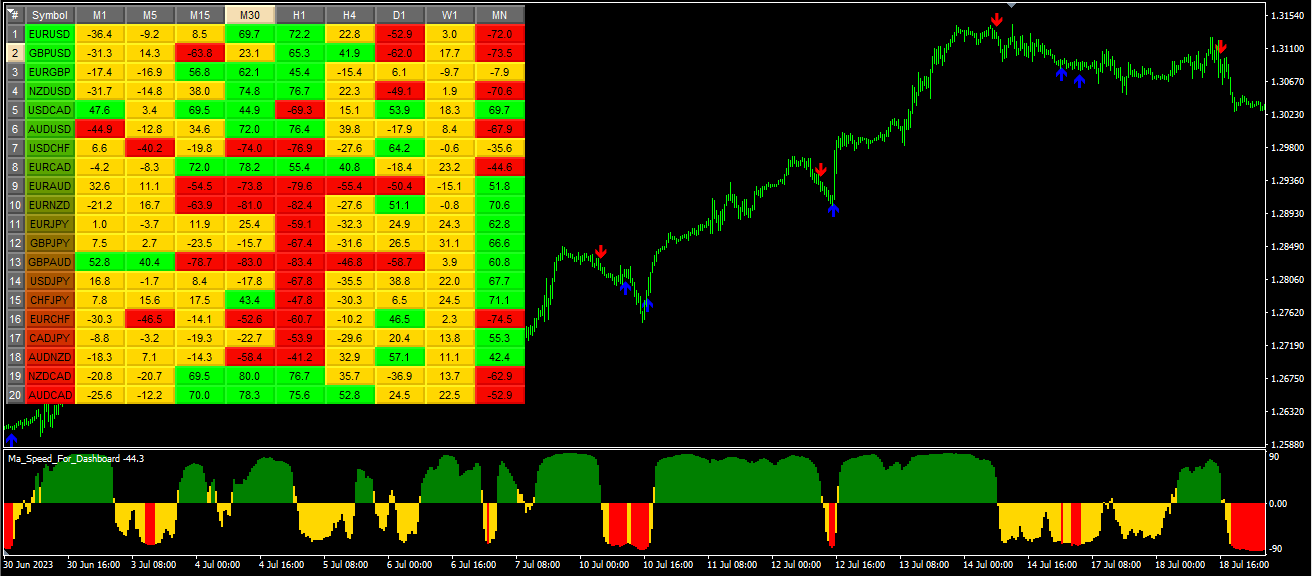
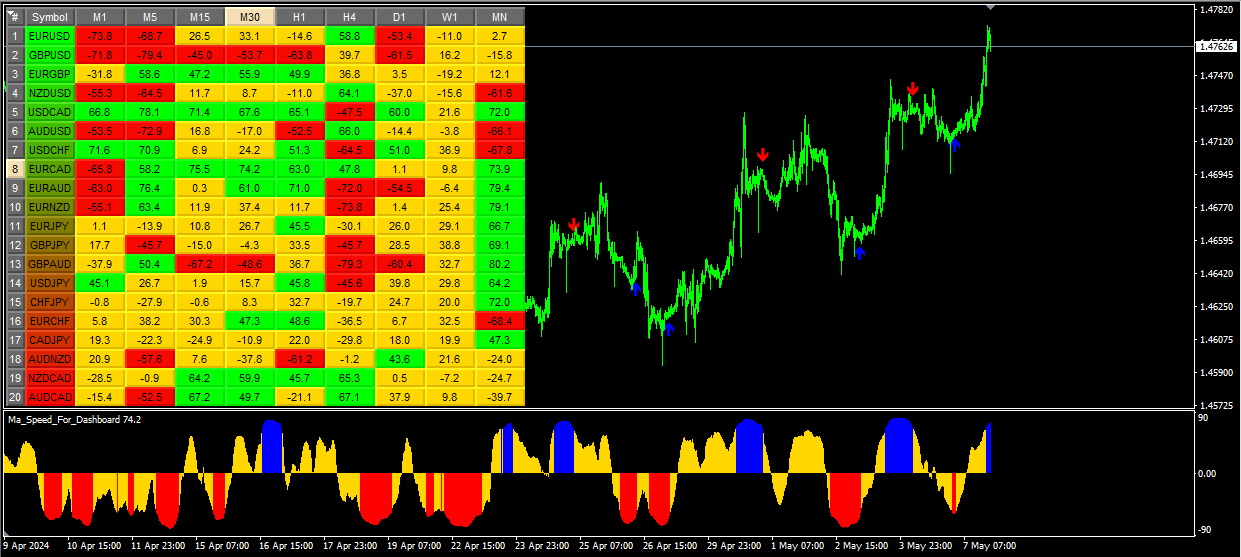
MA Speedometer Dashboard는 MetaTrader 4 (MT4)를 위한 매우 기능적인 인디케이터로, 동적 시장 분석을 통해 거래 전략을 강화하도록 설계되었습니다. 이 대시보드는 이동 평균선의 각도를 기반으로 시장 트렌드를 식별하고, 횡보 시장에서 거래하며, 횡보하는 시장 조건에서 빠져나가는 데 강력한 기능을 제공합니다. 특별 보너스로, 고객들은 MA Speedometer 대시보드의 기반이 되는 MA Speedometer 인디케이터의 특별 버전을 받을 수 있습니다.
주요 기능:
시장 분석: 대시보드는 이동 평균선(MA)의 각도를 사용하여 잠재적인 시장 트렌드를 감지합니다. 트레이더는 색상으로 구분된 신호를 통해 강한 상승 또는 하락 트렌드의 시작을 쉽게 식별할 수 있습니다.
- 녹색: 강한 상승 트렌드의 시작을 나타내며 진입 기회를 제공합니다.
- 빨간색: 강한 하락 트렌드의 시작을 나타내며 진입 기회를 제공합니다.
- 노란색: 횡보 또는 플랫한 시장을 나타내며, 출구 시점을 제안합니다.
멀티 타임프레임 모니터링: 대시보드는 M1부터 MN까지 다양한 타임프레임을 지원하여 트레이더가 세부적이고 광범위한 수준에서 시장 상황을 분석할 수 있게 합니다. 이 기능은 데이 트레이딩이나 장기 투자 등 다양한 거래 스타일에 적합합니다.
인터랙티브 대시보드: 인터랙티브한 인터페이스를 통해 트레이더는 다양한 통화쌍과 시간 프레임 사이를 빠르게 전환할 수 있습니다. 대시보드를 클릭하면 MT4가 선택한 통화쌍과 시간 프레임에 맞는 차트를 자동으로 열어 사용 편의성과 효율성을 높입니다.
사용자 정의 가능한 파라미터: 트레이더는 이동 평균선 기간, 방법 및 각도 임계값을 사용자 정의하여 대시보드를 선호하는 거래 전략에 맞출 수 있습니다. 이러한 유연성 덕분에 이 도구는 다양한 시장 조건과 거래 접근 방식에 적응할 수 있습니다.
시각적 경고: 대시보드의 직관적인 디자인에는 다양한 시장 상황을 위한 시각적 경고와 쉽게 읽을 수 있는 라벨이 포함되어 있습니다. 이 기능은 상황 인식을 높여 트레이더가 신속하게 정보에 입각한 결정을 내리는 데 도움을 줍니다.
특별 보너스: 특별 제공으로, 고객은 MA Speedometer 인디케이터의 고유한 버전을 선물로 받게 됩니다. 이 인디케이터는 대시보드의 기반이 되어 더욱 정밀한 분석을 가능하게 합니다.
각 입력 파라미터 설명:
- Symbols: 이 파라미터는 쉼표(,)로 구분된 심볼 목록을 지정할 수 있는 문자열 입력입니다. 이 심볼들은 인디케이터가 분석에 사용합니다.
- StartBar: 이 파라미터는 이동 평균선 각도를 계산하기 위한 시작 바를 나타내는 정수 입력입니다.
- MaPeriod: 이 파라미터는 이동 평균선을 계산하는 데 사용되는 기간을 나타내는 정수 입력입니다.
- MaMethod: 이 파라미터는 이동 평균선을 계산하는 방법을 나타내는 열거형 입력입니다. 간단 이동 평균(SMA), 지수 이동 평균(EMA) 등과 같은 옵션을 포함하는 ENUM_MA_METHOD에서 값을 선택할 수 있습니다.
- Level_Up_M1부터 Level_Dn_MN1까지: 이 파라미터들은 M1부터 MN1까지의 다양한 타임프레임에 대한 상한과 하한을 나타내는 정수 입력으로, 이동 평균선의 각도를 기반으로 버튼의 배경색을 결정하는 데 사용됩니다.
- X-Size 및 Y-Size: 이 파라미터는 각각 버튼의 너비와 높이를 나타내는 정수 입력입니다.
요약: MA Speedometer Dashboard는 트렌드 트레이더와 횡보 시장을 선호하는 트레이더 모두에게 적합한 종합적인 시장 분석 도구를 제공합니다. 그 유연성, 인터랙티브한 인터페이스, 사용자 정의 가능한 파라미터 덕분에 이 도구는 외환 시장의 복잡성을 더 정밀하게 탐색하는 데 도움을 주는 귀중한 추가 기능이 됩니다.


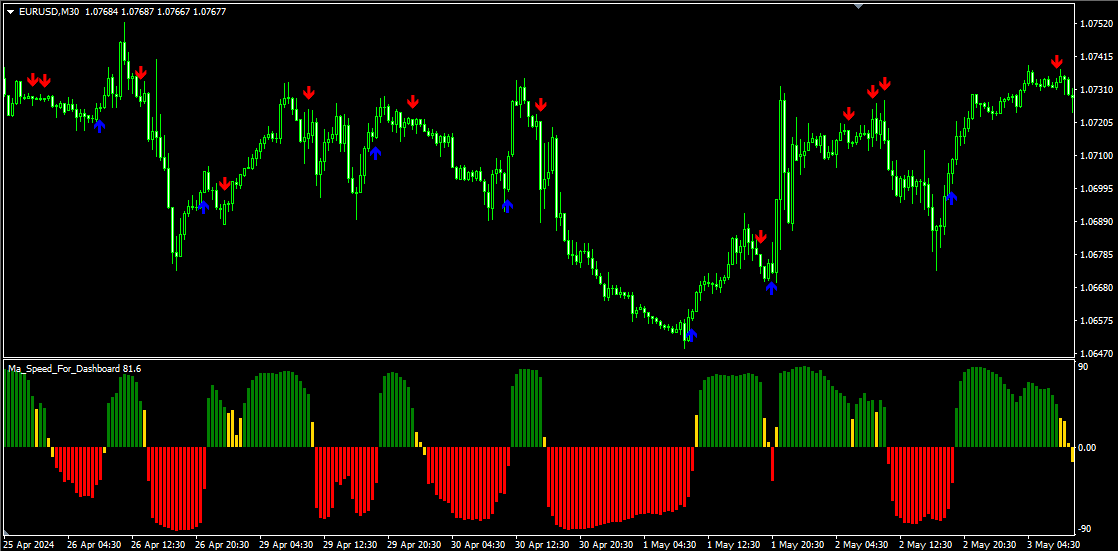

Great dashboard based on the innovative idea of MA angle changes on various instruments desired. The steeper the MA angle, the greater the momentum. Find the instruments with best momentum. Very clever idea. The bonus indicator is very helpful and gives great signals based on the same concept of MA angles, fully customizable.