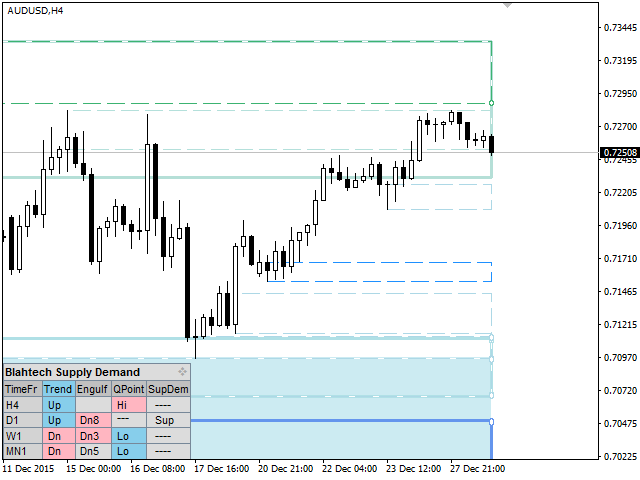
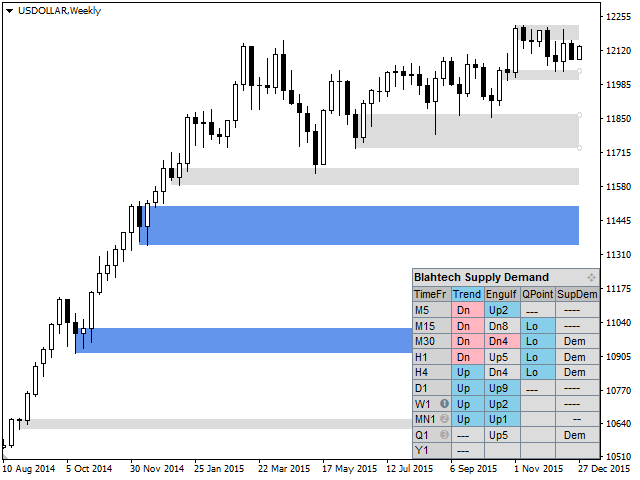
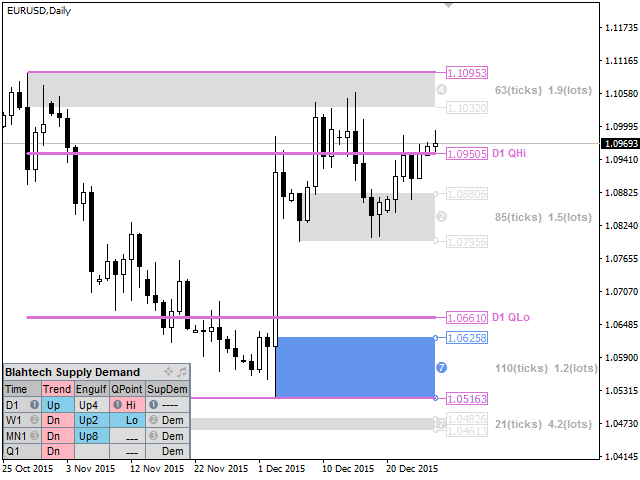
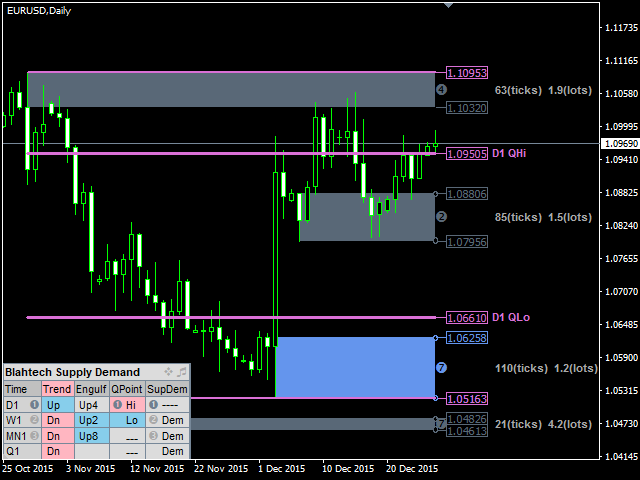
Blahtech Supply Demand
- 指标
-
Blahtech Limited
 Professional IT developer with over 20 years of experience working with top tier investment banks (Barclays Capital, Credit Suisse, Merrill Lynch, ABN Amro, Mizuho Bank) - LinkedIn profile available on request
 - 版本: 4.3
- 更新: 2 七月 2024
- 激活: 10
Was: $299 Now: $99
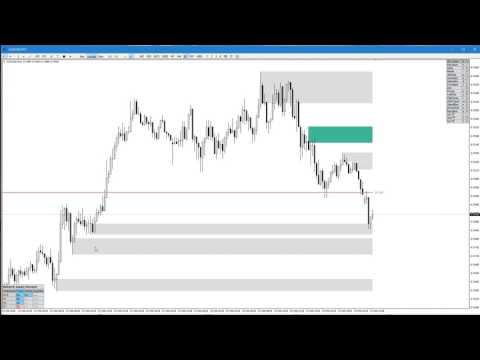
Supply Demand uses previous price action to identify potential imbalances between buyers and sellers. The key is to identify the better odds zones, not just the untouched ones.
Blahtech Supply Demand indicator delivers functionality previously unavailable on any trading platform. This 4-in-1 indicator not only highlights the higher probability zones using a multi-criteria strength engine, but also combines it with multi-timeframe trend analysis, previously confirmed swings and engulfing detectors. Driven by an easy to use interface and innovative backtest mode this indicator is a must-have for all supply demand traders.
Links [ Install | Update | Documentation & Training ]
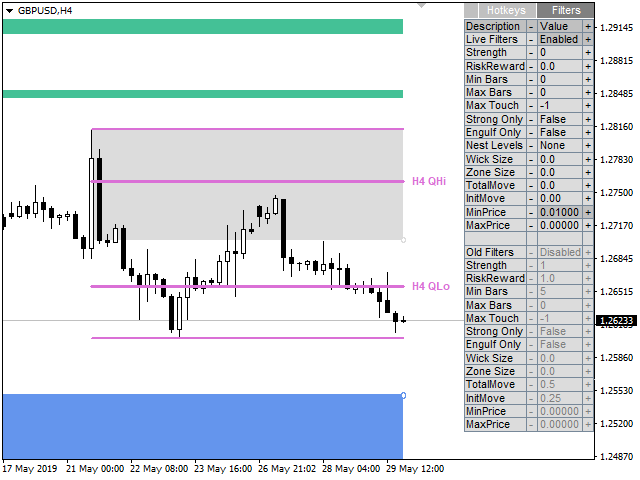
Feature Highlights
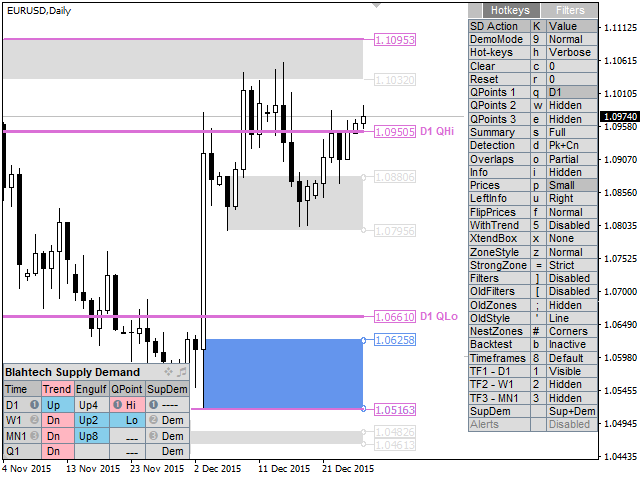
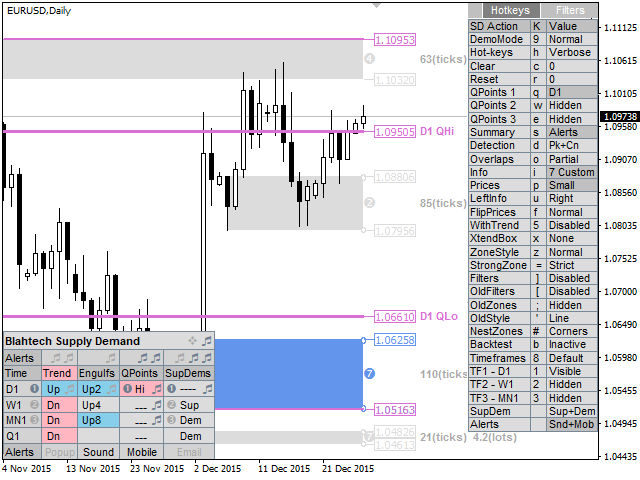
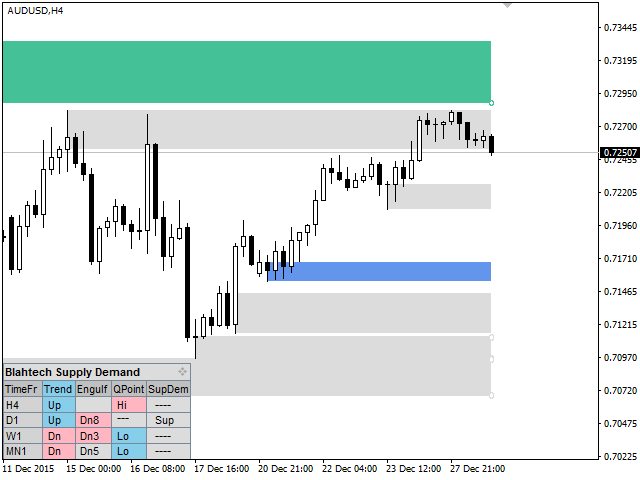
- Multi-timeframe display
- Backtest directly on the chart
- Summary panel
- Multi-timeframe trend analysis
- Confirmed swings (High and Low QPoints)
- Zone strength engine (seven criteria)
Feature Highlights continued...
- Advanced level detection (peaks, consolidations, drop-base-drops)
- Fast access hot-keys
- Alerts
- Engulfing detector
- Visibility Filters
- Old zones (broken levels or trend changes)
- Highlight of Nested zones
Input Parameters
- Download documentation using link above for details


This is hands down one of the best indicators I’ve ever purchased from the MQL market. I’ve also bought other tools from the same developer, and they never disappoint. It delivers incredibly valuable levels like Supply/Demand zones, Trend analysis, and QPoints, which are super responsive and easy to integrate into your trading strategy. Despite packing tons of features, it’s lightweight and won’t slow down your MT4 platform. The developer is both skilled and approachable—they reply quickly to questions and go the extra mile to help. If you’re looking to build an EA, they even provide sample code and troubleshoot errors with you. 10/10 recommend this tool!