Ma Speedometer Dashboard
- Indicateurs
- Version: 1.0
- Activations: 5

La version de démonstration n’est pas utile. Vous ne comprendrez rien en regardant les chiffres clignotants. Il s'agit d'un tableau de bord. Essayez de comprendre le concept et je vous aiderai pour le reste.
Les symboles doivent être séparés par des virgules (,) et doivent être saisis dans les paramètres exactement comme affichés par votre courtier, afin de s'assurer qu'ils soient reconnus dans le tableau de bord. Ces symboles seront utilisés pour l'analyse par l'indicateur.
D'un simple clic, vous pouvez ouvrir n'importe quelle paire et n'importe quel intervalle de temps directement depuis le tableau de bord.
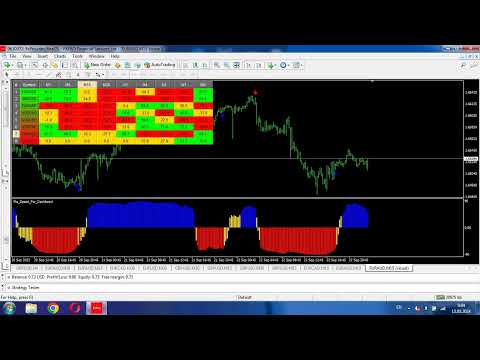
Le MA Speedometer Dashboard est un indicateur très fonctionnel pour MetaTrader 4 (MT4), conçu pour améliorer les stratégies de trading grâce à une analyse dynamique du marché. Il offre des fonctionnalités puissantes pour identifier les tendances du marché, négocier sur des marchés latéraux et sortir des conditions de marché plat, le tout basé sur les angles des moyennes mobiles. En bonus spécial, les clients reçoivent également une version spéciale de l’indicateur MA Speedometer, qui sert de base au tableau de bord.
Caractéristiques principales :
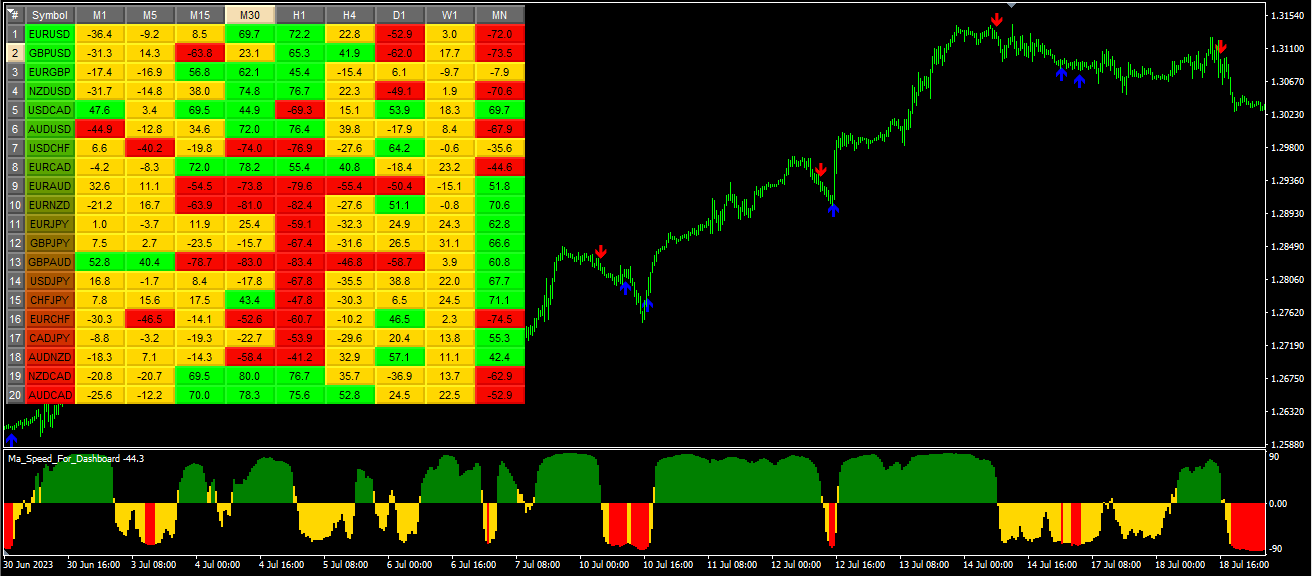
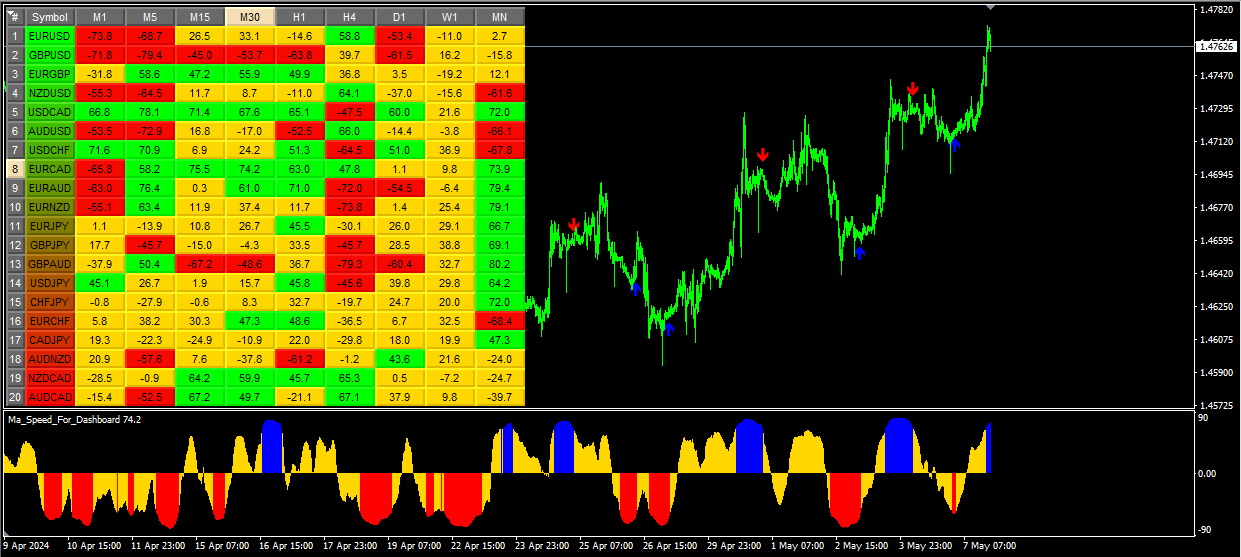
Analyse des tendances : Le tableau de bord utilise les angles des moyennes mobiles (MA) pour détecter les tendances potentielles du marché. Les traders peuvent facilement repérer le début de tendances haussières ou baissières fortes grâce aux signaux codés par couleur :
- Vert : Indique le début d'une forte tendance haussière, offrant une opportunité d'entrée.
- Rouge : Indique le début d'une forte tendance baissière, offrant également un point d'entrée.
- Jaune : Signale des marchés latéraux ou plats, suggérant des points de sortie potentiels.
Surveillance multi-temporelle : Le tableau de bord prend en charge plusieurs périodes de temps, de M1 à MN, permettant aux traders d'analyser les conditions du marché à différents niveaux de détail. Cette fonctionnalité convient à différents styles de trading, qu'il s'agisse de day trading ou d'investissement à long terme.
Tableau de bord interactif : L'interface interactive permet aux traders de naviguer rapidement entre différentes paires de devises et intervalles de temps. En cliquant sur le tableau de bord, MT4 ouvre automatiquement un graphique pour la paire et l'intervalle sélectionnés, améliorant ainsi l'utilisation et l'efficacité.
Paramètres personnalisables : Les traders peuvent personnaliser la période de la moyenne mobile, la méthode et les seuils d'angle pour aligner le tableau de bord avec leurs stratégies de trading préférées. Cette flexibilité rend l'outil adaptable à diverses conditions de marché et approches de trading.
Alertes visuelles : Le design intuitif du tableau de bord inclut des alertes visuelles et des étiquettes faciles à lire pour différentes conditions de marché. Cette fonctionnalité améliore la perception de la situation, aidant les traders à prendre rapidement des décisions éclairées.
Offre spéciale : En tant qu'offre spéciale, les clients reçoivent une version unique de l’indicateur MA Speedometer en cadeau. Cet indicateur forme la base du tableau de bord, permettant une analyse encore plus détaillée.
Description des paramètres d’entrée :
- Symbols : Ce paramètre est une entrée de chaîne de caractères où vous pouvez spécifier une liste de symboles séparés par des virgules (,). Ces symboles seront utilisés pour l'analyse par l'indicateur.
- StartBar : Ce paramètre est une entrée numérique qui représente la barre de départ pour calculer l'angle de la moyenne mobile.
- MaPeriod : Ce paramètre est une entrée numérique qui représente la période utilisée pour calculer la moyenne mobile.
- MaMethod : Ce paramètre est une entrée énumérée qui représente la méthode utilisée pour calculer la moyenne mobile. Il peut prendre des valeurs de l'énumération ENUM_MA_METHOD, qui inclut probablement des options telles que la Moyenne Mobile Simple (SMA), la Moyenne Mobile Exponentielle (EMA), etc.
- Level_Up_M1 à Level_Dn_MN1 : Ces paramètres sont des entrées numériques qui représentent les niveaux supérieurs et inférieurs pour les différentes périodes de temps (de M1 à MN1). Ils sont utilisés pour déterminer la couleur de fond des boutons en fonction de l'angle de la moyenne mobile.
- X-Size et Y-Size : Ces paramètres sont des entrées numériques qui représentent la largeur et la hauteur des boutons, respectivement.
Résumé : Le MA Speedometer Dashboard offre aux traders un outil complet pour l'analyse du marché, adapté à la fois aux traders de tendance et à ceux qui préfèrent les marchés latéraux. Sa flexibilité, son interface interactive et ses paramètres personnalisables en font un ajout précieux à tout ensemble d'outils de trading, aidant à naviguer avec plus de précision et de perspicacité dans les complexités du marché des changes.


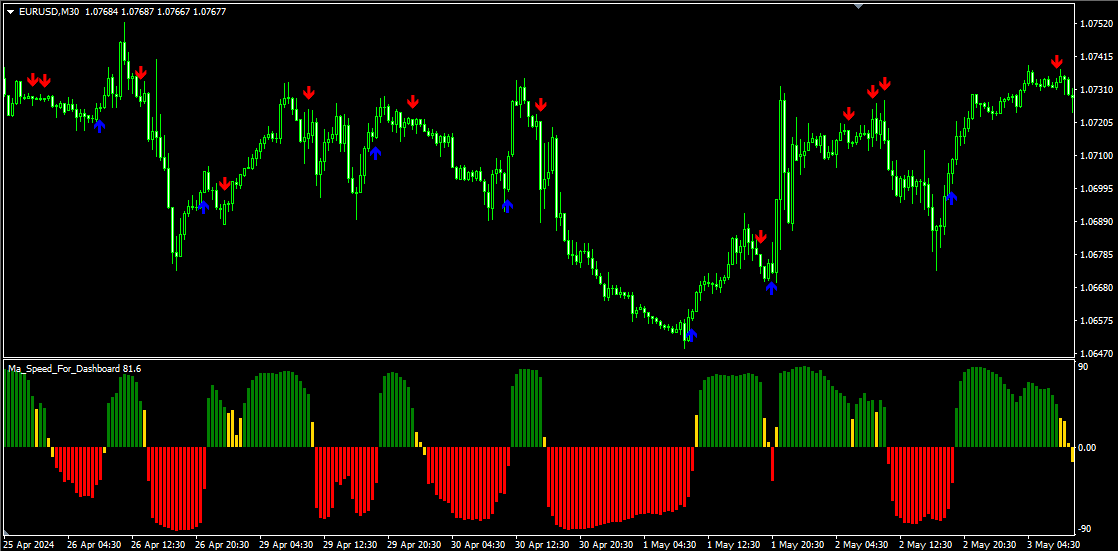

Great dashboard based on the innovative idea of MA angle changes on various instruments desired. The steeper the MA angle, the greater the momentum. Find the instruments with best momentum. Very clever idea. The bonus indicator is very helpful and gives great signals based on the same concept of MA angles, fully customizable.