Simply The Best Pro
- 指标
-
Szymon Palczynski
 The world of grids and martingale.
Innovative solutions for currency markets. - 版本: 1.60
- 更新: 22 一月 2024
- 激活: 5
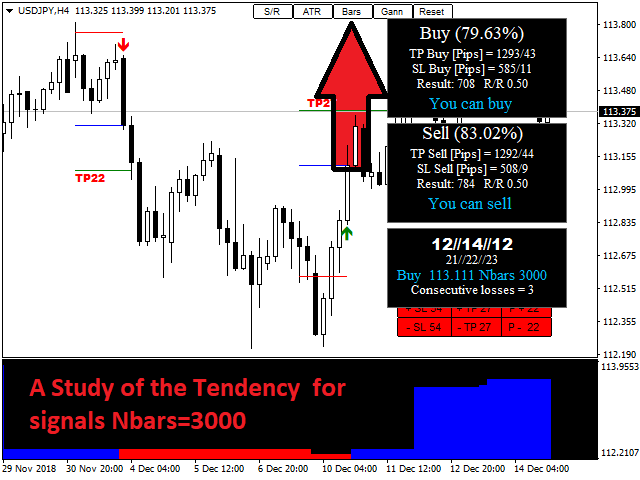
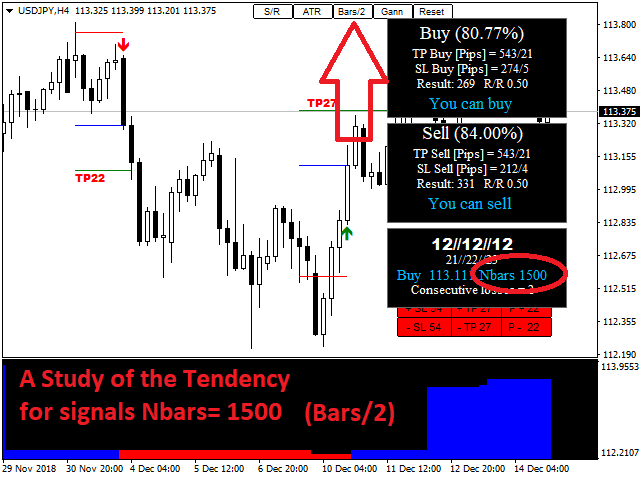
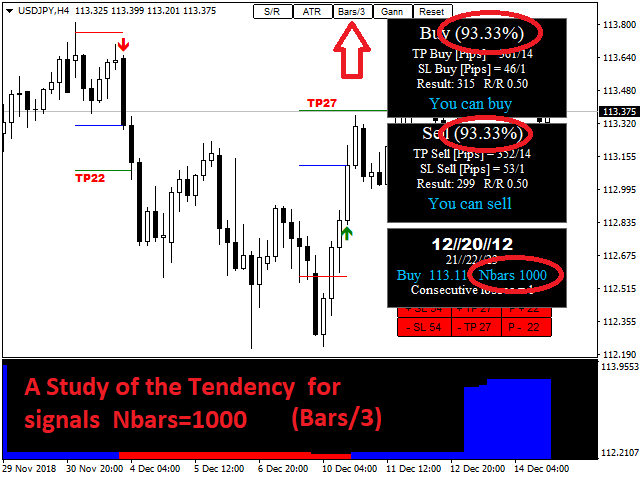
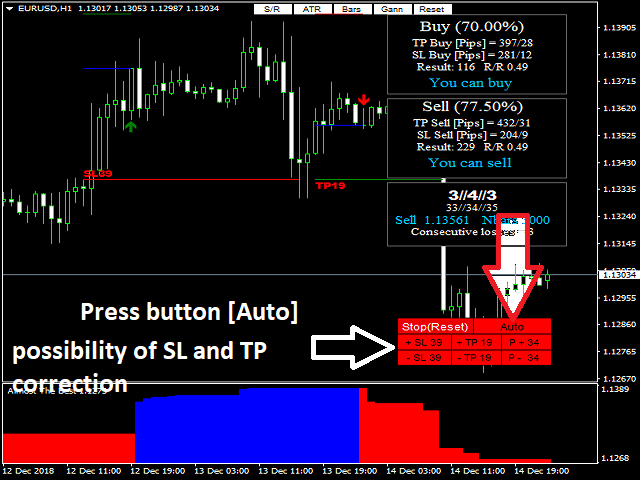
This indicator displays the histogram and arrows on chart. When Simple The Best Pro are placed on a chart, they identify the trend. The color of may be blue or red. The blue color stands for upside moves and the red color stands for downside trends. The indicator offers to set Stop Loss (SL) and Take Profit (TP) setting. The default value is ATR. Indicator has automatic optimization. The STB is a unique indicator that shows the tendency (button Bars) of a particular signals. The STB tells us when there is a good signal.
Optimization is the basis of this indicator. My analyzes and entries https://www.mql5.com/en/users/stiopa
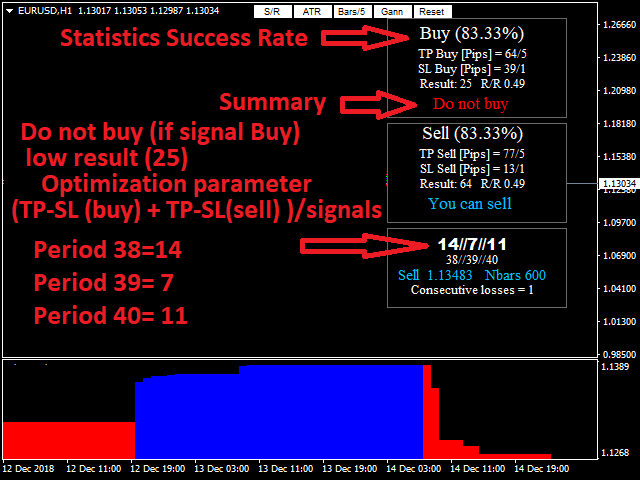
Automatic Optimization
- QuickSort (button on chart) - period is calculated on each new bar or on each mouse movement.
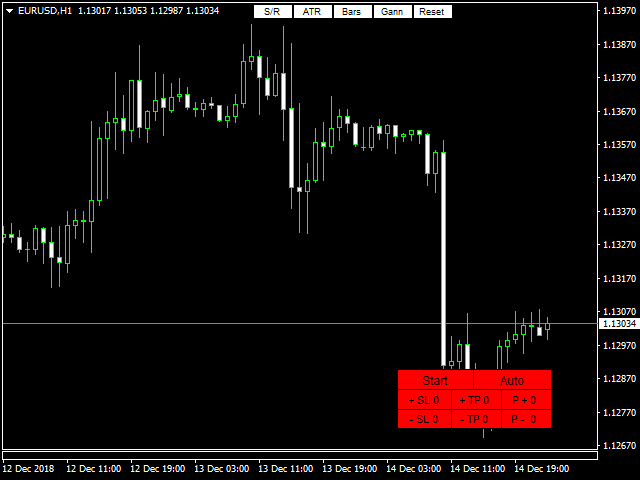
- Auto (button on chart) - accurate optimization.
Features and benefits
- Very simple.
- Never repaints.
- Honest Indicator.
- Never recalculates.
- Very low CPU usage.
- Automatic Optimization.
- Signals on the "Close of the bar".
- Works in all time frames and all symbols.
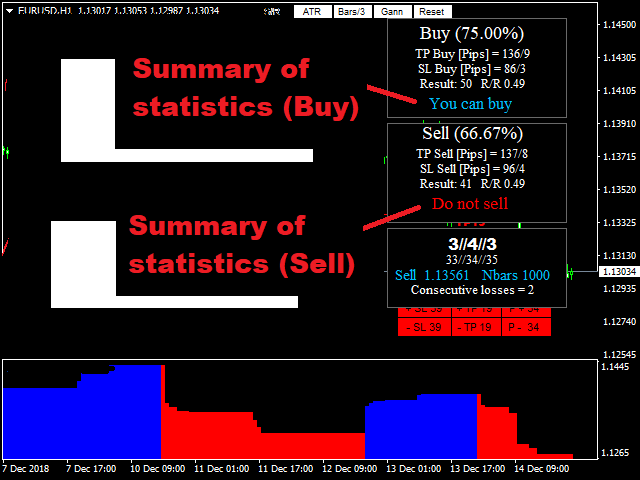
- Important statistical improved the overall performance of this indicator.
What we have
- Signals, TP and SL.
- Important statistical.
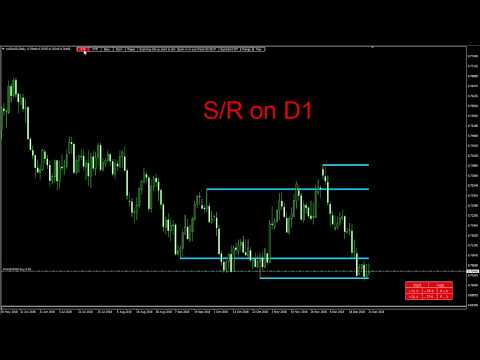
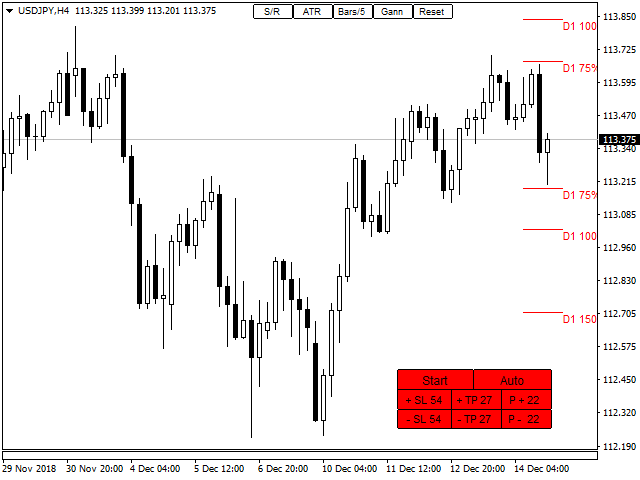
- ATR levels with D1 and W1.
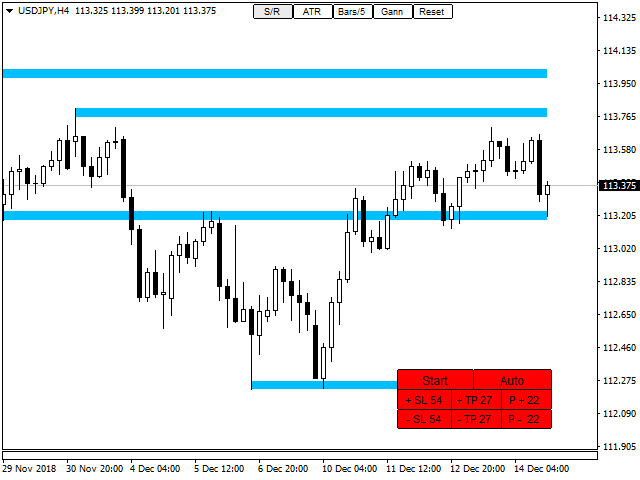
- Levels of support and resistance
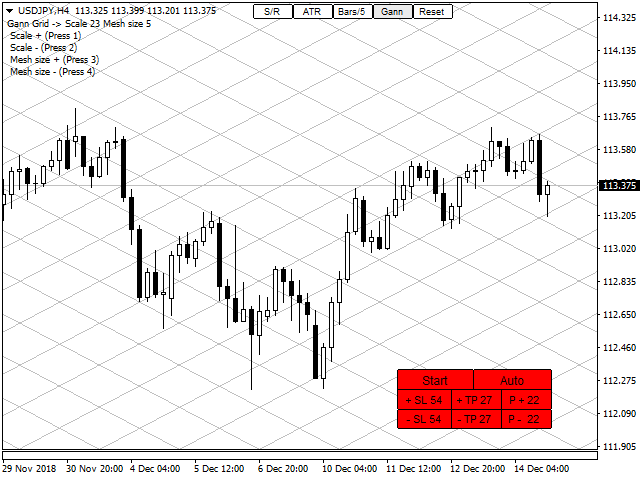
- Gann Grid with a convenient setting. The settings are automatically saved separately for H1, H4, D1. Exist in the client terminal during 4 weeks since their last use, then they are automatically deleted.
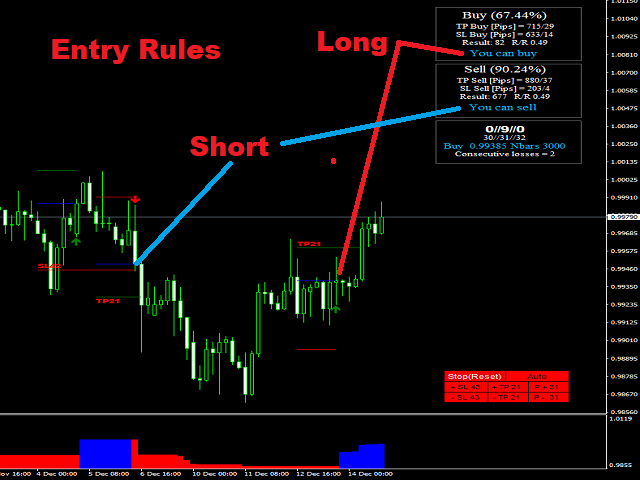
Entry Rules
- Long: see screenshot.
- Short: see screenshot.
Input Parameters
- SL - SL=Stop Loss(true) or SL = Change Of Trend(false).
- Bars - the number of bars used to calculate the trend.
- Font - font on chart.
- Color ATR- default Turquoise.
- Color Digits - default white.
- Color Gann Grid - default silver.
- Alert - enables sound alerts.
- Push Notifications - enables smart phone alerts.
- PrtSc - PrtSc on the "Close of the bar" (function of updating).


Very fine trading tool !!