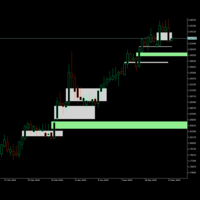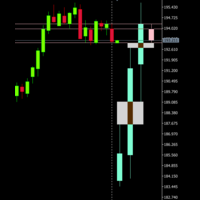
Aklamavo HTF Candles with ICT FVG

If you like this product, please give it a  5 star rating as a token of appreciation.

This indicator projects Higher-Timeframe (HTF) candles onto the current chart and optionally shows their OHLC lines and Fair Value Gaps (FVGs) using ICT 3-candle logic.

Projects multiple higher timeframe candles.
Accurately preserves HTF OHLC on any lower timeframe.
Allows spacing adjustment between projected candles.
Optionally displays OHLC horizontal reference lines.
Automatically detects and draws HTF Fair Value Gaps.
Ensures all objects always update cleanly.
Works on any timeframe and symbol.

推荐产品
Easy SMC Trading
Israr Hussain Shah
3 (3)
结构趋势自动风险/回报区间及结构突破扫描器 版本:1.0 概述 结构趋势自动风险/回报区间是一款综合交易系统,专为依赖价格行为和市场结构的交易者而设计。它结合了平滑趋势滤波器、摆动点检测和结构突破 (BOS) 信号,以生成高概率交易设置。 该工具的突出特点是其自动风险管理功能。一旦检测到有效的结构突破,该指标会立即计算并绘制风险/回报区间(1:1、1:2、1:3),并在价格触及目标时自动管理交易可视化。它无需手动绘制工具,使交易者能够专注于执行。 主要功能 动态结构突破 (BOS) 检测 自动识别摆动高点 (HH/LH) 和摆动低点 (HL/LL)。 当价格突破关键结构水平时,直接在图表上绘制 BOS 线,以确认趋势方向。 以清晰的文字标签(HH、HL、LH、LL)标记结构点。 自动扩展风险/回报工具 即时设置:当出现BOS(支撑结构)时,该工具会自动绘制入场点、止损点(位于摆动腿处)和三个止盈点。 智能线管理:“交易线”动态跟随价格。如果价格触及TP1或TP2,交易线将锁定利润(视觉上缩短交易线),以显示已锁定的目标。 点数和价值计算:交易线上的标记显示以点
Sierra Capital Session Sweep Scanner maps out the Asian, London, and New York trading sessions directly on your chart, then watches for a specific price-action pattern: a candle that spikes through the Asian session's high or low and closes back inside it — a classic liquidity sweep. What it shows: Colour-coded boxes marking the Asian, London, and NY session ranges, with the Asian high/low projected forward as reference lines Arrows marking each qualifying sweep-and-reject candle, with projected
FREE
TimeFrameLow milliseconds
Israel Goncalves Moraes De Souza
O indicador mostra o preço ou volume em milissegundos, ótimo para identificar padrões de entrada por agressão de preço ou volume e escalpelamento rápido. Características Período de tempo do WPR em milissegundos Oscilador de agressão de preço Tela personalizável O indicador pode indicar movimentos de entrada, como: Cruzamento da linha 0.0 Identificando padrões de onda A velocidade de exibição do gráfico dependerá do seu hardware, quanto menores os milissegundos, mais serão necessários do hardwar
FREE
Opening Levels Indicator MT5 Opening Levels is an MT5 indicator that displays open price levels from multiple timeframes directly on the chart. It provides a structured way to observe how price behaves around key reference levels such as the daily, weekly, and monthly open. Overview The indicator plots open price levels across selected timeframes and keeps them updated in real time. These levels can be used as reference points for: intraday trading levels market structure observation support and
FREE
Volume Profile Density v2
Vincent Jose Proenca
Volume Profile Density V2.40 显示按价格水平分布的成交量,揭示机构交易兴趣区域。 不同于按时间统计的传统成交量,它展示成交量真正集中的位置。 主要概念: 水平条 = 各价格成交量 条越长 → 成交量越大 红色区域 = 关键支撑/阻力 主要用途: 识别真实支撑与阻力 确定 POC (控制点) 定义 价值区域 (占总量的70%) 低成交量区用于止损或目标 颜色说明: 蓝色 = 低成交量(快速通过区) 黄色 = 中等成交量(平衡区) 红色 = 高成交量(机构活动区) 交易策略: 红区反弹买入 红区或VAH受阻卖出 POC突破配合成交量进场 回测POC时入场 目标设在蓝区 参数设置: 初学者:1.0 / 100% / 1.0 短线交易:0.5 / 200% / 0.5 波段交易:2.0 / 50% / 1.5 技术信息: 版本:2.40 平台:MT5 品种:外汇、CFD、贵金属、加密货币 时间周期:M1–M15 类型:实时自适应指标 总结: 成交量不会说谎——顺应成交量区域交易,而不是逆势而行。
FREE
RSI back arrows
Smaylle Rafael Coelho Mariano
The   RSI Back Arrows   indicator is a powerful tool designed for traders who rely on the Relative Strength Index (RSI) to identify potential market reversals. This indicator specifically highlights when the RSI has exited the   oversold   or   overbought   zones, providing clear visual signals to inform trading decisions. Key Features: Visual Cues : The indicator marks arrows on the chart when the RSI crosses back into a neutral zone, making it easy to spot potential entry and exit points. Over
FREE
A simple indicator that displays current profit/loss in both USD and as a percentage of capital. It also shows the spread and a countdown timer for the current candle. You can customize the display of profit/loss, spread, and the countdown timer by toggling them on or off. Additionally, you can adjust their position—for example, placing them in the corners of the screen or right next to the BID/ASK prices. I created this indicator for my own use and for my friends, so the display language is
FREE
Candle Stick Count down
Phonekeo Chanthavong
this free candle stick timer works on all symbol and all timeframe, in dicator help you to see remain time in hours, minutes, seonds until it close, it is simple and easy to use  and very light, it doesn't not consume much RAM, CPU. you can change font size and can change color of the indicator and what time frame you want it to work on, you also can choose to disable it on specifix time frame.
FREE
Session Volume Heatmap
Dang Tam Tran
5 (1)
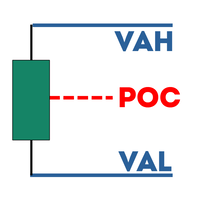
Volume Profile FREE — Multi-Session Heatmap (POC · VAH · VAL) See where trading activity actually occurs—not just where price moves. This indicator builds a clear, color-coded Volume Profile Heatmap directly on your chart and highlights the market's most important price levels: the Point of Control (POC) and the Value Area (VAH/VAL) , where price is most likely to react.
FREE
BoxProfile MT5
Evgeny Shevtsov
4.6 (10)
The indicator displays volume profiles based on the nesting principle. Profiles periods are pre-set so that each subsequent profile has a length twice as long as the length of the previous profile. In addition to profiles, the indicator displays volume clusters sorted by color, depending on the volume they contain. Indicator operation features The indicator works on typical timeframes from M5 to MN, but for calculations uses historical data from smaller timeframes: M1 - for timeframes from M5
FREE
UT Alart Bot
Menaka Sachin Thorat
4.75 (4)
To get access to MT4 version please click  https://www.mql5.com/en/market/product/130055&nbsp ; - This is the exact conversion from TradingView: "Ut Alart Bot Indicator". - You can message in private chat for further changes you need. Here is the source code of a simple Expert Advisor operating based on signals from Ut Bot Indicator . #property copyright "This EA is only education purpose only use it ur own risk" #property link " https://sites.google.com/view/automationfx/home " #property versio
FREE
(Special New Year promotion - free price!) The indicator displays the actual 'Scale in points per bar' (identical to the manual setting in the Terminal, see screenshot) in the upper right corner of the chart. The displayed value changes INSTANTLY whenever the chart scale is changed! (This is very convenient when planning screenshots). In Settings: Change language (Russian/English), font size of the displayed text, text label offset coefficient from the graph corner, equally in X and Y directi
FREE
Ultimate Retest
Nguyen Thanh Cong
5 (6)
Introduction The "Ultimate Retest" Indicator stands as the pinnacle of technical analysis made specially for support/resistance or supply/demand traders. By utilizing advanced mathematical computations, this indicator can swiftly and accurately identify the most powerful support and resistance levels where the big players are putting their huge orders and give traders a chance to enter the on the level retest with impeccable timing, thereby enhancing their decision-making and trading outcomes.
FREE
QuantMatrix Probability AI Free QuantMatrix Probability AI Free is a technical indicator for MetaTrader 5 that combines several measurements of current market conditions into three numerical estimates. The indicator uses exponential moving averages, Relative Strength Index (RSI), Average True Range (ATR) and the current price position in its calculation. These measurements are combined into a normalized market score. The resulting information is displayed on the chart as: BUY percentage SELL p
FREE
Value Chart Candlesticks
Flavio Javier Jarabeck
4.57 (14)
The idea of a Value Chart indicator was presented in the very good book I read back in 2020 , " Dynamic Trading Indicators: Winning with Value Charts and Price Action Profile ", from the authors Mark Helweg and David Stendahl. The idea is simple and the result is pure genius: Present candlestick Price analysis in a detrended way! HOW TO READ THIS INDICATOR Look for Overbought and Oversold levels. Of course, you will need to test the settings a lot to find the "correct" one for your approach. It
FREE
VWAP Personnal Custom
Vincent Jose Proenca
VWAP_PC_MQL5 — 一个简单的自制 VWAP 类指标,在 MT5 图表上实时显示成交量加权平均价。 时间框架: 适用于所有周期。 品种: 兼容外汇、指数、大宗商品和股票。 参数: AppliedPrice – 用于计算的价格类型(收盘价、典型价、加权价等) LineColor / Width / Style – 线条样式设置 SessionReset – 可每日重置或连续模式 工作原理(VWAP 原理): VWAP(成交量加权平均价)计算公式为: VWAP = (价格 × 成交量之和) / (成交量之和) 它反映买卖双方的动态平衡: 价格 高于 VWAP → 多头占优; 价格 低于 VWAP → 空头占优。 简短结论: VWAP_PC_MQL5 是一个轻量级的 VWAP 工具,结构简单但实用,帮助学习和分析成交量行为。
FREE
Haven Volume Profile
Maksim Tarutin
4.64 (14)
Haven Volume Profile 是一个多功能的成交量剖面分析指标,帮助基于交易量分布识别关键价格水平。它旨在为专业交易者提供更深入的市场理解,并帮助识别重要的进出场点。 其他产品 ->  这里 主要功能: Point of Control (POC) 计算 - 最大交易活动水平,帮助识别最具流动性的水平 Value Area 定义(增加活动区)和可自定义的成交量百分比,帮助更准确地评估交易区间 支持tick成交量和实际成交量,适用于不同市场类型和交易策略 灵活的计算周期设置(天数),使工具能够适应任何时间范围 自动适应浅色和深色终端主题,提升用户界面的可视体验 清晰的水平可视化,支持自定义样式和颜色,便于图表分析和快速决策 该指标非常适合识别重要的价格水平和整合区,帮助交易者做出更加明智的交易决策。使用 Haven Volume Profile 有助于通过更准确的成交量和市场动态分析来降低风险并增加利润。
FREE
Gold Max pro
Israr Hussain Shah
4 (1)
Here   our more valuable tools SMC Trend Trading   ,  Easy SMC Trading  ,  Institutional SMC Architect Volume Analysis Tools  ,  Volume flow Profile  ,  Market volume profile  , FVG with Volume  , Liquidity Heatmap Profile  ,  Volume Spread Analysis Automatic Professional Theme:   Instantly applies a high-contrast "Color on White" theme with DeepSkyBlue bull candles and Black bear candles for maximum clarity. Interactive Timeframe Panel:   21 vertical buttons on the left side allow for one-clic
FREE
Top Down CandleCast
Opeyemi Fuad Anokwu
投射更大的市场格局,以更高时间框架的信心交易每一个周期,并精准执行每一笔交易!   专业交易者都明白,每一笔高质量的交易都始于 自上而下(Top-Down)分析 。然而,传统的分析流程需要不断在多个图表和时间周期之间切换,这不仅打断专注力,还容易错过关键的高时间框架市场信息。 这种重复性的操作会减慢分析速度、干扰交易执行,并使交易者更难持续掌握整体市场结构。   TOP-DOWN CANDLE CAST 是一款 MT5 指标,可将 高时间框架(HTF)K线 ——包括实体、影线、开盘价、收盘价以及完整价格区间——精确投射到任意低时间框架(LTF)图表上。无需频繁切换图表,也无需凭记忆判断 HTF 结构, TOP-DOWN CANDLE CAST 能提供实时、像素级精准的可视化参考,让您的自上而下分析更加高效,进场决策更加严谨,帮助交易者: · 无需离开执行图表,即可持续掌握高时间框架市场结构。 · 在高时间框架 K 线形成过程中,实时观察其动态变化。 · 在高时间框架价格区间内,分析低时间框架价格行为。 · 在持续掌握市场整体背景的基础上,做出更加精准的交易决策。   最终,您将获得更加
FREE
Simple QM Pattern MT5
Suvashish Halder
3.75 (4)
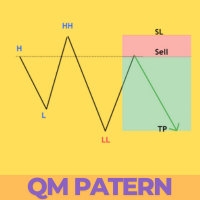
Simple QM Pattern   is a powerful and intuitive trading indicator designed to simplify the identification of the Quasimodo (QM) trading pattern. The QM pattern is widely recognized among traders for effectively signaling potential   reversals   by highlighting key market structures and price action formations. This indicator helps traders easily visualize the QM pattern directly on their charts, making it straightforward even for those who are new to pattern trading. Simple QM Pattern includes d
FREE
昨天的最高价和最低价、本周开盘价、上周的波动区间,正是多数交易者每天早上都要手动重画一遍的那几条线。 Daily Weekly Monthly Key Levels   会用你自己经纪商的 K 线自动画好,并告诉你当前价距离每一条有多远。放到多近都不会丢,因为 任何跑出视野的价位都会贴到图表边缘 ,变成带名称和价格的标签,并配一个箭头。没有信号,不重绘,也不会把图表堆满。 它画什么 前一日 的最高价、最低价和收盘价。 前一周 的最高价和最低价。 当日与当周开盘价 ,也就是盘中被高度关注、仍在走的开盘价。 前一月 的最高价和最低价(可选)。 每个价位都是一条带名称的线,按周期配色;紧凑的面板按周期分组,列出全部价位、各自的价格,以及当前价距离它有多远。距离可以按点数、按价格或按百分比显示。 放大后也不会消失的价位 在盘中周期的图表上,你的关键价位多数都落在可见价格范围之外;黄金上更是几乎全部、几乎全天如此。看不见的价位比没用还糟,因为你会默认它离得很远。任何跑到视野上方或下方的价位,都会以一个小小的价格标签贴到图表边缘,标签上有它的名称、价格,以及指出它在哪一侧的箭头。画面外的价位有好几
FREE
IBI Vwap
Brahim Eljaziri
IBI Vwap draws the Volume-Weighted Average Price calculated on the real volume of the exchange , with ±1 and ±2 standard-deviation bands. What you see VWAP : the average price paid by all participants since the session start, weighted by real traded volume. Institutions use it as a benchmark: above it buyers are in control, below it sellers are. ±1 and ±2 standard-deviation bands : how far price stretches from its average. The ±2 band marks an extension zone. Short labels on the right: VWAP (wit
FREE
Volume Above Average Indicator - MQL5 Introduction The Volume Above Average Indicator is a custom indicator for the MetaTrader 5 (MQL5) platform that helps traders identify the current trading volume compared to the historical average. The indicator uses three different sensitivity levels to classify volume into weak, medium, and strong, providing a clear visualization of market momentum. Key Features Displays trading volume in a separate window. Compares the current volume with the historical a
FREE
VWAP Fibo Bands RSJ
JETINVEST
4.83 (12)
VWAP Fibo Bands RSJ 绘制所选周期的 VWAP,并按斐波那契比例在其周围构建通道带。 该指标在 VWAP 周围绘制 10 个通道水平。这些通道显示价格偏离成交量加权平均价的程度,可作为规划入场、出场和止损的参考水平。 在 30 分钟及以下的时间周期上,这些通道最容易解读。 输入参数 Calculation Volume Type Calculation Price Type VWAP Period Time 每条通道带与 VWAP 之间保持固定的斐波那契距离,因此可以在不同交易日之间比较相同的水平。 该指标适用于提供成交量数据的任何交易品种和时间周期。 如有任何问题,请给我发送私信: https://www.mql5.com/en/users/robsjunqueira/
FREE
Pivot Points Daily
Davide Zunino
4.83 (6)
The Indicator show Daily Pivot Points. It is possible to specify the number of days to display. For forex it doesn't consider the sunday session data. It is possibile to modify the color, style and  width for every level. It is better to use this indicator with timeframe not higher than Н1. 4 Levels of support and resistance with also Intermediate Levels that is possible to hide.
FREE
MA Color Candles
Vladimir Kuzmin
MA Color Candles Indicator MA Color Candles is an indicator for visually displaying market trends by coloring chart candles. It does not add objects or distort price data, instead coloring real candles based on the state of two moving averages. This enables quick trend assessment and use as a filter in trading strategies. How It Works Bullish trend: Fast MA above slow MA, slow MA rising (green candles). Bearish trend: Fast MA below slow MA, slow MA falling (red candles). Neutral state: Candles
FREE
Economic news panel
Dimitri Patrick A Daumerie
# Economic News Panel — Free Calendar & No-Trade Zone Indicator **Know when NOT to trade — at a glance.** Economic News Panel is a lightweight, non-repainting tool that puts MetaTrader 5's built-in Economic Calendar directly on your chart. No manual calendar checking, no external websites, no WebRequest or third-party API required — it reads straight from MT5's native calendar database. ## What it does The panel shows, in real time: - Whether it's currently **OK TO TRADE** or you're inside
FREE
Trading Session MT5
Kevin Schneider
3 (1)
Trading Session Indicator The Trading Session Indicator visualizes the high and low points as well as the start and end times of the Asian, London, and New York trading sessions directly on your chart. Features: Visualization of major trading sessions Highlighting of high and low points Display of start and end times for each session Customizable session times User-friendly and efficient Customizability: Each trading session (Asian, London, New York) can be individually customized to match speci
FREE
Grid Survival Ruler
Joao Prata Silva Yglesias
Grid Survival Ruler answers one question that decides whether a grid survives: how far can price move against you before the last layer is filled, and how often has THIS pair actually moved that far? Enter your spacing (% of price) and your maximum layers. The indicator draws the ladder on the chart, marks the last layer in red (book full), and shows the total adverse move in % and in price, plus how many average daily ATRs it represents. Then it tests that distance against the pair's own D1 his
FREE
La **Media Móvil de Tercera Generación (TGMMA)** es una versión avanzada del indicador estándar de **Media Móvil (MA)**. Fue descrita por primera vez por Manfred G. Dürschner en su artículo "Gleitende Durchschnitte 3.0" (en alemán). Aquí están las características clave de la TGMMA: 1. **Reducción del Retraso**:    - A diferencia de las MAs tradicionales, la TGMMA reduce significativamente el retraso. Se adapta más rápidamente a los cambios de precios, lo que la hace ideal para traders que busc
FREE
该产品的买家也购买
Trend Sniper X
Sarvarbek Abduvoxobov
4.86 (44)
Trend Sniper X 是一款适用于 MetaTrader 5 的多周期趋势跟踪指标,可帮助交易者清晰精准地识别趋势方向和潜在的反转点。 适用于 MT4: https://www.mql5.com/en/market/product/193245 价格信息: 当前价格为促销价,随着后续更新和新功能的推出,价格可能会有所变动。 赠品优惠: 购买后联系作者,即可免费获取该指标的 Auto-Trade Assistant EA(自动交易助手 EA)。 Code2Profit 频道 通过多时间框架分析掌控市场! 如何使用 Trend Sniper X 最大化您的胜率:核心规则与交易时段技巧 技术规格 平台 MetaTrader 5 指标类型 多时间周期趋势指标 运行时间周期 任何图表时间周期,可独立选择更高的时间周期 (M1–MN1) 主要交易品种 外汇、黄金 (XAUUSD) 及其他差价合约 (CFD) 推荐账户 任何账户类型 可视化 彩色趋势蜡烛 (买入/卖出/微弱/变化) + 买入/卖出箭头 附加模块 交易时段方框 (悉尼、东京、伦敦、纽约) 主要功能 多时间周期趋势分析: 直接在
全新王者降临 - 指标 + 订单管理提示(TP1 + TP2 + TP3)+ 可选 Telegram 信号发送器 INCLUDED(免费) (完整交易与信号系统) 我们最强的黄金 EA: Gold Slayer 该指标包含先进的交易策略、可自定义订单管理系统,以及结合 Envelope 扩展的均值回归系统,并通过 RSI 等多重智能确认过滤器进行验证,以捕捉高概率反转入场机会,提供 BUY 与 SELL 信号。 你不仅能够学习如何交易,还能学会如何高效管理多个仓位,并利用之前盈利的持仓来覆盖亏损交易。 专为 M5 周期打造并优化,在 BTCUSD 和 XAUUSD 上表现尤为出色,因为这些市场的流动性能够让信号更加干净、可靠。 该指标会自动生成清晰的多头(Long)与空头(Short)信号,同时基于 ATR 自动计算入场位、止损位和止盈位,让风险管理从一开始就融入系统之中。 多 TP 系统设有三个渐进式目标位,你可以在 TP1 锁定部分利润、在 TP2 继续持仓,并在更大的行情中将仓位持有至 TP3,而这正是平均风险回报比真正开始大放异彩的地方。 默认参数开箱即用,已经针对稳定表现进行
Smart Trend Trading System — MetaTrader 5 购买后,请在 MQL5 上给我发消息,即可免费获得 Smart Universal Expert Advisor,以及在线课程、PDF 手册和私人群组访问权限。 STTS 将趋势方向、入场和出场信号、反转区域及重要价格水平集中呈现在图表上。您可以根据系统手动交易,也可以连接单独的兼容 EA,按照您选择的设置自动执行交易。 一套系统,四种交易思路 STTS 将交易方法分为四大类: • 剥头皮交易 — 跟踪短期信号和市场波动。 • 趋势交易 — 评估方向,寻找趋势中的交易机会。 • 反转交易 — 识别潜在的转折区域和方向变化。 • 成交量交易 — 利用成交量相关信息评估市场活跃程度。 入场和出场箭头、趋势信息、支撑与阻力位及反转区域,帮助您直接在图表上分析交易形态。 先从一种方法开始。了解其信号和设置后,再探索其他方法。 从信号到自动化 Smart Universal Expert Advisor 可连接 STTS,让您自动执行受支持的交易信号。 启用自动交易前,请配置指标连接、仓位大小和交易管理设置
Entry Points Pro for MT5
Yury Orlov
4.52 (153)
Entry Points Pro 会在您下单之前,告诉您在哪里入场、止损放在哪里、用多大的手数交易。 价格 现在 199 USD,按此价格出售 8 份,之后为 249 USD。最终价格为 349 USD。 我靠交易市场赚钱,并公开展示,所以我不需要把这个指标卖给所有人。它是为独立思考的交易者准备的工具,而不是一个神奇按钮。 没有突破,就没有交易。灰色箭头表示信号已取消:价格没有突破信号K线,因此没有入场,也没有亏损。 箭头在 K 线收盘时出现,并且不会重绘。只有两项设置:您的本金和每笔交易的风险。 付款前先验证:免费演示版可在 MT5 策略测试器中运行,只需两分钟。购买后,我会亲自帮您完成设置。 2019 年,我向全世界展示了这款指标的能力。我按它的信号手动交易,用的是真实账户,全程公开——账户在 Myfxbook 上接受监控,我还在 Facebook 上详细记录了这次实验。结果:10,000 美元在四个月内变成了 941,411 美元。风险是我有意设得极高的——回撤一度达到 54%,因为在我们这一行,利润和风险总是相伴而行。Myfxbook 的截图就是图库中的第一张图片。 看来
Zoryk Gold
Reda El Koutbane
4.79 (19)
折扣将在 24 小时后结束——下一价格为 69 美元 ZORYK — MetaTrader 5 专用高级 XAUUSD 黄金信号系统 你一定熟悉这种感觉。 你花了很多时间分析黄金,等待合适的入场机会。终于开仓后,价格却立刻朝相反方向移动。你过早平仓、移动止损,或者只犹豫了几秒钟。随后,市场却在没有你的情况下到达了你原本预期的目标。 问题并不总是方向判断错误。 真正的问题是缺乏确定性。 你不知道准确的入场位置在哪里。 你不知道什么时候交易逻辑已经失效。 你不知道应该先锁定较近的利润,还是继续等待更大的行情。 你也不知道当前信号是否足够强,还是自己只是在强行寻找交易机会。 黄金市场变化非常快。一个没有明确计划的好想法,可能在几秒钟内变成错误的交易决定。 ZORYK 正是为了解决这个问题而开发。 什么是 ZORYK ZORYK 是一套完整的 XAUUSD 黄金信号与交易计划系统,专门为 MetaTrader 5  和 M5 时间周期 开发。 它不是一个只显示 BUY 或 SELL 箭头,然后让你独自决定其余所有内容的简单指标。 每个确认后的信号都可以在图表上显示完整的可视化交易计划,包
M5 Sniper
MeanFX
5 (4)
让您的交易优势尽在视野之中! M5 Sniper 是 MeanFX 推出的一款全新指标。它将 精准的交易信号 与 自适应 TP/SL 水平 相结合——从而创造出最佳的统计交易机会! 每售出 5 份,价格上涨一次,下一价格为 69$ 购买后请给我发消息,以获取技巧/指南和奖励 EA 它有哪些突出优势? 经过验证的统计表现 ,适用于 Gold XAUUSD( 几乎适用于每一种资产 ,专注于掌握一个时间周期,而不是试图面面俱到却无法获得稳定的结果) 每天每个交易品种 1 至 8 笔交易 ,具有较高的胜率百分比,并让所有统计优势站在我们这一边 图表上 仅显示已确认的 BUY 和 SELL 信号 自适应 TP 和 SL 水平 ,由指标针对每笔交易生成 平均胜率 75%+ 平均 Signal Ratio 最低 1.1+ 警报 和通知也会发送至 手机 **适合 Prop Firm(资金管理公司)**的交易方式 易于理解——适合 所有经验水平 的交易者 创作者提供的个人支持 100% 不重绘、不重新绘制、不滞后 奖励自动化 Expert Advisor(EA) 背后的策略: M5 Sniper 基于
Gann Made Easy MT5
Oleg Rodin
5 (13)
Gann Made Easy   是一个专业且易于使用的外汇交易系统,它基于使用先生理论的最佳交易原则。 W.D.江恩。该指标提供准确的买入和卖出信号,包括止损和获利水平。您甚至可以使用推送通知在旅途中进行交易。 购买后请联系我,即可免费获得交易指导和超棒的额外指标! 您可能已经多次听说过江恩交易方法。通常 Gann 的理论不仅对于新手交易者而且对于那些已经有一定交易经验的人来说都是非常复杂的东西。这是因为江恩的交易方法在理论上并不那么容易应用。我花了几年时间来完善这些知识,并将最好的原则应用到我的外汇指标中。 该指标非常易于应用。您所需要的只是将其附加到您的图表并遵循简单的交易建议。该指标不断进行市场分析工作并寻找交易机会。当它检测到一个好的入口点时,它会为您提供一个箭头信号。该指标还显示止损和获利水平。 换句话说,当您像先生一样进行交易时,该指标会为您提供最佳江恩建议。江恩亲自告诉你此时此刻该做什么。但最好的部分是您不需要了解任何有关江恩交易原则的知识,因为该指标会为您完成整个市场分析工作。
SuperScalp Pro
Van Minh Nguyen
4.54 (37)
SuperScalp Pro - Professional Multi-Layer Confluence Scalping System SuperScalp Pro 是一款先进的剥头皮交易指标,在经典 Supertrend 的基础上加入了多种智能确认过滤器。它可以帮助您识别成功概率更高的 Buy/Sell 交易机会,同时显著减少虚假信号。 清晰的 Buy 和 Sell 箭头会直接显示在图表上,并实时自动计算基于 ATR 的 Stop Loss 和 Take Profit 水平。 购买后,请通过 MQL5 给我发送消息,即可免费获取 SuperScalp Pro Auto Trader EA、用户指南以及私人群组的访问权限。 下载推荐的设置文件: [Set File] 完整文档请参阅产品博客: [User Guide] 加入官方频道,获取最新更新: [Official Channel] SuperScalp Pro 如何工作? 只有当多个确认层同时满足条件时,指标才会生成信号(趋势 + 动量 + 成交量 + 波动率 + 高时间周期趋势)。 Multi-Timeframe (MTF)
Ultra Indicator
Ihor Otkydach
5 (1)
ULTRA 是一項採用「一站式」運作模式的技術指標——它能獨立分析市場、產生交易訊號、顯示設定停損單的價位,並建議何時平倉以鎖定獲利或將損失降至最低。 換句話說,無論您是否懂得分析市場、判定價位(該將停損設在哪裡),或是對資金管理感到棘手,都無妨。ULTRA 會為您處理所有這些事情! 買家專屬好禮 : 購買 ULTRA 指標後,請透過私訊聯繫我,即可免費獲贈「ULTRA BOT」。這是一款特別設計的工具,能協助您根據該指標發出的訊號來管理已開倉的交易(它會為每筆交易設定停損點,並依照策略規則自動平倉,以爭取最佳交易結果)。 我還會為買家提供各種資產的預設參數,讓該指標能發揮最大效能。請透過私訊聯繫我,免費獲得這些超級好處! ULTRA 策略的運作方式 ULTRA 指標會分析歷史價格數據(涵蓋約過去 4 年),並自動學習辨識波段反轉,以便在實際交易中為您創造最大利潤。 該指標的訊號絕不會重新繪製!!一切都盡可能做到真實且直觀! ULTRA 指標運用特殊的虛擬化演算法,根據歷史數據計算所有訊號的結果,並將其交易成果顯示於儀表板上。這意味著您甚至在開始交易之前,就能預先了解 ULTRA 指標
Gold Trend Coach MT5
Cristhian Alexander Gaibor Cuasquer
4.27 (11)
MetaTrader 5 黄金(XAUUSD)买卖信号,不重绘。每个信号都自带止损和三个止盈。Smart Money Concepts 过滤,实时标出 BOS 和 CHoCH,让你顺着结构交易,而不是逆势硬扛。面板上的实时导师,从入场到 TP3 一步步带着你走。信号直接推送到你的手机和你自己的 Telegram 频道。这就是 Gold Trend Coach。从此不再孤军奋战。 购买即送买家礼包: 1. Telegram Alert Bridge: 信号推送到你自己的 Telegram 频道,附图表截图和每日报告。 2. 使用手册和安装设置指南。 如何领取: 礼包不在下载文件里。购买后通过 MQL5 站内信联系我,当天发给你。 $39 和 $45 的首发份额已售罄。现价 $59,仅限接下来 10 份,之后 $79。 先说实话。 我自己不用的指标,绝不会拿出来卖。我每天都用 Gold Trend Coach 手动交易黄金,周期 M1、M5 和 M15,只在出现顺我方向的 CHoCH 或 BOS 之后才接信号。 你大概已经试过几十个黄金指标。大多数只给你一个箭头,然后把最难的部分丢给你:
GoldenX Entry MT5
VividMind Digital Solutions
5 (17)
GoldenX Entry 是一款用于 MT5 的指标,包含自适应 Smart Entry Trend 算法、信号评分系统、市场状态识别器以及波动率过滤器。每个信号都包含计算得出的入场位、三个止盈位(TP1、TP2、TP3)以及止损位。它基于多个分析层构建,旨在适应不同市场条件,将多层分析系统与内置优化器及统计跟踪系统相结合。该指标基于风险收益比(RR)指标和历史交易行为提供量化分析。 开始使用非常简单——在所选时间周期上运行优化器,然后在图表上开始使用该指标。 核心功能 GoldenX Entry 将信号引擎与内置交易管理及历史统计跟踪整合在同一图表中: - 内置优化器: 优化器可在图表上单击运行。它通过两阶段搜索流程测试200种参数组合——先进行探索,再进行优化——并在完成后自动应用选定配置。结果会按时间周期缓存,因此当返回已优化的周期时,会立即恢复相同设置。 - 黄金品种自动周期识别: 将指标加载到任何 XAUUSD 图表(M1 到月线)。系统会自动识别当前周期并加载对应预设。共包含9个时间周期配置文件,专为黄金在标准周期上优化设计。切换周期时,参数会自动调整。 - 资金参考面
SMC Intraday Formula
VividMind Digital Solutions
5 (26)
让我们先坦诚一点。 没有任何一个指标可以单独让你实现盈利。如果有人告诉你可以,那他是在向你兜售一个梦想。任何显示完美买卖箭头的指标都可以被做得看起来毫无瑕疵——只需要放大历史中的某一段并截取成功交易的截图。我们不会这样做。 SMC Intraday Formula 是一个工具。 它为你读取市场结构,标记出概率最高的价格区域,并用简单直白的语言准确告诉你当前智能资金的行为轨迹。你仍然需要做决定。你仍然需要执行交易。但现在,你是带着精确性执行,而不是靠希望。 我们已经在黄金(XAUUSD)以及主要外汇货币对的日内剥头皮交易中使用该指标将近三年。这是我们在 M1、M5、M15 和 M30 上的日常主力工具。它之所以有效,是因为它不试图预测未来——它展示的是当前正在形成的高概率交易机会,并解释 为什么 。 它与其他所有指标有什么不同? 大多数交易指标只做一件事。移动平均线交叉。振荡指标触及某个水平。出现一个箭头。你进场交易。你亏损。你责怪指标。重复。 SMC Intraday Formula 将多个机构级概念整合为一个统一的市场解读: - 斐波那契共振引擎 不只是普通的斐波那契水平——该指标
Boba Analysis Suite
Trade Ready Solutions LLC
5 (2)
Boba Analysis Suite Boba Analysis Suite 是一款适用于 MetaTrader 5 的分析指标。它将市场结构、关键价格区域和整体市场背景整合到同一图表视图中。 该指标源于交易及交易教学的实践经验,旨在帮助用户建立有条理的分析流程:评估市场方向、识别重要价位,并结合多个时间周期进行分析。 结合市场背景进行分析 单个信号的意义取决于市场背景。Boba Analysis Suite 帮助用户将当前图表状况与更大范围的市场结构相结合,并根据预先制定的规则评估交易思路。 分析功能包括: **趋势与市场结构:**评估市场方向及相关结构背景。 **关键价格区域与价位:**在图表上直观标示值得进一步分析的重要区域。 **多时间周期:**整合不同时间周期的信息,评估整体市场背景。 **可视化分析流程:**直接在图表上查看分析信息。 自主做出交易决策 Boba Analysis Suite 适合希望系统分析图表并结合多个时间周期信息的交易者。 该指标用于辅助分析,不会开仓或平仓,也不能替代交易策略或风险管理。每一笔交易的决策均由用户自行做出。 使用与许可 平台:Meta
FX Power MT5 NG
Daniel Stein
5 (33)
FX Power:分析货币强度,助您做出更明智的交易决策 概述 FX Power 是一款专业工具,帮助您全面了解主要货币和黄金在任何市场条件下的真实强度。通过识别强势货币用于买入,弱势货币用于卖出, FX Power 简化了交易决策,并帮助您发现高概率的交易机会。不论您是想跟随趋势还是通过极端的 Delta 值预测反转,这款工具都能完美适应您的交易风格。别再盲目交易——用 FX Power 让您的交易更加智慧。 1. 为什么 FX Power 对交易者极具价值 实时货币和黄金强度分析 • FX Power 实时计算并显示主要货币和黄金的相对强度,助您全面了解市场动态。 • 监控领先或落后资产,轻松识别值得交易的货币对。 全面的多时间框架视图 • 跟踪短期、中期和长期时间框架的货币和黄金强度,以便将您的交易策略与市场趋势保持一致。 • 无论是快进快出的短线交易还是更长期的投资策略, FX Power 都能为您提供所需的信息。 Delta 动态分析用于趋势和反转 • 极端 Delta 值常常预示反转机会,而平缓的 Delta 变化则确认趋势延续。 • 使用 Delta 分析,轻
Gold Entry Sniper
Tahir Mehmood
5 (23)
Gold Entry Sniper – 专业多周期ATR黄金交易仪表盘,适合黄金剥头皮与波段交易 Gold Entry Sniper 是一款先进的 MetaTrader 5 指标,旨在为 XAUUSD 及其他品种提供精准的 买/卖信号 。基于 ATR 移动止损逻辑 和 多周期分析仪表盘 ,适合剥头皮交易者与波段交易者,帮助识别 高概率黄金入场点 。 主要功能与优势 多周期信号分析 – 同时显示 M1、M5、M15 趋势方向。 基于ATR的动态止损 – 根据波动性自动调整。 专业图表仪表盘 – 展示信号状态、ATR水平、线性回归中线和交易方向。 清晰买卖标记 – 自动箭头与文字标签提示。 离场提示与交易管理 – 自动检测离场信号锁定利润。 全面自定义 – 调整仪表盘位置、颜色、字体及参数。 专为黄金优化 – 适用于 M1至M15 黄金剥头皮 ,也适合外汇、指数与加密货币。 为什么选择 Gold Entry Sniper? 为追求 快速、精准、可视化交易决策 的交易者打造,ATR 与多周期确认结合,帮助你抓住 最佳黄金入场点
M1 Sniper MT5
Oleg Rodin
5 (7)
M1 SNIPER   是一款易于使用的交易指标系统。它是一个专为 M1 时间框架设计的箭头指标。该指标可以作为独立的系统在 M1 时间框架下进行剥头皮交易,也可以作为您现有交易系统的一部分使用。虽然该交易系统专为 M1 时间框架交易而设计,但它也可以用于其他时间框架。我最初设计此方法是为了交易 XAUUSD 和 BTCUSD。但我发现这种方法在其他市场交易中也同样有用。 指标信号既可以顺势交易,也可以逆势交易。我教授一种特殊的交易技巧,帮助您利用指标信号进行双向交易。该方法基于使用特殊的动态支撑位和阻力位区域。 购买后,您可以立即下载 M1 SNIPER 箭头指标。此外,我还为所有 M1 SNIPER 工具用户免费提供下方屏幕截图所示的 Apollo Dynamic SR 指标!这两个指标的组合可以帮助您更轻松、更准确地利用 M1 时间框架进行交易。 购买后请联系我,免费获取交易提示和奖励指标! 祝您交易成功!
FiboSniper Pro
Van Minh Nguyen
5 (4)
FiboSniper Pro – Multi-Filter Fibonacci System with Auto SL/TP and Control Panel FiboSniper Pro 是一款技术指标,将动态 Fibonacci Envelopes 与多个确认过滤器相结合,以生成经过筛选的 Buy 和 Sell 信号。Fibonacci 水平基于 Moving Average 和 ATR 计算,然后通过 ADX、EMA、RSI、ATR、Volume、Time 和 Candle 结构进行过滤。该指标直接在图表上显示基于 ATR 自动计算的 Stop Loss 和 Take Profit 水平,并提供交互式控制面板,以便快速调整参数。 购买后,请通过 MQL5 给我发送消息,即可免费获取 Auto Trader X,以及有关如何将该指标的交易信号自动化的说明。 用户指南和设置文件: [Click here] 完整文档请参阅产品博客: [Click here] 加入官方频道获取最新更新: [Click here] 专为偏好结构化入场和清晰风险管理的交易者设计,适用于 Gold (XAU
Apex Patterns PRO 购买指标 — 免费获取基于该指标的 Expert Advisor。 自我优化的图表形态与突破分析智能 传统的形态扫描器依赖固定输入,在市场波动和结构发生变化时通常表现不佳。 Apex Patterns PRO 旨在适应不断变化的市场条件,将结构性图表形态识别、动量过滤和统计自我优化结合到一个分析框架中。 适应性扫描引擎 自我优化形态模式 在近期历史数据中自动搜索合适的形态参数,使指标能够根据当前市场行为调整其结构检测,而不是使用静态配置。 智能突破过滤 将经典形态识别与动量、成交量和价格行为指标相结合。引擎不会同等对待每次突破,而是评估潜在的市场结构,以识别符合当前统计环境的交易设置。 主要功能 固定的、不重绘的实时信号 自我优化的形态检测参数 丰富的图表结构库(顶部/底部、头肩顶/底、三角形、楔形) 基于动量和成交量的突破过滤 基于市场结构的动态止损和止盈水平 图表信号和实时性能指标 标准的推送、电子邮件和平台提醒 专为适应不断变化的市场条件而设计,而非依赖永久固定的参数 核心理念 目标不是将静态的几何形状强加于动态的市场。 目标是让历史市场数据
Auto Optimized SpeedAngle 是一款机构级的动量向量化系统,通过持续的前瞻优化(Walk-Forward Optimization, WFO)彻底消除了曲线拟合(curve-fitting)。该指标没有采用在市场 状态转换时容易失效的静态输入参数,而是利用出样外验证(Out-of-Sample, OOS) dynamically 动态重新校准设置,从而确保显示的 信号代表真正的统计优势,而非历史巧合。 核心机构级架构 前瞻优化引擎(Walk-Forward Optimization Engine): 核心算法持续扫描数千种回溯周期(lookback)与阈值组合,严格将数据划分为样本内(in-sample)和样本外(out-of-sample)。只有当参数配置在未知数据环境中证明具备数学优越性时,系统才会对其进行 adoption。 量化目标函数(Quantitative Objective Functions): 优化引擎不一味追求绝对毛利,而是聚焦于机构级的稳定性指标。用户可针对系统质量数(SQN)、期望值(每笔交易的平均 R 倍数)或净 R 值进行优化,从而优
SQN Max indicator for MT5 by ITC
Renaud Herve Francois Candel
Sqn Max Indicator Sqn Max is an exclusive indicator to trade the market with high effectiveness. The indicator is based on price action, volatility and trend. This indicator is as simple as possible but not too simple. The indicator can generate alerts to ease the trading process. You don't have to stay all day in front of your screen. The indicator can be used with any class of assets and with any time frame. It is possible to achieve better results trading our list of selected assets. We achi
下一次更新 — 版本 2.52 即将推出![全新功能] 准备迎接 4 项重大新功能,全面提升您的市场分析能力与交易流程! 我们将通过 4 项全新功能,进一步提升市场分析水平,满足您的交易需求。现为您介绍: 1. TRADE OVERVIEW DASHBOARD 2. CONFLUENCE AT ZONE 3. STRONG & WEAK HIGH/LOW 4. OTE 1. TRADE OVERVIEW DASHBOARD 一个帮助您更轻松地了解整体市场状况的仪表盘,为您的交易决策提供参考指引,帮助您系统地分析市场并规划交易,所有信息尽在一个屏幕中。 多时间周期市场概览(Multi-Timeframe Market Overview) 更清晰地了解市场方向与价格结构 快速查看市场状况 为系统化市场分析和入场规划提供指引。 2. CONFLUENCE AT ZONE 当价格进入关键区域时……您将了解有多少项支持因素相互吻合。 关键区域是交易决策至关重要的地方。但仅仅是价格进入某个区域还不够。此功能可帮助您在入场交易前,识别相互吻合的因素,包括信号及其他相关因素,从而进行更全面的分析,并
Divergence Bomber
Ihor Otkydach
4.89 (94)
购买该指标的每位用户将额外免费获得以下内容: 原创工具“Bomber Utility”,该工具会自动跟踪每一笔交易,设置止损和止盈点,并根据策略规则自动平仓; 适用于不同交易品种的指标设置文件(Set 文件); 三种不同风险模式下的 Bomber Utility 设置文件:“最低风险”、“平衡风险” 和 “观望策略”; 一套详细的 视频操作手册,帮助您快速完成安装、配置并开始使用本交易系统。 注意: 要获取以上所有赠品,请通过 MQL5 的私人消息系统联系卖家。 我为您介绍原创的自定义指标 “Divergence Bomber”(背离轰炸机),它是一套基于 MACD 背离交易策略 的“全功能”交易系统。 该技术指标的主要任务是识别 价格与 MACD 指标之间的背离,并发出交易信号(包括推送通知),指示未来价格可能的运动方向。平均而言,这些信号的准确率超过 98%。有关该指标如何工作的详细说明,请观看本页面上的视频演示。 该系统使用 止损订单 和 动态回撤平仓机制 来管理交易。 Divergence Bomber 指标的主要特点: 支持交易的品种: AUDCAD、AUDCHF、AUDS
Power Candles MT5
Daniel Stein
4.58 (12)
Power Candles V3 - 自我优化的强度指标 Power Candles V3 把货币与品种的强度直接转化为图表上可执行的交易方案。指标不再仅根据强度给K线着色,而是在后台持续运行实时自动优化,为您正面对的品种给出最佳 Stop Loss、Take Profit 与信号阈值。一键采用,Entry、Stop Loss、Take Profit 线就以精确价格绘制在图表上,提醒消息中直接包含方向。 本工具是 Stein Investments 生态系统的一部分 - 18+ 款工具,加上 Max,您的一对一 AI 交易导师。  随时在线,深入了解每一款指标,在您需要梳理思路的那一刻就在那里。  立即认识他: https://stein.investments 每根收盘K线运行 3,000+ 次交易模拟。9 种强度状态。2 种策略并行测试。一键采用最优配置。 为什么需要这个 大多数强度指标只给您一个数值,然后留下三个问题:相信哪个阈值、用哪个 Stop Loss、走哪个交易方向。Power Candles V3 在每根收盘K线上自动回答这些问题。结果就是一个完整的交易方案 -
货币强度向导是一个非常强大的指标,为您提供成功交易的一体化解决方案。该指标使用多个时间范围内所有货币的数据来计算这个或那个外汇对的力量。此数据以易于使用的货币指数和货币电力线的形式表示,您可以使用它们来查看这种或那种货币的力量。 您所需要的只是将指标附加到您要交易的图表上,该指标将向您显示您交易的货币的真实强度。该指标还向您显示买卖量压力的极值,您可以在顺势交易时利用这些压力。该指标还显示了基于斐波那契的可能目标。该指标可用于各种交易时间范围。该指标支持各种货币对的交易。   该指标为您提供所有类型的警报,包括推送通知。 购买后请联系我。我将与您分享我的交易技巧,并免费为您提供丰厚的红利指标! 祝您交易愉快,获利丰厚!
Atomic Analyst MT5
Issam Kassas
4.51 (65)
Atomic Analyst — MetaTrader 5 购买后,请在 MQL5 上给我发消息,即可免费获得 Smart Universal Expert Advisor,以及在线课程、PDF 手册和私人群组访问权限。 Atomic Analyst 将价格行为、趋势方向、入场和出场信号、止损位及多个止盈位集中呈现在图表上。 看清信号,理解交易形态 Atomic Analyst 将分析结果整理为清晰的可视化信息: • 买入和卖出箭头,用于识别潜在的入场机会。 • 止损位和多个止盈位,帮助规划交易。 • 趋势、强度和动量读数,用于评估市场方向。 • 多时间周期分析,用于比较更广泛的市场背景。 • 彩色K线和提醒,帮助您跟踪变化的市场条件。 结合辅助分析查看信号,再判断该交易形态是否符合您的交易规则。 从短期形态到更大级别的行情 您可以将 Atomic Analyst 用于剥头皮交易、日内交易,或跟踪持续时间更长的市场走势。 建议从 H1 时间周期开始。建议交易品种包括 EURUSD、AUDUSD 和 XAUUSD。 从信号到自动化 Smart Universal Expert A
Unix Scalper
Issam Kassas
4 (4)
Unix Scalper — MetaTrader 5 购买后,请在 MQL5 上给我发消息,即可免费获得 Smart Universal Expert Advisor,以及在线课程、PDF 手册和私人群组访问权限。 发现交易形态,看清交易计划,选择执行方式。 UNIX Scalper 将市场分析、BUY/SELL/WAIT 决策以及 Entry、Stop Loss、TP1 和 TP2 水平集中在一个清晰的面板中。 看清信号与交易计划 • 明确的决策:BUY、SELL 或 WAIT。 • 明确的价格水平:Entry、Stop Loss、TP1 和 TP2。 • 多时间周期概览:比较面板中各时间周期的信号。 • 辅助分析:趋势、动量、成交量、波动率、支撑与阻力,以及市场质量。 • 灵活的布局:Minimized、Compact、Standard 或 Full。 查看信号,检查价格水平,再判断该交易形态是否符合您的交易规则。 从黄金和比特币开始 建议首先使用的交易品种:XAUUSD 和 BTCUSD。 探索短期剥头皮交易和较高时间周期分析。选择历史K线范围,通过表现曲线查看所选设置
Astral Structure
Ottaviano De Cicco
Astral Structure 评估交易形态,查看初始计划。 首发特惠 - $99. 首发结束后价格为 $149。 基于市场结构的交易形态会带来多个问题:更广的周期背景是否一致,止损参考位在哪里,目标如何确定?Astral Structure 为依据市场结构自主判断的交易者,将这些问题汇集在同一工作区。 聚焦当前相关形态。 一起查看最新符合要求的形态、方向及其条件满足情况。 观察周期间的一致性。 比较选定周期的读数,同时保持对当前形态的关注。 让初始计划与形态保持关联。 查看锚定于该形态的止损与目标参考位,无需分别拼接各项信息。 使用 Structure,以一致的流程评估最新通过筛选的形态,并同时查看其背景与初始价格计划。 结合背景解读交易形态 查看最新的 BUY 或 SELL 形态、对应的 Structure Level,以及所选的 SL 和 TP1-TP3 参考位。三栏周期矩阵显示当前图表与所选的更高周期视图,无需切换图表即可观察一致与分歧。矩阵是否显示与确认条件分别控制。 选择风险模型 止损: Confirmed Swing、ATR 或 Structure Projection
Tokyo mt5 Indicator
Vasiliy Strukov
5 (15)
Tokyo Indicator(东京指标)直观地展示了趋势方向、潜在交易信号及市场状况。 其采用颜色编码的阶梯式趋势线,以蓝色标识看涨阶段,以洋红色标识看跌阶段。配套的方向箭头会在趋势发生变化时,标示出潜在的买入与卖出机会。 内置的综合仪表盘将当前信号、市场倾向、动能、波动率及信号质量整合于同一视图中,方便交易者在观察价格走势的同时评估指标数据,无需在不同面板间切换。 凭借清晰的图表显示和简洁的市场概览,Tokyo Indicator 支持以系统化的方式进行趋势分析与交易确认。 适用于任何时间周期及各类交易品种,尤其适合黄金交易。 购买后请立即联系我,以获取专属赠品!您可以免费获得我们的“强力支撑与趋势扫描”(Strong Support and Trend Scanner)指标,请私信我! 设置说明与使用手册请见此处。 请注意:我不会在 Telegram 上出售我的 EA 或特殊参数设置(set files);我的 EA 仅在 Mql5 平台上提供,而参数设置文件仅在我的博客(此处链接)上发布。请务必警惕诈骗,切勿从他人处购买任何参数设置! 设置 ShowHUD —— 在图表上显示
Dynamic Forex28 Navigator MT5
Bernhard Schweigert
5 (1)
多货币强度与动量指标 MT5 Dynamic Forex28 Navigator 是我们长期受欢迎的指标的演进,把五种力量合而为一: Advanced Currency Strength28 Indicator(700 条评价) Advanced Currency IMPULSE with ALERT(530 条评价) Currency Strength EXOTICS GOLD Impulse with Alert CS28 Combo Signals(当前赠品) 无需购买四个指标并把它们堆在图表上。一切都合并在一个强大的指标中:28 个 Forex 货币对的强度、引领它们的市场动量,以及两者的警报——在一个窗口中,在一张图表上。 上述程序在 MQL5 Market 上合计获得超过 1,200 条评价,自 2016 年以来一直是 MT4 社区的一部分。Dynamic Forex28 Navigator MT5 延续同样经过验证的逻辑。 为 MetaTrader 5 完全重建——专为利用 MT5 原生多品种架构而设计。 用户手册: https://www.mql5.com/en/blo
Scalper Vault MT5
Oleg Rodin
5 (1)
Scalper Vault 是一套功能强大且配置完善的交易系统,专为追求日内交易稳定性的交易者而设计。 作为一套完整且独立的交易系统,该高精度指标能够为外汇和二元期权交易者提供机构级的市场分析。 购买后请联系我,获取我的独家交易技巧以及一份超值赠品! Scalper Vault 能够消除凭感觉交易和复杂的各种手动分析,让您只需专注于执行交易,并运用简单易行的交易技巧进行操作。 精准的顺势交易信号:其核心算法通过分析市场结构,仅在市场主导趋势的方向上提供高胜率信号,从而大幅减少错误的入场操作。 精确的顶部与底部探测:系统能够识别市场动能耗尽的状态,从而锁定潜在的反转区域。 基于江恩(Gann)理论的买卖区域:系统会自动绘制江恩数学市场点位,让您能清晰洞察大型机构交易者在何处寻求买入或卖出。 100% 不会重绘(Non-Repainting):一旦K线收盘,生成的信号便会永久固定在图表上。绝无动态偏移,绝无虚假信号——您在历史数据中所见,即为该指标的真实表现。 广泛的市场适用性:适用于各类货币对、黄金、指数以及加密货币交易。
作者的更多信息
If you like this product, please give it a  5 star rating as a token of appreciation. This CRT indicator draws the premium and discount zones of a single candle from any timeframe on your chart. You choose which candle (current or previous) using CandleOffset, and the indicator automatically retrieves that candle’s high, low, and midpoint which is the same as CANDLE RANGE THEORY (CANDLE RANGE THEORY). It then visually displays: Premium Zone (Upper 50%) A shaded rectangle from the candle’s midp
FREE
Aklamavo ATR
Sylvester Aklamavo
Th is i ndicator   is a versatile MetaTrader 5 tool that calculates and displays Average True Range (ATR) levels on your chart. It draws horizontal lines representing price levels based on ATR multiples from the daily opening price, helping traders identify potential support and resistance zones. 1.   Multiple ATR Levels ATR1 : Standard ATR level (default: 1x ATR) ATR2 : Intermediate level (default: 2x ATR) ATR3 : Extreme level (default: 3x ATR) Each level displays both upper (High) and lower (L
FREE
Aklamavo ADR
Sylvester Aklamavo
This indicator   is a sophisticated MetaTrader 5 tool that calculates and displays Average Daily Range (ADR) levels on your chart. It draws horizontal lines representing expected price movement ranges based on historical daily volatility, helping traders identify potential daily high and low targets. ADR (Average Daily Range)   = The average difference between the daily high and low over a specified period (default: 14 days). Unlike ATR which includes gaps between days, ADR focuses purely on int
FREE
If you like this product, please give it a  5 star rating as a token of appreciation. Inside Bar: A candle that is completely contained within the high-low range of the previous candle Outside Bar: A candle that completely engulfs the high-low range of the previous candle (also called an "Engulfing Bar") Inside Bars Consolidation Signals : Indicates market indecision/compression Breakout Setup : Often precedes significant price moves Continuation Patterns : Can signal pause in trend before con
FREE
If you like this product, please give it a  5 star rating as a token of appreciation. This indicator plots horizontal trend lines at the opening price of each quarter (Q1–Q4) on the chart. These lines visually represent quarterly open levels of the current year, which traders often use as support/resistance or reference points. Automatically plots Q1–Q4 opening levels as trend lines on the chart. Lines are dashed, colored, and labeled. Handles both current and historical quarters. Cleans up line
FREE
Aklamavo Pivot Points
Sylvester Aklamavo
If you like this product, please give it a  5 star rating as a token of appreciation. This indicator calculates and draws pivot points and support/resistance levels for both daily and weekly timeframes: Pivot (central) level Support levels S1, S2, S3 Resistance levels R1, R2, R3 It allows showing daily, weekly, or both sets of pivots , giving traders visual references for potential support/resistance areas. Pivot mode: Choose which pivots to display (weekly, daily, or both). Colors and style: C
FREE
If you like this product, please give it a  5 star rating as a token of appreciation. This indicator draws vertical lines marking key Forex trading sessions (Asian, London, New York) for a configurable number of past days. These “Silver Bullet” lines help traders quickly visualize session start and end times on the chart. DaysToDisplay: How many previous days’ session lines to show. Session colors: Customizable line colors for each session. Session start hours: Local server hours for each sessi
FREE
Aklamavo ICT FVGs
Sylvester Aklamavo
If you like this product, please give it a  5 star rating as a token of appreciation. This indicator identifies and displays Fair Value Gaps (FVG) on price charts. Fair Value Gaps are price zones where there's a significant imbalance between buying and selling pressure, creating "gaps" in price action. The indicator detects two types and when they are mitigated(touched): Bullish FVG: When a candle's low is above the high of a candle two periods earlier. Bearish FVG: When a candle's high is bel
FREE
This   ForexTrading Sessions   indicator is a powerful visual tool for MetaTrader 5 that highlights the three major forex trading sessions (Asian, London, and New York) on your chart  with the Asian Mid-line. 1. Trading Session Visualization Asian Session : 00:00 - 09:00 GMT (blue/aqua color) London Session : 08:00 - 17:00 GMT (magenta color) New York Session : 13:00 - 22:00 GMT (orange color) 2. Time Zone Adaptation TimeZoneShift   input allows you to adjust sessions to your local time Example:
FREE
If you like this product, please give it a  5 star rating as a token of appreciation. This indicator plots horizontal lines on the chart representing the previous year’s high and low prices . These levels are widely used in technical analysis as major support/resistance references. Automatically identifies the previous calendar year’s high and low . Plots horizontal lines on the chart at these levels. Customizable color, width, and style of the lines. Deletes lines on deinitialization. Updates
FREE
The indicator reads MT5’s built-in economic calendar and organizes events into three horizontal lanes : High-impact events (red) Medium-impact events (orange) Low-impact events (gray) (optional) Each lane scrolls horizontally across the chart like a ticker. You can choose whether to show: Today’s events only Or all events for the current week This is a complete fundamental dashboard for MT5. It gives you: Real-time scrolling economic events Interpreted color-coded results Day/Week filterin
This is an extremely clean, efficient, and well-designed CBDR engine. Calculates ICT’s Central Bank Dealers Range (CBDR) Using only candle bodies — NOT wicks (open–close structure). For a defined time window (e.g., 00:00–05:00 New York). For each past day and also for today in real time. Draws the following on chart: A rectangle showing the entire CBDR body range The CBDR High line (body top) The CBDR Low line (body bottom) An optional midline A pip label showing total CBDR size Optional extens
Aklamavo ICT KillZones
Sylvester Aklamavo
This MetaTrader 5 indicator plots ICT Killzone session markers on the chart using vertical lines . It draws the start and end times for three institutional trading sessions— Asian , London , and New York —for a user-defined number of recent historical days. No buffers or plots are used; instead, the indicator relies entirely on chart objects (OBJ_VLINE) . 1. Inputs and Parameters The indicator allows full customization of each killzone segment: General DaysToDisplay : number of past days to dra
This MT5 (CRT) indicator displays   key price zones   from different timeframes on your current chart, helping you visualize where price might find support or resistance based on higher timeframe structure using CANDLE RANGE THEORY. The indicator draws   three price zones   from selected historical candles: Premium Zone : Upper 50% of a historical candle's range Discount Zone : Lower 50% of a historical candle's range Midline : Exactly halfway between high and low Each zone represents an area w
Aklamavo Market Sessions Monitor-EA (Expert Advisor) is a   Global Stock Exchange Market Hours Dashboard   for MetaTrader 5. It provides a comprehensive visual display of the opening status and trading hours of 7 major stock exchanges around the world. The EA creates a real-time dashboard that shows whether each stock exchange is currently: OPEN   (Green background) CLOSED   (Red background) PRE-MARKET   (Light Green background) POST-MARKET   (Light Pink background) Unique Features: Progress Ind
This EA is an   RSI Crossover Trading System   with advanced position management features . This is not one of those EAs with fake/manipulated test results out there. RSI Crossover Advanced Robot  is robust and  suitable for traders who want automated RSI-based trading with professional-grade position management. It's particularly useful in trending markets where RSI signals can provide reliable entry and exit points. Recommended settings tested with 1HR timeframe using ICMarkets Tickers on 1 y
This is a   Cumulative Volume Delta (CVD) Indicator   for MetaTrader 5 that visualizes order flow imbalance between buying and selling pressure . The indicator calculates and displays the   cumulative difference between buying (Bid) and selling (Ask) volumes   over time, providing insights into whether buyers or sellers are controlling the market. 1. Visual Displays: Cumulative Delta Line   (Blue): Running total of volume delta across multiple bars Positive Bar Delta Histogram   (Green): Individ
Aklamavo Dom Ladder
Sylvester Aklamavo
This is a   Market Depth (DOM - Depth of Market) Indicator   for MetaTrader 5 that displays real-time order book data in a visual ladder format. The DOM provides a comprehensive view of market depth with clear visual cues for volume imbalances, making it useful for both scalping and swing trading decisions This indicator provides traders with a professional-grade market depth visualization that can be customized to match individual trading preferences and strategies.  You can easily switch betwe
This Volume Delta Profile is an advanced MetaTrader 5 indicator that visualizes   volume delta (order flow imbalance)   using a volume profile-style histogram. It shows the difference between buying and selling pressure at specific price levels, helping traders identify supply and demand zones. This indicator provides a unique perspective on market dynamics by visualizing the imbalance between buying and selling pressure, offering insights beyond traditional volume analysis. Core Concept Positiv
This Volume Footprint indicator is essentially a   professional-grade market profile tool   that provides deep insight into market microstructure, showing exactly where trading activity is occurring and who's in control (buyers or sellers) at each price level. Key Features 1.   Footprint Display Divides each bar into multiple price levels (configurable via   PriceLevelsPerBar ) Shows   BID volume   (selling pressure) on the left side of each level Shows   ASK volume   (buying pressure) on the r
筛选:
Kran5
1064
Kran5 2026.02.11 04:16 

用户没有留下任何评级信息

回复评论