MTF Candles PRO
- 指标
- 版本: 1.0

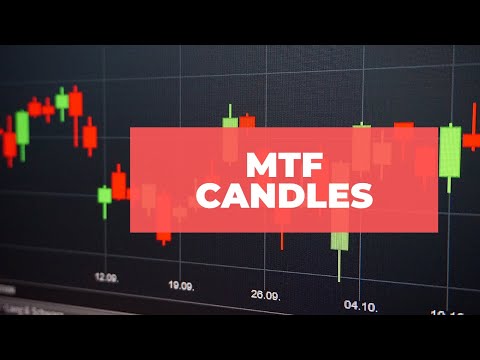
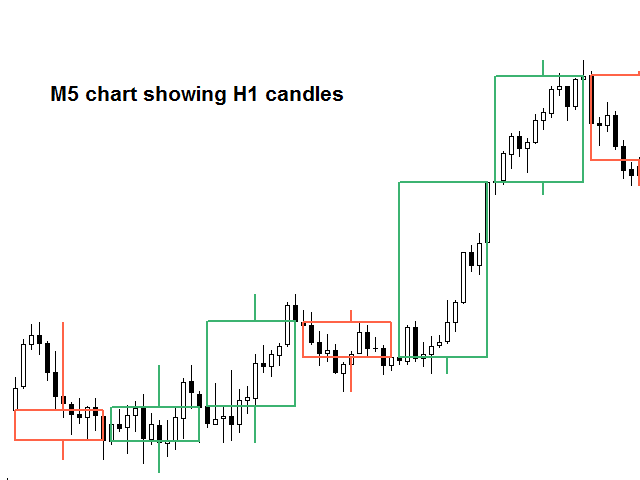
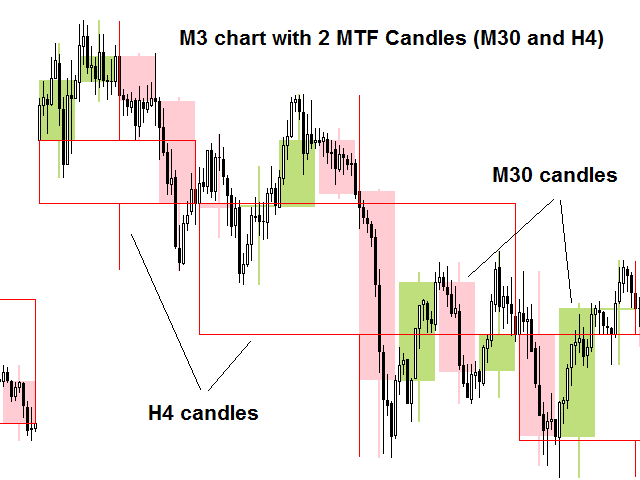
Tool that allows viewing candles in multiple timeframes. This way, it helps the analysis in multiple timeframes.
This is another product developed by Renato Fiche Junior and available to all MetaTrader 5 users!
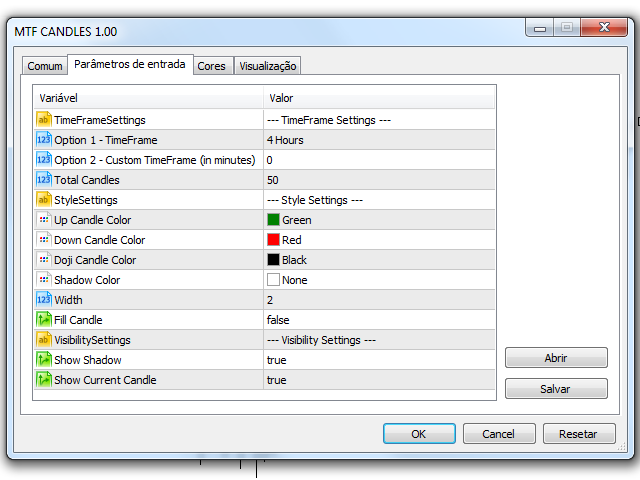
Input Parameters
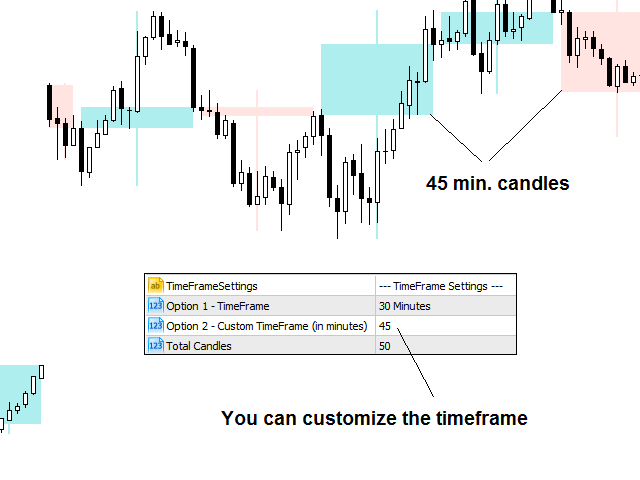
- Option 1 - TimeFrame: Standard MT5 timeframe
- Option 2 - Custom TimeFrame (in minutes): Or, if this value is different from zero, the timeframe will be customized. This allows you to choose timeframe other than the MT5 standard.
- Total Candles: Number of candles.
- Up Candle Color: Color of the high candles
- Down Candle Color: Color of the low candles
- Doji Candle Color: Color of the doji candles
- Shadow Color: Color of the candle shadows
- Width: Thickness of the candle contour line and shadows
- Fill Candle (true / false): Fill or not the candles
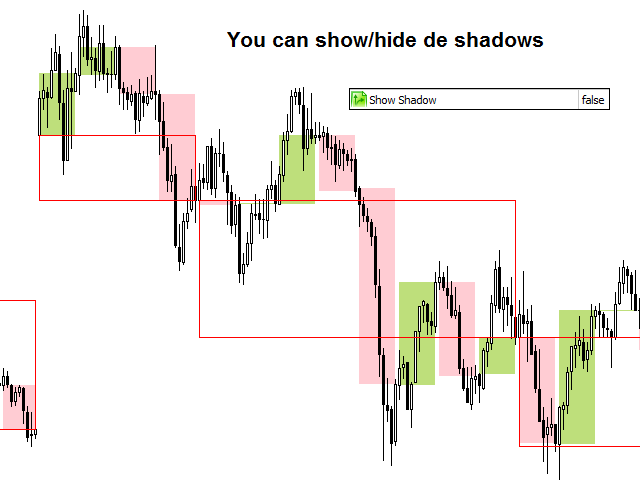
- Show Shadow (true / false): Show or not the candle shadows
- Show Current Candle (true / false): Whether or not to show the current candle


This indicator does not work. My first purchase on MQL5 has been such a bad experience. I am asking for a refund as it simply does not work. If an indicator does not work on MT5 simulator then how do you want traders to use it? It does not work on the MT5 terminal, and I was expecting a better support.