Backtesting Simulator MT5
- 指标
-
Diego Arribas Lopez
 You've been burned before. That's why you're reading this.
You bought an EA with a perfect backtest. It collapsed in two weeks live. You tried another one — same story. Maybe you've done this five times already. You're not stupid. You were just shopping in a market full of smoke. - 版本: 2.2
- 更新: 26 七月 2026
- 激活: 10
Backtesting Simulator MT5 - Manual Market Replay and Trading Practice
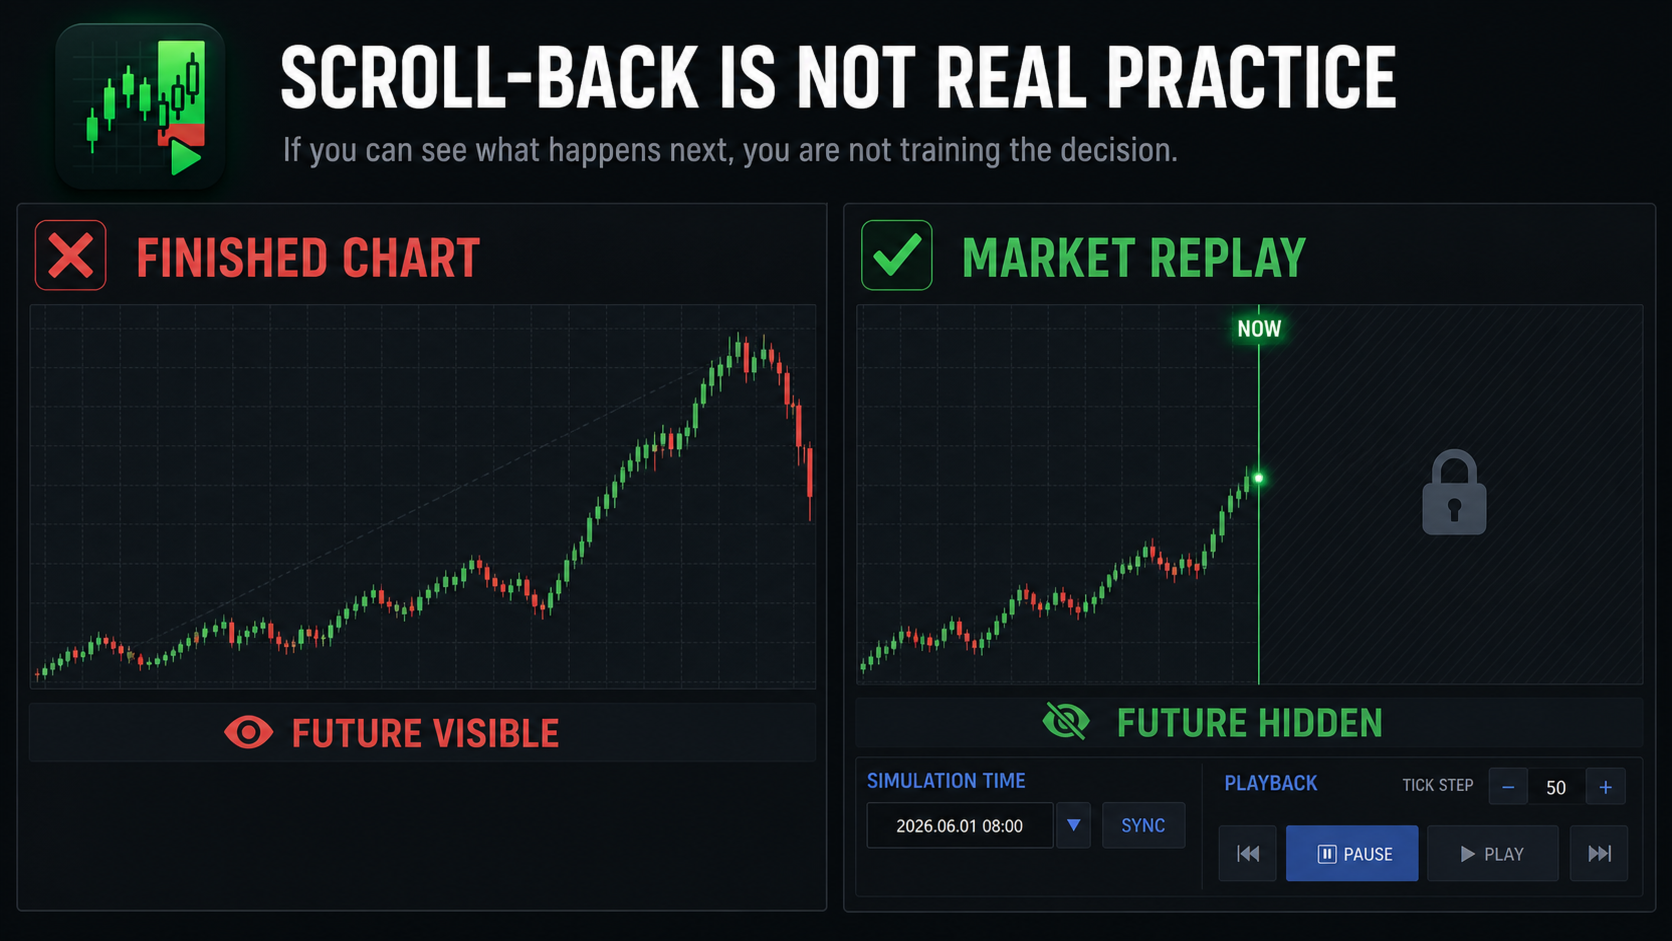
Manual backtesting on a finished MT5 chart is compromised by hindsight. You already know where price went, even when you pretend you do not.
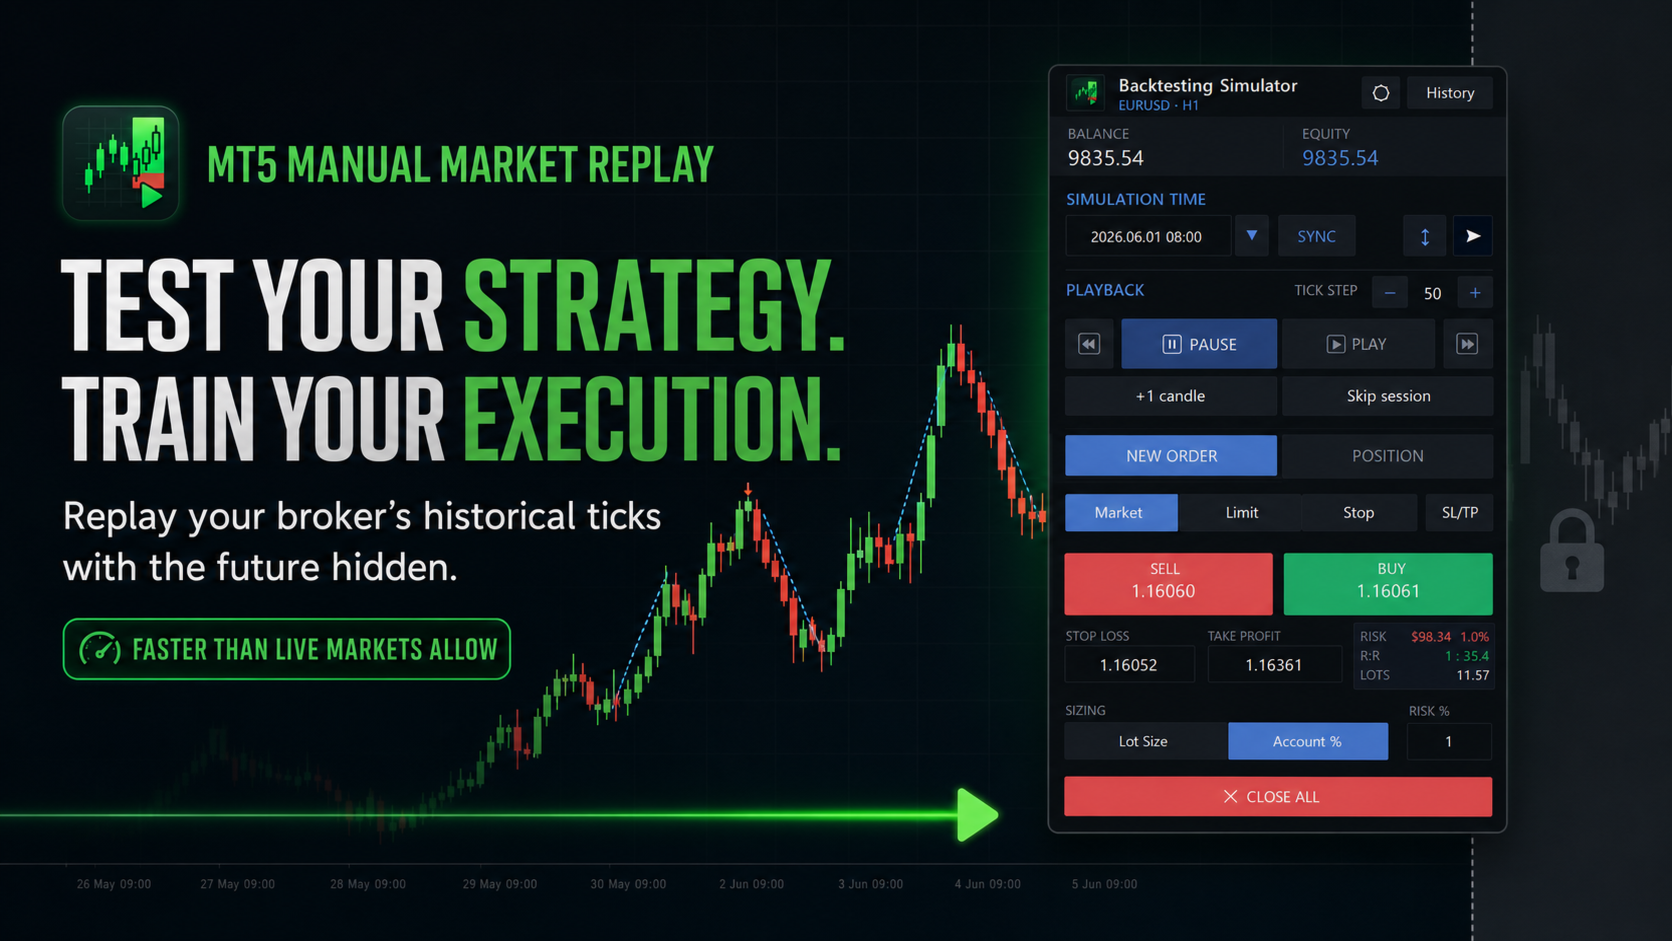
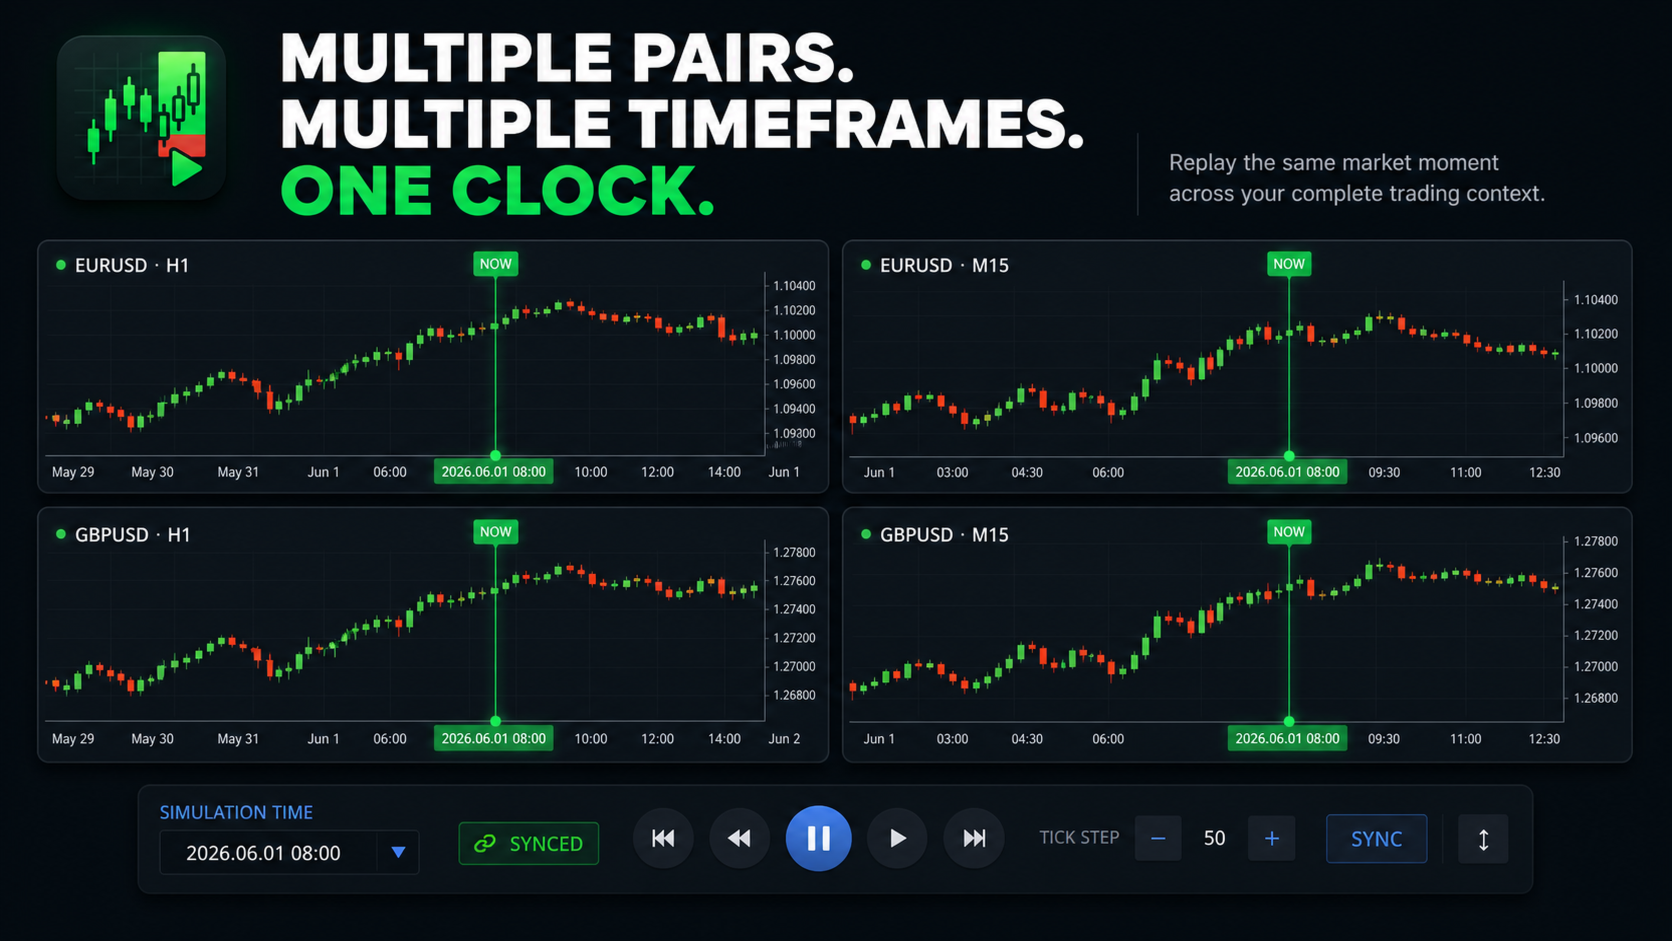
Backtesting Simulator is a manual market replay tool for MT5. Start from a historical point, hide the future, control the replay and place simulated trades as price unfolds. You find out how you actually decide when the next candle is still unknown.
REPLAY THE MARKET INSIDE MT5
- Start from a selected historical date and time.
- Play, pause and control replay speed.
- Move through ticks while keeping future price hidden.
- Use keyboard shortcuts for faster practice.
- Synchronize the workflow across supported charts.
- Customize panel colours and chart appearance.
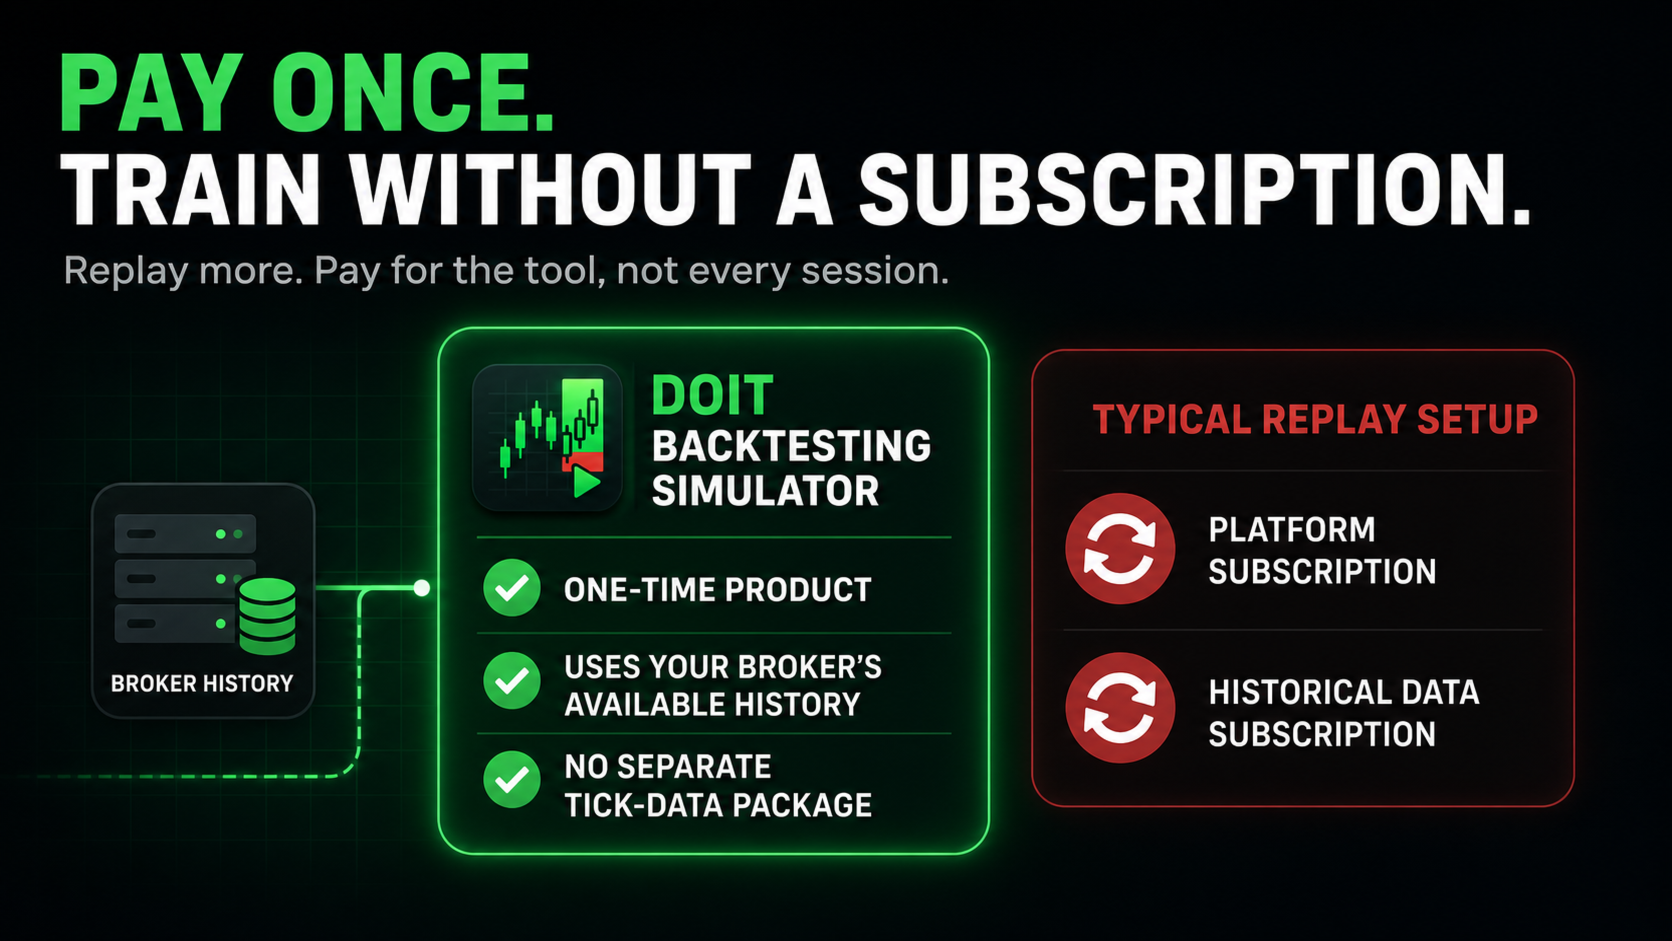
The simulator uses the historical data available from your broker. The depth of each test depends on that history.
PRACTISE EXECUTION AND RISK MANAGEMENT
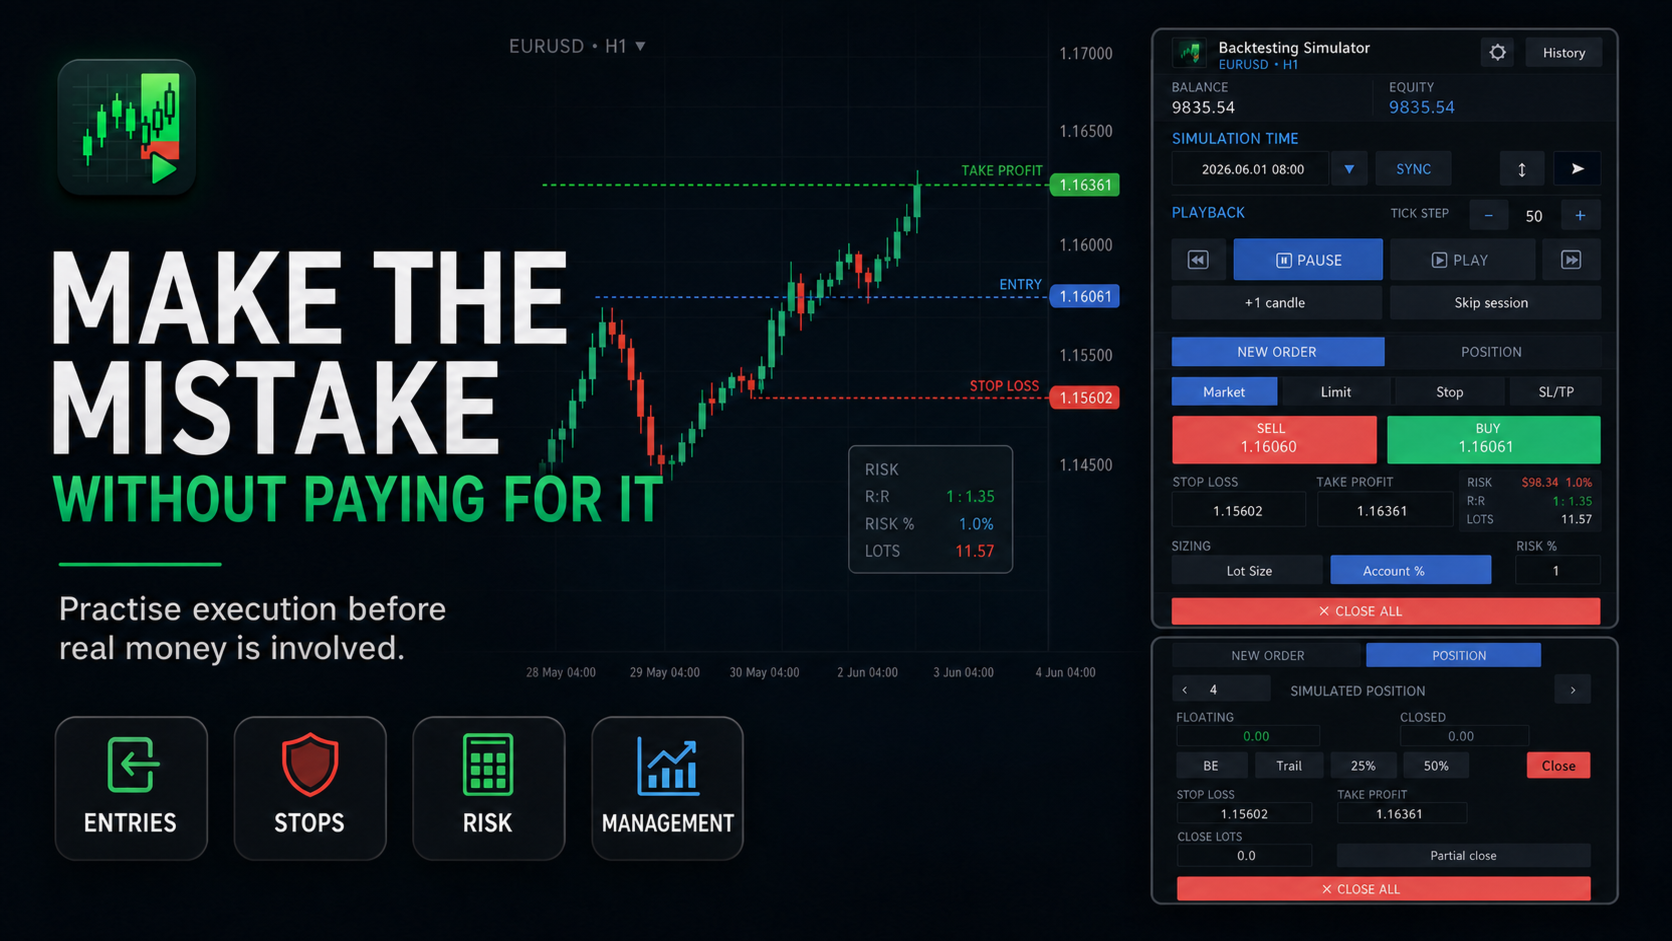
Open and close simulated positions while price unfolds. Define lot size, stop loss and take profit, then observe how your decisions affect the simulated account.
Practise entry timing without hindsight, stop-loss and take-profit placement, position sizing, partial exits, patience and consistent application of a written plan.
Trade history can be reviewed during the session and exported when the simulator closes.
FIND THE MISTAKE THE FINISHED CHART HIDES
The expensive mistake is often not the setup. It is the hesitation, late entry, moved stop or impulsive exit that disappears when you review a finished chart.
Replay forces those decisions to happen in sequence. Your exported history then shows what you did, not what you wish you had done.
BUILT FOR TRADERS WHO WANT USEFUL SCREEN TIME
Use Backtesting Simulator to review historical setups, practise a new execution model or repeat the same rules across a larger sample without risking real money.
It is for manual practice, not EA optimization. Historical replay cannot reproduce every live spread, delay or emotion, but it can expose whether your execution process survives the next unknown candle.
If you want to know whether you can execute your rules before real money is involved, replay them first.

Using this tool improved my strategy testing. I love it.