
重塑经典策略(第四部分):标普500指数与美国国债
概述
在我们的上一篇文章中,我们讨论了一种潜在的标普500指数交易策略,该策略依赖于我们使用在指数中权重较高的股票组合。在今天的文章中,我们将探讨一种利用国债收益率交易标普500指数的替代方法。多年来,每当投资者感到风险厌恶时,他们通常会从股票等风险投资中撤出资金,转而将资金存入债券和国债等更安全的投资中。相反,当投资者对市场恢复信心时,他们往往会从债券等安全投资中撤出资金,转而将资金投入股市。
基本面分析师多年来已经意识到,标普500指数的走势与国债收益率的走势之间似乎存在反向相关性。这种相关性表现为负相关,也就是说,随着投资者更多地投资于股票,他们倾向于减少对债券和国债的投资。
交易策略概述
标普500指数是衡量美国工业经济整体表现的重要基准。另一方面,国债被视为地球上最安全的投资。当投资者购买债券或国债时,他们实际上是在向发行该国债的政府提供贷款。每张国债都会支付债券票面上显示的利息票息。
当债券需求较低时,债券的收益率会上升。这是为了重新激发需求。因此,随着较少的投资者购买债券,我们会看到收益率上升。总体而言,基本面分析师长期以来一直利用这种关系来为自己谋利。如果在标普500指数中进行交易,他们会寻找趋势减弱的迹象。
因此,例如,如果债券收益率开始上升,基本面分析师会知道投资者并没有购买债券,而是可能将资金投入能够获得更高回报率的证券,如股票。
然而,如果基本面分析师注意到债券的收益率一直在下降,这表明债券的需求非常高。这将告诉基本面分析师,他可能还不应该投资股市,因为市场的整体情绪偏向规避风险,而基本面策略会利用这一点来进行仓位的调整(即买入或卖出)。
在今天的文章中,我们希望看看这种关系是否具有统计学意义,以及我们是否可以围绕这种关系构建一个交易策略?让我们开始吧。
方法论概述
为了实证检验这一策略的优点,我们将拟合各种模型,使用标普500指数本身的普通OHLC数据来预测其收盘价。从那里,我们将观察当尝试训练模型预测相同目标时,准确性发生了什么变化,但这一次模型只能访问美国5年期国债的OHLC数据。我们的观察结果使我们相信,投资者可能更适合使用标普500指数的数据。我们的模型性能水平全面下降,而且,当我们尝试使用国债数据时,误差水平的方差增加了。我们使用时间序列交叉验证(不进行随机洗牌)来比较不同复杂度的模型。
在观察误差水平的变化后,我们确定SGD回归器是表现最佳的模型,然后对模型进行了特征选择。我们的特征选择器没有选择与国债相关的任何数据,这表明这种关系可能在统计学上并不显著。尽管此时我们有足够的证据可以舍弃国债数据,但我们保留了这些数据,并继续构建我们的模型。
在将模型导出为ONNX格式之前的最后一步,我们尝试调整模型的超参数。我们使用了L-BFGS-B(有限内存Broyden-Fletcher-Goldfarb-Shanno)算法,试图为我们的模型找到最优的参数设置。我们的目标是超越默认模型设置的性能。遗憾的是,我们最终使模型过度拟合训练数据,因此未能超越默认模型。
在Python中进行数据分析探索
为了从我们的MetaTrader 5终端获取数据,我创建了一个脚本,将历史市场数据写入CSV格式供我们使用,我已附上该脚本。只需将其拖放到图表上,它就会为我们写出数据。
一旦数据准备就绪,我们首先导入所需的库。
#Import the libraries we need
import pandas as pd
import numpy as np
import seaborn as sns
一旦完成,我们将读取数据。
#Read in the data
SP500 = pd.read_csv("/home/volatily/market_data/Market Data US SP 500.csv")
T5Y = pd.read_csv("/home/volatily/market_data/Market Data UST05Y_U4.csv")
我们需要确定想要预测的未来时间范围。因此,在本例中,我们将预测未来20个时间步长的数据。
#How far into the future should we forecast?
look_ahead = 20
现在,我们还需要确保数据是从最早的一天开始,并且整个数据中最近的一天应该被舍弃(即不使用)。
#Make sure the data starts with the oldest day first
SP500 = SP500[::-1].reset_index().set_index("Time").drop(columns=["index"])
T5Y = T5Y[::-1].reset_index().set_index("Time").drop(columns=["index"])
完成上述步骤后,我们现在将对数据进行标签处理。我们将设一个标签,即标准普尔500指数未来20个时间步长后的收盘价。然后,第二个二元目标仅用于绘图目的而创建。
#Insert the label
SP500["Target SP500"] = SP500["Close"].shift(-look_ahead)
SP500["Binary Target SP500"] = 0
SP500.loc[SP500["Close"] < SP500["Target SP500"],"Binary Target SP500"] = 1
SP500.dropna(inplace=True)
既然我们已经完成了这些步骤,接下来我们将合并这两个数据集。我们将把标准普尔500指数和五年期国债收益率的数据合并到一个数据帧中。
#Merge the data
merged_df = pd.merge(SP500,T5Y,how="inner",left_index=True,right_index=True,suffixes=(" SP500"," T5Y"))
我们可以观察这个合并后的数据帧。
#Let's observe the merged dataframe
merged_df

图1:我们合并后的数据帧
我们还可以分析合并后数据帧中的相关性。我们可以观察到相关性水平大约在0.1左右,这并不强。
#Merged data frame correlation
merged_df.corr()
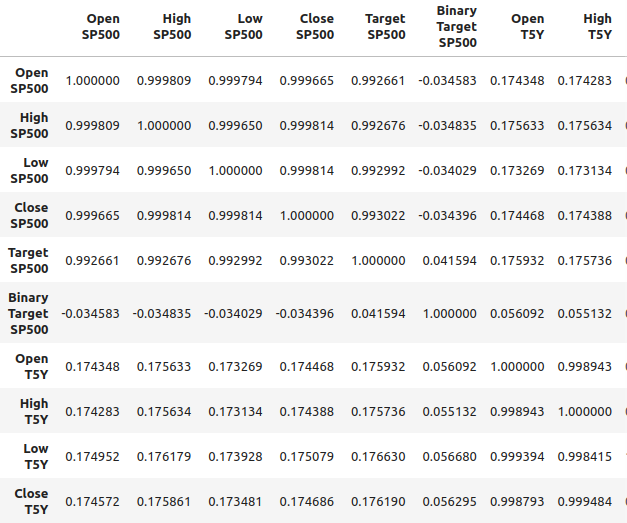
图2:合并数据帧中的相关性水平
然而,强相关性水平并不一定意味着我们正在观察的两个变量之间存在确定的关系。它也不意味着一个变量是另一个变量的原因。强相关性水平可能意味着存在一个共同因素正在影响这两个市场。
我在x轴上标明了时间,y轴上标明了标准普尔500指数的开盘价,制作了一个散点图。然后,我使用二元目标来为散点图中的点着色。请注意,蓝色和橙色的点自然地聚集在一起,这可能表明时间很好地将数据分隔开来。回想一下,我们的二元目标告诉我们未来20个时间步长内会发生什么,蓝色点表示在接下来的20个时间步长内价格下跌,而橙色点则表示相反的情况。
#It appears that one variable that separates the data well is time
sns.scatterplot(data=merged_df,x="Candle",y="Open SP500",hue="Binary Target SP500")
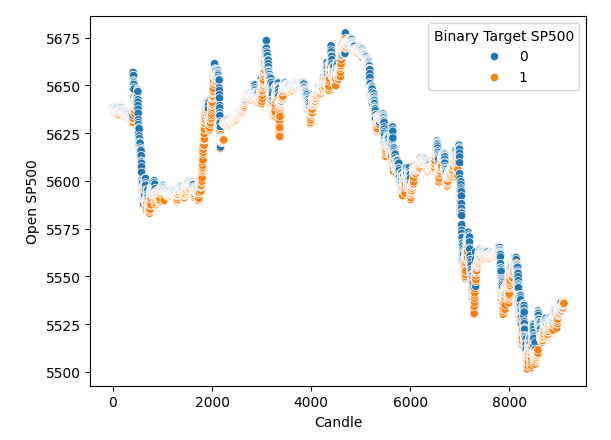
图 3:我们的数据似乎在时间上被很好地分隔开了。
因此,时间似乎很好地分隔了数据。然而,当我们尝试使用其他变量来分隔数据时,例如在这里,我们创建了一个标普500指数开盘价与5年期国债收益率开盘价的散点图。我们可以看到,得到的散点图分隔得很差,许多点彼此重叠,根本没有清晰地分隔。
#It appears that one variable that separates the data well is time
sns.scatterplot(data=merged_df,x="Open T5Y",y="Open SP500",hue="Binary Target SP500")
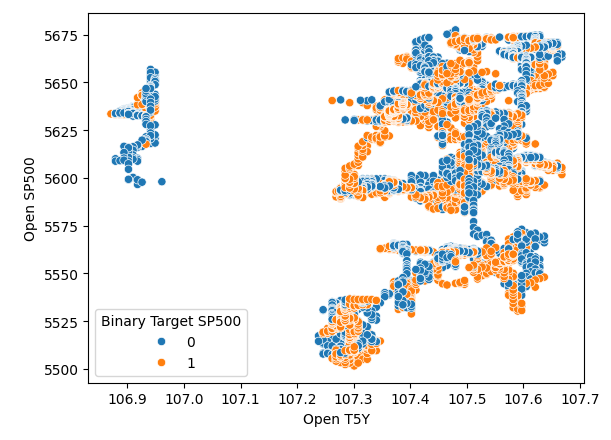
图4:分隔水平差
模型选择
完成了上述步骤后,我们将继续建模标普500指数与国债收益率之间的关系。我们将从scikit-learn中导入所需的模块。
#Import the libraries we need
from sklearn.linear_model import LinearRegression
from sklearn.linear_model import Lasso
from sklearn.linear_model import SGDRegressor
from sklearn.svm import LinearSVR
from sklearn.ensemble import RandomForestRegressor
from sklearn.ensemble import GradientBoostingRegressor
from sklearn.ensemble import BaggingRegressor
from sklearn.ensemble import AdaBoostRegressor
from sklearn.neural_network import MLPRegressor
from sklearn.model_selection import TimeSeriesSplit
from sklearn.metrics import root_mean_squared_error
from sklearn.preprocessing import RobustScaler
import time
from numpy.random import rand,randn
from scipy.optimize import minimize
然后,我们将准备创建一个时间序列拆分对象。因此,我们首先定义我们想要的拆分数量,然后创建时间序列拆分对象本身。
#Define the number of splits we want
splits = 10
#Create the time series split object
tscv = TimeSeriesSplit(n_splits = splits, gap=look_ahead)
由于模型较多,我们将把它们存储在一个列表中。
#Store the models in a list
models = [LinearRegression(),
         Lasso(),
         SGDRegressor(),
         LinearSVR(),
         RandomForestRegressor(),
         GradientBoostingRegressor(),
         BaggingRegressor(),
         AdaBoostRegressor(),
         MLPRegressor(hidden_layer_sizes=(10,4),early_stopping=True),
         ]
我将定义一个用于初始化我们模型的函数,该函数名为“initialize_models”。
#Define a function to initialize our models
def initialize_models():
    models = [LinearRegression(),
         Lasso(),
         SGDRegressor(),
         LinearSVR(),
         RandomForestRegressor(),
         GradientBoostingRegressor(),
         BaggingRegressor(),
         AdaBoostRegressor(),
         MLPRegressor(hidden_layer_sizes=(10,4),early_stopping=True),
         ]
我们还需要数据帧来存储我们的误差水平。因此,我们需要三个数据帧。第一个数据帧将存储我们仅使用标普500指数的普通开盘价、最高价、最低价、收盘价数据时的误差水平,第二个数据帧存储我们在尝试仅依靠国债收益率预测标普500指数时的误差水平。最后一个数据帧存储我们使用所有数据时的误差水平。
#Create 3 dataframes to measure our performance
#Before we do that, we will define the columns and idexes
columns = ["Linear Regression",
          "Lasso",
          "SGD Regressor",
          "Linear SVR",
          "Random Forest Regressor",
          "Gradient Boosting Regressor",
          "Bagging Regressor",
          "Ada Boost Regressor",
          "MLP Regressor"]
indexes = np.arange(0,10)


#First dataframe stores our error levels using just the ordinary SP500 OHCL
SP500_error = pd.DataFrame(columns=columns,index=indexes)
#Second dataframe stores our error levels using just the ordinary Treasury Yield OHCL
TY5_error = pd.DataFrame(columns=columns,index=indexes)
#Last dataframe stores our error levels using all the data we have
total_error = pd.DataFrame(columns=columns,index=indexes)
我们现在将定义我们的输入和目标变量。
#Now we will define the inputs and target
target = "Target SP500"
predictors = ["Open T5Y",
              "Close T5Y",
              "High T5Y",
              "Low T5Y",
              "Open SP500",
              "Close SP500",
              "High SP500",
              "Low SP500"
             ]
然后我们将重置我们合并后的数据帧的索引。
#Reset the index
merged_df.reset_index(inplace=True)
我们将使用鲁棒缩放器(robust scaler)来缩放数据。因此,我们只需实例化鲁棒缩放器,调用transform函数,并将合并后的数据帧传递给fit_transform函数。所有这些操作都将被封装在一个新的数据帧对象中,我们将使用pandas来创建这个对象。
#Scale the data
scaled_data = pd.DataFrame(RobustScaler().fit_transform(merged_df.loc[:,predictors]),columns=predictors,index=np.arange(0,merged_df.shape[0]))
进展到了这一步,我们现在就可以进行交叉验证。最简单的方法是使用嵌套循环来实现。因此,第一个for循环会遍历我们所有的模型,然后第二个循环会对每个模型分别进行交叉验证。因此,我们会先拟合线性回归模型,然后是Lasso模型,以此类推。
#Now we will perform cross validation
#First we iterate over all the models we have
for j in np.arange(0,len(models)):
    for i,(train,test) in enumerate(tscv.split(merged_df)):
        #Prepare the models
        initialize_models()
        #Prepare the data
        X_train = scaled_data.loc[train[0]:train[-1],predictors]
        X_test = scaled_data.loc[test[0]:test[-1],predictors]
        y_train = merged_df.loc[train[0]:train[-1],target]
        y_test = merged_df.loc[test[0]:test[-1],target]
        #Now fit each model and measure its accuracy
        models[j].fit(X_train,y_train)
        SP500_error.iloc[i,j] = root_mean_squared_error(y_test,models[j].predict(X_test))
        print(f"Completed fitting model {models[j]}")
完成模型拟合LinearRegression()
完成模型拟合LinearRegression()
完成模型拟合LinearRegression()
完成模型拟合LinearRegression()
至此,我们可以看到标普500指数的误差水平,线性回归在这种情况下是表现最好的模型之一,其次是SGD回归器。神经网络表现得相当差。实际上,它可能从参数调整中受益匪浅。
SP500_error
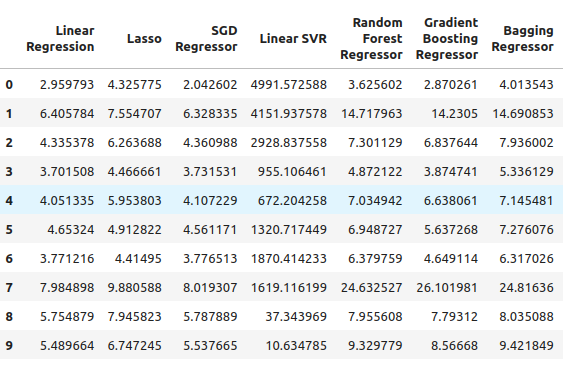
图 5:使用普通标普500指数OHLC数据时的误差水平
我们继续研究5年期国债收益率。在这种特定情况下,我们所有的模型的表现都不理想。然而,随机森林回归器表现得相当不错。
TY5_error
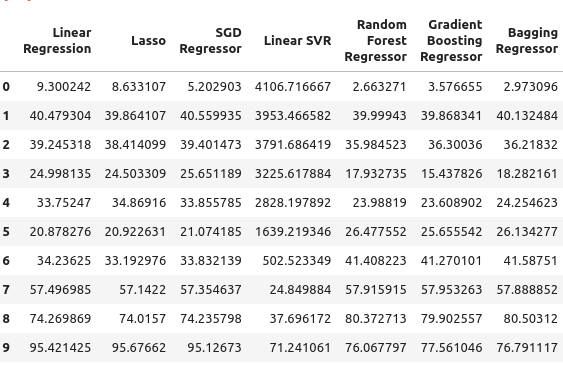
图 6:仅依赖国债收益率时的误差水平
最后,我们在使用所有可用数据时的总误差,似乎随机梯度下降回归器表现得相当不错,因此我选择了SGD回归器作为表现最佳的模型。
total_error
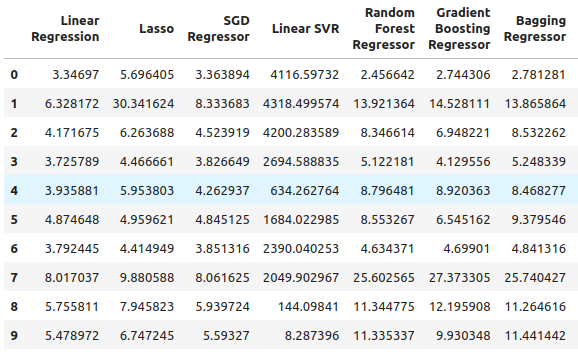
图 7:使用所有可用数据时的误差水平
特征选择
现在我们将进行特征选择,看看我们的电脑是否也认为国债收益率数据很重要。如果特征选择器舍弃了与国债收益率相关的数据,那么这对我们的策略来说可能会令人担忧,因为其表明这种关系可能不可靠。然而,如果我们的特征选择器保留了国债收益率数据,那么这可能是一个好兆头。
#Feature selection
from mlxtend.feature_selection import SequentialFeatureSelector as SFS

#Get the best model
model = SGDRegressor()
我们创建了顺序特征选择器对象,并将我们想要使用的模型传递给它。从那里,我指示算法它可以按需选择尽可能多的特征。我们本可以指定它应该选择五个特征,但我希望其选择尽可能多的、认为重要的特征。我们将forward设置为true,这意味着它将执行前向选择,并且我们传递了CV=5,表示我们将采用五折交叉验证。在此处我们传递了n_jobs=-1,这允许特征选择器并行执行此任务。
#Let us perform feature selection for the best model we have
sfs_sgd_regressor = SFS(model,
                            (1,8),
                            forward=True,
                            cv=5,
                            n_jobs=-1,
                            scoring="neg_mean_squared_error"
                           )
此时,我们拟合特征选择器。
#Fit the feature selector
sfs_1 = sfs_sgd_regressor.fit(scaled_data.loc[:,predictors],merged_df.loc[:,target])
当我们查看对模型最重要的特征时,遗憾的是,与国债收益率相关的特征一个也没有被选中。收益率仅根据标普500指数的收盘价的高点和低点来选择。这可能表明这种关系并不那么稳定,众所周知,国债收益率与标普500指数之间的相关性有时会失效。
#Which features were most important to our model?
sfs_1.k_feature_names_ 我们仍会尝试优化我们的模型,并看一下我们能提升多少性能。
#None the less, let us attempt to optimize the model
from scipy import optimize
从此处开始,我们将创建两个专门的数据集。一个用于训练和优化模型,另一个用于验证模型。在验证集上,我们将比较优化后的模型性能与仅使用默认设置的模型性能。我们希望能够优于默认的误差水平。
#Create a training and validation set
scaled_data = merged_df.loc[:,predictors]
scaled_data = (scaled_data - scaled_data.mean()) / (scaled_data.std())
#Create the two datasets
train_data , test_data = scaled_data.loc[:(scaled_data.shape[0]//2),:],scaled_data.loc[(scaled_data.shape[0]//2):,:]
请注意,这次我使用的是一种不同的缩放技术,而第一次我只是使用了鲁棒缩放器(robust scalar)。而这次,我们采用了一种非常常见的缩放技术,即从每一列中减去均值,然后再将每一列除以其标准差。
#Let's write out the column mean and standard deviations
#We'll store the mean first
#Then the standard deviation
scale_factors = pd.DataFrame(columns=predictors,index=(0,1))
#Save the mean and std value of each respective column
for i in (np.arange(0,len(predictors))):
    #Calculate and store the values of each column mean and std
    scale_factors.iloc[0,i] = merged_df.loc[:,predictors[i]].mean()
    scale_factors.iloc[1,i] = merged_df.loc[:,predictors[i]].std()

#Inspect the data
scale_factors

图 8:每一列的均值和标准差
计算得到每一列的均值和标准差是非常重要的,当我们需要在MQL5中再次工作时,会用到这些数据,因此我将这些数据写入CSV格式。
#Write it out to csv format
scale_factors.to_csv("/home/volatily/.wine/drive_c/Program Files/MetaTrader 5/MQL5/Files/sp500_treasury_yields_scale.csv")
调整SGD回归模型
现在我们将尝试调整模型,首先定义目标函数。在此情况下,目标函数将是训练集上的均方根误差(RMSE)水平,我们希望最小化训练数据上的RMSE水平。然而,这个过程是一把双刃剑。”那些在训练集上最小化我们误差的超参数并不能保证在验证集上也最小化我们的误差!
#Define the objective function
def objective(x):
    #Initialize the model with the new parameters
    model = SGDRegressor(alpha=x[0],shuffle=False,eta0=x[1])
    #We need a dataframe to store our current model accuracy levels
    current_accuracy = pd.DataFrame(index=np.arange(0,splits),columns=["Error"])
    #Now we perform cross validation
    for i,(train,test) in enumerate(tscv.split(train_data)):
        #Split the data into a training set and test set
        X_train = train_data.loc[train[0]:train[-1],predictors]
        X_test  = train_data.loc[test[0]:test[-1],predictors]
        y_train = merged_df.loc[train[0]:train[-1],target]
        y_test  = merged_df.loc[test[0]:test[-1],target]
        #Fit the model
        model.fit(X_train,y_train)
        #Record the accuracy
        current_accuracy.iloc[i,0] = root_mean_squared_error(y_test,model.predict(X_test))
    #Return the model accuracrcy
    return(current_accuracy.iloc[:,0].mean())
因此,与往常一样,我们首先要做的是进行线性搜索,以确定最优值可能所在的大致位置。我们从执行一次普通的线性搜索开始,这次线性搜索耗时41秒才完成。
#Let's optimize our model
#Let us measure how much time this takes.
start = time.time()

#Create a dataframe to measure the error rates
starting_point_error = pd.DataFrame(index=np.arange(0,21),columns=["Average CV RMSE"])
starting_point_error["Iteration"] = np.arange(0,21)

#Let us first find a good starting point for our optimization algorithm
for i in np.arange(0,21):
    #Set a new starting point
    new_starting_point = (10.0 ** -i)
    #Store error rates
    starting_point_error.iloc[i,0] = objective([new_starting_point  ,new_starting_point])

#Record the time stamp at the end
stop = time.time()

#Report the amount of time taken
print(f"Completed in {stop - start} seconds")
根据我们的线性搜索结果,似乎在第一次迭代时我们就已经越过了最优点。
starting_point_error["alpha"] = 0
starting_point_error["eta0"] = 0

for i in np.arange(0,21):
    starting_point_error.loc[i,"alpha"] = (10.0 ** -i)
    starting_point_error.loc[i,"eta0"] = (10.0 ** -i)

starting_point_error
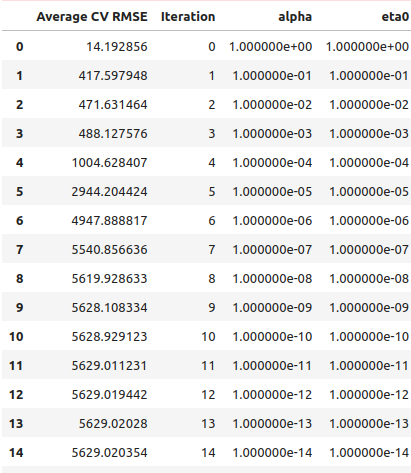
图9:我们的线性搜索结果
我们还可以将这些信息以可视化的方式绘制出来,如您所见,它几乎形成了一个倒立的曲棍球棍的形状,最低误差出现在最开始的位置,然后误差就一直持续增加。
#Let's visualize our error levels
sns.lineplot(data=starting_point_error,x="Iteration",y="Average CV RMSE").set(title="Optimizing our SGD Regressor on Training Data")
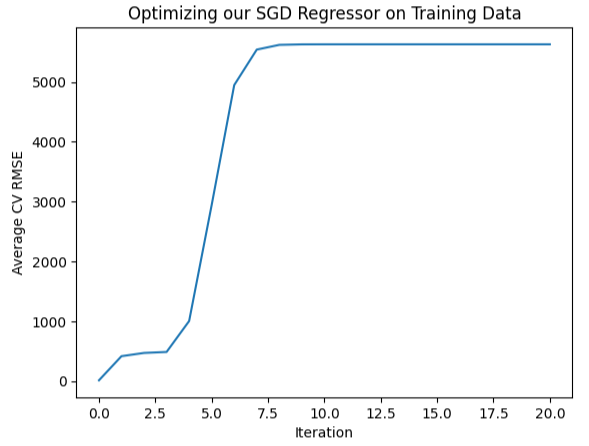
图10:可视化我们的误差水平
既然现在对看起来最优的结果有了初步了解,我们就可以在看起来最优的区域周围进行局部搜索。我们将使用L-BFGS-B算法来找到这些最优点。首先,我们会在看起来最优的区域中选择一些随机点。
#Now let us perform a local search in the space that appears optimal
pt = abs(((10 ** -2) + rand(2) * ((1) - (10 ** -2))))
pt
现在我们将尝试对模型进行优化,以更好地适应训练数据。
#Let's try optimize our model
start = time.time()
bounds = ((0.01,1),(0.01,1))
result = minimize(objective,pt,bounds=bounds,method="L-BFGS-B")
stop = time.time()
print(f"Task completed in {stop - start} seconds") 结果如何?
#What are the results?
result success: True
status: 0
fun: 11.428966326221078
x: [ 1.040e-01 3.193e-01]
nit: 24
jac: [ 9.160e+00 -1.475e+01]
nfev: 351
njev: 117
hess_inv: <2x2 LbfgsInvHessProduct with dtype=float64>
看起来我们取得了成功,我们获得的最低误差是11.43,然而,真正的考验在于我们将自定义模型与测试集上的默认模型进行比较时。
检测过拟合
为了检测我们是否对训练数据过拟合,让我们将自定义模型的误差水平与使用默认设置的模型的误差水平进行比较。回想一下,在开始参数调整过程之前,我们将数据集分为了两半:一半用于训练,另一半用于测试。#Now let us compare the default model and the customized model default_model = SGDRegressor() customized_model = SGDRegressor(alpha=result.x[0],shuffle=False,eta0=result.x[1])
首先,让我们评估默认模型在测试集上的误差水平。
#Default model accuracy
default_model.fit(train_data.loc[:,predictors],merged_df.loc[:(merged_df.shape[0]//2),target])
root_mean_squared_error(merged_df.loc[(merged_df.shape[0]//2):,target],default_model.predict(test_data.loc[:,predictors]))
现在,让我们将其与自定义模型的误差水平进行比较。
#Customized model accuracy
customized_model.fit(train_data.loc[:,predictors],merged_df.loc[:(merged_df.shape[0]//2),target])
root_mean_squared_error(merged_df.loc[(merged_df.shape[0]//2):,target],customized_model.predict(test_data.loc[:,predictors]))
显然,我们确实对训练数据过拟合了,并且未能超越默认设置的性能。在这种情况下,我们将继续使用默认模型,并将其导出为ONNX格式。
导出为ONNX格式
我们将从导入所需的库开始。
#Let's convert the regression model to ONNX format
from skl2onnx.common.data_types import FloatTensorType
from skl2onnx import convert_sklearn
import onnxruntime as ort
import onnx
然后我们将对输入进行归一化和缩放。
for i in predictors:
    merged_df.loc[:,i] = (merged_df.loc[:,i] - merged_df.loc[:,i].mean()) / merged_df.loc[:,i].std()
现在对整个数据集进行模型训练。
#Prepare the model
model = SGDRegressor()
model.fit(merged_df.loc[:,predictors],merged_df.loc[:,"Target SP500"])
现在我们将定义输入的形状和类型。
#Define the input types
initial_type_float = [("float_input",FloatTensorType([1,len(predictors)]))]
onnx_model_float = convert_sklearn(model,initial_types=initial_type_float,target_opset=12)
让我们保存ONNX模型。
#ONNX file name
onnx_file_name = "SP500_ONNX_FLOAT_M1.onnx"
#ONNX file
onnx.save_model(onnx_model_float,onnx_file_name)
现在让我们快速检查一下ONNX模型的输入和输出的形状。
# load the ONNX model and inspect input and ouput shapes
onnx_session = ort.InferenceSession(onnx_file_name)
input_name = onnx_session.get_inputs()[0].name
output_name = onnx_session.get_outputs()[0].name
让我们确保模型输入的形状是1×8。
#Display information about input tensors in ONNX
print("Information about input tensors in ONNX:")
for i, input_tensor in enumerate(onnx_session.get_inputs()):
    print(f"{i + 1}. Name: {input_tensor.name}, Data Type: {input_tensor.type}, Shape: {input_tensor.shape}")
1. 名称:float_input,数据类型:tensor(浮点型),形状:[1, 8]
最后,我们的输出形状应为1×1。
#Display information about output tensors in ONNX
print("Information about output tensors in ONNX:")
for i, output_tensor in enumerate(onnx_session.get_outputs()):
    print(f"{i + 1}. Name: {output_tensor.name}, Data Type: {output_tensor.type}, Shape: {output_tensor.shape}")
1. 名称:variable,数据类型:tensor(浮点型),形状:[1, 1]
我们还可以使用Netron可视化ONNX模型。
#Visualize the model
import netron
Netron中的启动函数允许我们可视化ONNX模型。
#Call netron
netron.start(onnx_file_name) 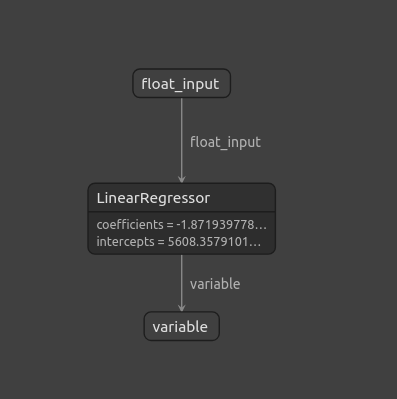
图11:使用Netron可视化我们的ONNX模型
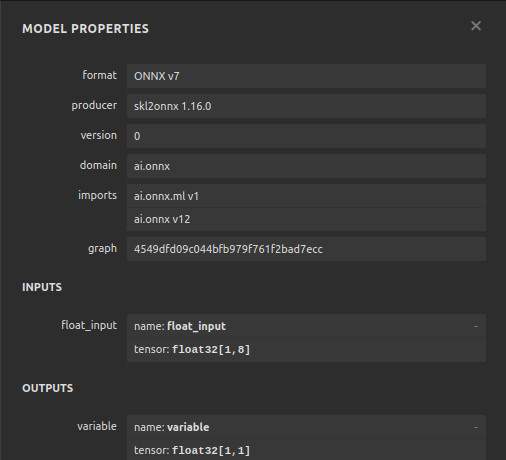
图 12:我们的ONNX模型的属性
在MQL5中的实现
现在我们已经完成了ONNX模型的构建并将其导出,接下来可以开始构建我们的EA。在我们的EA中,首先要做的是加载我们刚刚导出的ONNX模型。
//+------------------------------------------------------------------+
//|                                      SP500 X Treasury Yields.mq5 |
//|                                        Gamuchirai Zororo Ndawana |
//|                          https://www.mql5.com/en/gamuchiraindawa |
//+------------------------------------------------------------------+
#property copyright "Gamuchirai Zororo Ndawana"
#property link      "https://www.mql5.com/en/gamuchiraindawa"
#property version   "1.00"
#property tester_file "sp500_treasury_yields_scale.csv"

//+------------------------------------------------------------------+
//| Require the ONNX model                                           |
//+------------------------------------------------------------------+
#resource "\\Files\\SP500_ONNX_FLOAT_M1.onnx" as const uchar ModelBuffer[];
我们还将包含交易库,这个库帮助我们开启、关闭和修改头寸。
//+------------------------------------------------------------------+
//| Libraries we need                                                |
//+------------------------------------------------------------------+
#include <Trade/Trade.mqh>
CTrade Trade;
此外,还需要从终端用户处获取一些输入,例如,手数倍数应该有多大,以及止损应该设置多宽?
//+------------------------------------------------------------------+
//| Inputs for our EA                                                |
//+------------------------------------------------------------------+
input int lot_multiple = 1; //How many times bigger than minimum lot?
input double sl_width = 1;  //How wide should our stop loss be?
我们需要在整个EA中使用的全局变量。我们需要一个全局变量来表示ONNX模型,另一个向量用于存储我们模型的预测结果。
//+------------------------------------------------------------------+
//| Global variables                                                 |
//+------------------------------------------------------------------+
long model;                              //Our ONNX SGDRegressor model
vectorf prediction(1);                   //Our model's prediction
float mean_values[8],variance_values[8]; //We need this data to normalise and scale model inputs
double trading_volume;                   //How big should our positions be?
int state = 0;
接下来,我们还需要一个负责读取我们之前定义的CSV配置文件的函数。请记住,这个文件很重要,因为它包含了每一列的均值和标准差值。该函数确保我们提供给ONNX模型的所有输入都经过了归一化处理。该函数将首先尝试使用文件打开命令来打开文件。如果我们成功地打开了文件,那么我们将继续解析CSV文件,并将均值和方差值分别存储在它们各自的数组中。否则,如果我们未能成功打开文件,那么该函数将打印出它未能读取文件的消息,并返回false,这将导致初始化过程失败。
//+------------------------------------------------------------------+
//| A function responsible for reading the CSV config file           |
//+------------------------------------------------------------------+
bool read_configuration_file(void)
  {
//--- Read the config file
   Print("Reading in the config file");

//--- Config file name
   string file_name = "sp500_treasury_yields_scale.csv";

//--- Try open the file
   int result = FileOpen(file_name,FILE_READ|FILE_CSV|FILE_ANSI,",");

//--- Check the result
   if(result != INVALID_HANDLE)
     {
      Print("Opened the file");
      //--- Prepare to read the file
      int counter = 0;
      string value = "";
      //--- Make sure we can proceed
      while(!FileIsEnding(result) && !IsStopped())
        {
         if(counter > 60)
            break;
         //--- Read in the file
         value = FileReadString(result);
         Print("Reading: ",value);
         //--- Have we reached the end of the line?
         if(FileIsLineEnding(result))
            Print("row++");
         counter++;
         //--- The first few lines will contain the title of each columns, we will ingore that
         if((counter >= 11) && (counter <= 18))
           {
            mean_values[counter - 11] = (float) value;
           }
         if((counter >= 20) && (counter <= 27))
           {
            variance_values[counter - 20] = (float) value;
           }
        }
      //--- Close the file
      FileClose(result);
      Print("Mean values");
      ArrayPrint(mean_values);
      Print("Variance values");
      ArrayPrint(variance_values);
      return(true);
     }

   else
      if(result == INVALID_HANDLE)
        {
         Print("Failed to read the file");
         return(false);
        }

   return(false);
  }
我们还需要一个负责从我们的模型获取预测的函数。一开始我们用一个向量来存储输入数据。一旦我们获取了所有需要的价格,我们就减去该列的均值,然后除以该特定列的方差。完成这些操作后,我们就可以从模型中获得一个预测。
//+------------------------------------------------------------------+
//| A function responsible for getting a forecast from our model     |
//+------------------------------------------------------------------+
void predict(void)
  {
//--- Let's prepare our inputs
   vectorf input_data = vectorf::Zeros(8);
//--- Select the symbol
   input_data[0] = ((iOpen("UST05Y_U4",PERIOD_M1,0) - mean_values[0]) / variance_values[0]);
   input_data[1] = ((iClose("UST05Y_U4",PERIOD_M1,0) - mean_values[1]) / variance_values[1]);
   input_data[2] = ((iHigh("UST05Y_U4",PERIOD_M1,0) - mean_values[2]) / variance_values[2]);
   input_data[3] = ((iLow("UST05Y_U4",PERIOD_M1,0) - mean_values[3]) / variance_values[3]);;
   input_data[4] = ((iOpen("US500",PERIOD_M1,0) - mean_values[4]) / variance_values[4]);;
   input_data[5] = ((iClose("US500",PERIOD_M1,0) - mean_values[5]) / variance_values[5]);;
   input_data[6] = ((iHigh("US500",PERIOD_M1,0) - mean_values[6]) / variance_values[6]);
   input_data[7] = ((iLow("US500",PERIOD_M1,0) - mean_values[7]) / variance_values[7]);;
//--- Show the inputs
   Print("Inputs: ",input_data);
//--- Obtain a prediction from our model
   OnnxRun(model,ONNX_DEFAULT,input_data,prediction);
  }
在我们的模型给出预测后,我们需要采取行动。因此,在这种特定情况下,我们可以决定根据模型的预测方向开设头寸。或者,如果我们的模型预测价格将转向至对我们不利的趋势,我们可能会决定平仓。
//+------------------------------------------------------------------+
//| This function will decide if we should open or close our trades  |
//+------------------------------------------------------------------+
void intepret_prediction(void)
  {
   if(PositionsTotal() == 0)
     {
      double ask = SymbolInfoDouble("US500",SYMBOL_ASK);
      double bid = SymbolInfoDouble("US500",SYMBOL_BID);
      double close = iClose("US500",PERIOD_M1,0);
      if(prediction[0] > close)
        {
         Trade.Buy(trading_volume,"US500",ask,(ask - sl_width),(ask + sl_width),"SP500 X Treasury Yields");
         state = 1;
        }

      if(prediction[0] < iClose("US500",PERIOD_M1,0))
        {
         Trade.Sell(trading_volume,"US500",bid,(bid + sl_width),(bid - sl_width),"SP500 X Treasury Yields");
         state = 2;
        }
     }
   else
      if(PositionsTotal() > 0)
        {
         if((state == 1) && (prediction[0] > iClose("US500",PERIOD_M1,0)))
           {
            Alert("Reversal predicted, consider closing your buy position");
           }

         if((state == 2) && (prediction[0] < iClose("US500",PERIOD_M1,0)))
           {
            Alert("Reversal predicted, consider closing your buy position");
           }
        }

  }
我们已经完成了为模型定义辅助函数的工作,并继续定义我们的EA的初始化函数。首先,我们需要创建ONNX模型,然后确保该模型是有效的。
//+------------------------------------------------------------------+
//| Expert initialization function                                   |
//+------------------------------------------------------------------+
int OnInit()
  {

//--- Create the ONNX model from the model buffer we have
   model = OnnxCreateFromBuffer(ModelBuffer,ONNX_DEFAULT);

//--- Ensure the model is valid
   if(model == INVALID_HANDLE)
     {
      Comment("[ERROR] Failed to initialize the model: ",GetLastError());
      return(INIT_FAILED);
     }
一旦我们确信模型是有效的,我们定义模型的输入形状,然后定义模型的输出形状。
//--- Define the model parameters, input and output shapes
   ulong input_shape[] = {1,8};

//--- Check if we were defined the right input shape
   if(!OnnxSetInputShape(model,0,input_shape))
     {
      Comment("[ERROR] Incorrect input shape specified: ",GetLastError(),"\nThe model's inputs are: ",OnnxGetInputCount(model));
      return(INIT_FAILED);
     }

   ulong output_shape[] = {1,1};

//--- Check if we were defined the right output shape
   if(!OnnxSetOutputShape(model,0,output_shape))
     {
      Comment("[ERROR] Incorrect output shape specified: ",GetLastError(),"\nThe model's outputs are: ",OnnxGetOutputCount(model));
      return(INIT_FAILED);
     }
完成所有这些步骤后,我们就可以读取配置文件了,这必须在初始化时完成,如果我们无法读取配置文件,整个EA应该终止,因为我们无法在未归一化的数据上进行预测。
//--- Read the configuration file
   if(!read_configuration_file())
     {
      Comment("Failed to find the configuration file, ensure it is stored here: ",TerminalInfoString(TERMINAL_DATA_PATH));
      return(INIT_FAILED);
     }
现在我们需要选择交易品种并将它们添加到市场观察窗口中。
//--- Select the symbols
   SymbolSelect("US500",true);
   SymbolSelect("UST05Y_U4",true);
最后,我们需要获取一些市场数据。
//--- Calculate the lotsize
   trading_volume = SymbolInfoDouble(Symbol(),SYMBOL_VOLUME_MIN) * lot_multiple;

//--- Return init succeeded
   return(INIT_SUCCEEDED);
  }
每当我们的EA不使用时,我们必须释放分配的资源。
//+------------------------------------------------------------------+
//| Expert deinitialization function                                 |
//+------------------------------------------------------------------+
void OnDeinit(const int reason)
  {
//--- Free up the resources we used for our ONNX model
   OnnxRelease(model);
//--- Remove the expert advisor
   ExpertRemove();
  }
最后,在我们的OnTick事件处理程序中,我们将使用ONNX模型进行预测,然后将这些预测映射为具体的交易操作。
//+------------------------------------------------------------------+
//| Expert tick function                                             |
//+------------------------------------------------------------------+
void OnTick()
  {
//--- Get a prediction
   predict();
//--- Interpret the forecast
   intepret_prediction();
   Comment("Model forecast",prediction[0]);
  }
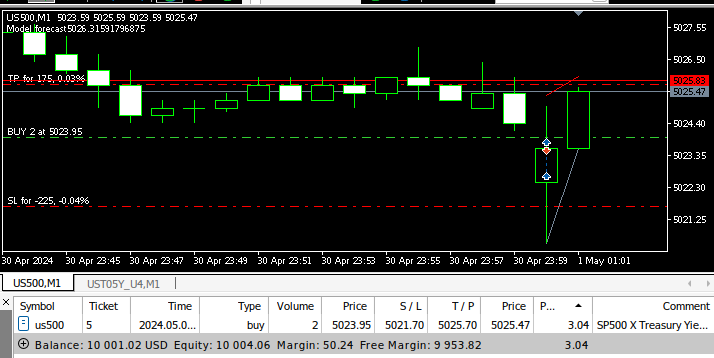
图13:我们运行中的EA
结论
在本文中,我们重新审视了一种依赖国债收益率的经典标普500指数交易策略。我们的分析表明,这种关系并不总是稳定的,而且似乎投资者使用标普500指数本身提供的普通市场数据会更好。
本文由MetaQuotes Ltd译自英文
原文地址: https://www.mql5.com/en/articles/15531
注意: MetaQuotes Ltd.将保留所有关于这些材料的权利。全部或部分复制或者转载这些材料将被禁止。
本文由网站的一位用户撰写,反映了他们的个人观点。MetaQuotes Ltd 不对所提供信息的准确性负责,也不对因使用所述解决方案、策略或建议而产生的任何后果负责。
 重构经典策略(第五部分):基于USDZAR的多品种分析
 交易中的神经网络:时空神经网络(STNN)
 创建 MQL5-Telegram 集成 EA 交易 (第二部分):从 MQL5 发送信号到 Telegram
 创建 MQL5-Telegram 集成 EA 交易 (第一部分):从 MQL5 发送消息到 Telegram
最后一张(最低的)截图,它与文章和提到的策略有关系吗?
M1 时间框架和几个点的目标 :-)