构建K线图的趋势约束模型(第四部分):为各个趋势波段自定义显示样式
内容
- 引言
- 回顾
- MQL5显示样式
- 将 DRAW_LINE 样式应用到我们的系统中
- 我的D1 K线状态
- 了解 My_D1_Candlestatus.mq5 的函数和变量
- MQL5绘图样式的其他替代方案
- 结论
引言
自定义绘图样式可以增强图表的视觉吸引力,使其更具吸引力和易读性。一个设计良好的图表可以改善用户体验,并在长时间的交易过程中减少眼睛疲劳。 通过根据特定需求定制绘图样式,交易者可以创建更高效和有效的交易设置。例如,使用直方图表示交易量数据或用线条表示移动平均线可以更容易地一眼解读这些指标。像箭头或符号这样的绘图样式可以用来在图表上标记特定事件或信号,如买卖点,从而更容易发现交易机会。
MQL5为MetaTrader 5上的指标提供了多种绘图样式。这些视觉元素在MetaTrader 5图表上展示时,为交易者提供了分析优势,有助于快速适应市场情绪。融入这些多样化的绘图样式不仅增强了图表的审美吸引力,还使交易者能够基于对市场动态的全面分析做出明智决策。交易者可以更有效地解读价格变动,识别趋势,并以更高的精确度预测潜在的反转。MQL5拥有丰富的18种图形绘制类型。在本文中,我们想要更深入地探讨如何将其中一种显示样式融入我们的模型。
我们不仅要在我们的警报中绘制一个箭头,我们还想在图表上创建一个更高级的视觉元素,使其更加易于理解。请记住,在这个系列中,我们的目标是完善我们的趋势约束模型,使其既符合我们日线K线图形状的情绪,又在图表上呈现全面的视觉信号。MQL5绘图样式可以在颜色、粗细和样式(例如,虚线或实线)方面进行自定义,帮助交易者根据自己的偏好个性化他们的图表,并提高可读性。不同的绘图样式允许交易者更清晰和精确地表示数据。例如,使用线条、直方图或蜡烛图可以更容易地解读价格变动和市场趋势。
MQL5中提供的各种绘图样式为交易者带来了许多优势。它们有助于提高数据可视化的清晰度、精确度和自定义程度。这些多样化的样式扩展了技术分析的能力,使得能够利用先进的图表技术并实现动态实时更新。此外,MQL5绘图样式中固有的适应性和独创性使交易者能够创建独特的指标和分析工具,从而放大他们的交易策略和对市场格局的理解。为了全面理解这个主题,请深入研究MQL5参考手册,以深入探索绘图样式。
回顾
在本系列文章的前几篇(第一部分、第二部分、和第三部分)中,我们的目标是将每个信号限定在D1蜡烛图所体现的市场情绪内。这里的理念是,如果日K线图呈现看涨态势,那么通常在较低的时间框架内,当天的整体趋势将呈现上升趋势。通过在较低时间框架内运用先进的分析方法,我们可以确定入场点并生成与当前趋势相符的信号。在每个阶段,我们都对源代码进行了增强,添加了新功能并优化了模型。在本系列文章中,我们使用了箭头作为指标每次迭代的设计元素,并探索了使用Wingdings字体作为可选显示元素的可能性。
我们在MQL5图表上为某交易对象添加了周期为200和100的均线以制定策略。通过分析这些内置指标的行为,我们确定了一个重要的周期性交叉事件。随后,我们创建了一个带有警报系统的个性化交叉指标,以通知我们此类事件的发生,表明可能出现了趋势反转。将均线值调整到更高的水平有助于在市场波动期间过滤掉信号。在第三部分中,我通过引入可自定义的均线周期输入来进一步完善了该方法,以探索不同的周期值并确定趋势反转的最佳设置。
input int Slow_MA_period = 200;
input int Fast_MA_period = 100;
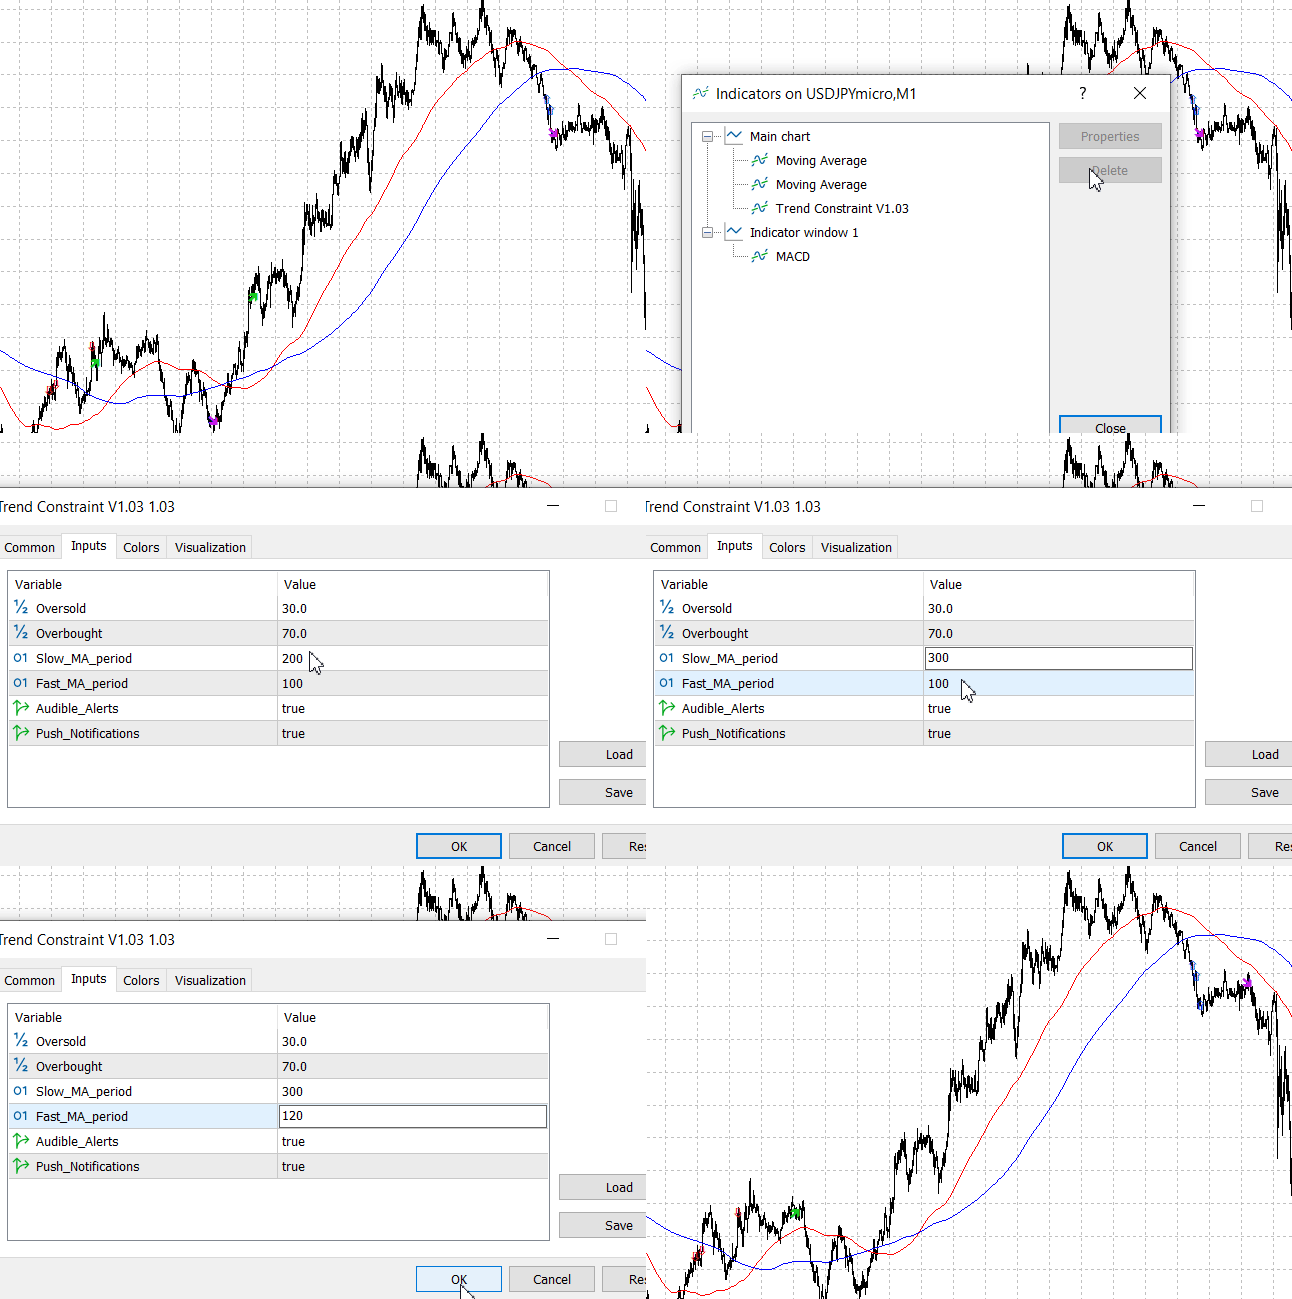
该软件提供了即时调整视觉表示中显示的输入配置的功能。要修改其属性,请在查看MetaTrader 5图表时使用快捷键Ctrl + I,或者只需右键单击鼠标以显示指标菜单,并找到 Trend Constraint V1.03。
涂1:优化均线周期以获取最佳趋势反转设置
在使用这些输入配置编译程序后,您将在本文结尾处下方找到所附的源文件。下面是Trend Constraint V1.03的最新版本代码:
/// Program after adding Moving Average optimization feature for reversals
///Indicator Name: Trend Constraint
#property copyright "Clemence Benjamin"
#property link      "https://mql5.com"
#property version   "1.03"
#property description "A model that seek to produce sell signal when D1 candle is Bearish only and  buy signal when it is Bullish"


//--- indicator settings
#property indicator_chart_window
#property indicator_buffers 4
#property indicator_plots 4

#property indicator_type1 DRAW_ARROW
#property indicator_width1 5
#property indicator_color1 0xFF3C00
#property indicator_label1 "Buy"

#property indicator_type2 DRAW_ARROW
#property indicator_width2 5
#property indicator_color2 0x0000FF
#property indicator_label2 "Sell"

#property indicator_type3 DRAW_ARROW
#property indicator_width3 1
#property indicator_color3 0x04CC04
#property indicator_label3 "Buy Reversal"

#property indicator_type4 DRAW_ARROW
#property indicator_width4 1
#property indicator_color4 0xE81AC6
#property indicator_label4 "Sell Reversal"

#define PLOT_MAXIMUM_BARS_BACK 5000
#define OMIT_OLDEST_BARS 50

//--- indicator buffers
double Buffer1[];
double Buffer2[];
double Buffer3[];
double Buffer4[];

input double Oversold = 30;
input double Overbought = 70;
input int Slow_MA_period = 200;
input int Fast_MA_period = 100;
datetime time_alert; //used when sending alert
input bool Audible_Alerts = true;
input bool Push_Notifications = true;
double myPoint; //initialized in OnInit
int RSI_handle;
double RSI[];
double Open[];
double Close[];
int MA_handle;
double MA[];
int MA_handle2;
double MA2[];
int MA_handle3;
double MA3[];
int MA_handle4;
double MA4[];
double Low[];
double High[];

void myAlert(string type, string message)
  {
   if(type == "print")
      Print(message);
   else if(type == "error")
     {
      Print(type+" | Trend Constraint V1.03 @ "+Symbol()+","+IntegerToString(Period())+" | "+message);
     }
   else if(type == "order")
     {
     }
   else if(type == "modify")
     {
     }
   else if(type == "indicator")
     {
      if(Audible_Alerts) Alert(type+" | Trend Constraint V1.03 @ "+Symbol()+","+IntegerToString(Period())+" | "+message);
      if(Push_Notifications) SendNotification(type+" | Trend Constraint V1.03 @ "+Symbol()+","+IntegerToString(Period())+" | "+message);
     }
  }

//+------------------------------------------------------------------+
//| Custom indicator initialization function                         |
//+------------------------------------------------------------------+
int OnInit()
  {
   SetIndexBuffer(0, Buffer1);
   PlotIndexSetDouble(0, PLOT_EMPTY_VALUE, EMPTY_VALUE);
   PlotIndexSetInteger(0, PLOT_DRAW_BEGIN, MathMax(Bars(Symbol(), PERIOD_CURRENT)-PLOT_MAXIMUM_BARS_BACK+1, OMIT_OLDEST_BARS+1));
   PlotIndexSetInteger(0, PLOT_ARROW, 241);
   SetIndexBuffer(1, Buffer2);
   PlotIndexSetDouble(1, PLOT_EMPTY_VALUE, EMPTY_VALUE);
   PlotIndexSetInteger(1, PLOT_DRAW_BEGIN, MathMax(Bars(Symbol(), PERIOD_CURRENT)-PLOT_MAXIMUM_BARS_BACK+1, OMIT_OLDEST_BARS+1));
   PlotIndexSetInteger(1, PLOT_ARROW, 242);
   SetIndexBuffer(2, Buffer3);
   PlotIndexSetDouble(2, PLOT_EMPTY_VALUE, EMPTY_VALUE);
   PlotIndexSetInteger(2, PLOT_DRAW_BEGIN, MathMax(Bars(Symbol(), PERIOD_CURRENT)-PLOT_MAXIMUM_BARS_BACK+1, OMIT_OLDEST_BARS+1));
   PlotIndexSetInteger(2, PLOT_ARROW, 236);
   SetIndexBuffer(3, Buffer4);
   PlotIndexSetDouble(3, PLOT_EMPTY_VALUE, EMPTY_VALUE);
   PlotIndexSetInteger(3, PLOT_DRAW_BEGIN, MathMax(Bars(Symbol(), PERIOD_CURRENT)-PLOT_MAXIMUM_BARS_BACK+1, OMIT_OLDEST_BARS+1));
   PlotIndexSetInteger(3, PLOT_ARROW, 238);
   //initialize myPoint
   myPoint = Point();
   if(Digits() == 5 || Digits() == 3)
     {
      myPoint *= 10;
     }
   RSI_handle = iRSI(NULL, PERIOD_CURRENT, 14, PRICE_CLOSE);
   if(RSI_handle < 0)
     {
      Print("The creation of iRSI has failed: RSI_handle=", INVALID_HANDLE);
      Print("Runtime error = ", GetLastError());
      return(INIT_FAILED);
     }

   MA_handle = iMA(NULL, PERIOD_CURRENT, 7, 0, MODE_SMMA, PRICE_CLOSE);
   if(MA_handle < 0)
     {
      Print("The creation of iMA has failed: MA_handle=", INVALID_HANDLE);
      Print("Runtime error = ", GetLastError());
      return(INIT_FAILED);
     }

   MA_handle2 = iMA(NULL, PERIOD_CURRENT, 400, 0, MODE_SMA, PRICE_CLOSE);
   if(MA_handle2 < 0)
     {
      Print("The creation of iMA has failed: MA_handle2=", INVALID_HANDLE);
      Print("Runtime error = ", GetLastError());
      return(INIT_FAILED);
     }

   MA_handle3 = iMA(NULL, PERIOD_CURRENT, Fast_MA_period, 0, MODE_EMA, PRICE_CLOSE);
   if(MA_handle3 < 0)
     {
      Print("The creation of iMA has failed: MA_handle3=", INVALID_HANDLE);
      Print("Runtime error = ", GetLastError());
      return(INIT_FAILED);
     }

   MA_handle4 = iMA(NULL, PERIOD_CURRENT, Slow_MA_period, 0, MODE_SMA, PRICE_CLOSE);
   if(MA_handle4 < 0)
     {
      Print("The creation of iMA has failed: MA_handle4=", INVALID_HANDLE);
      Print("Runtime error = ", GetLastError());
      return(INIT_FAILED);
     }

   return(INIT_SUCCEEDED);
  }

//+------------------------------------------------------------------+
//| Custom indicator iteration function                              |
//+------------------------------------------------------------------+
int OnCalculate(const int rates_total,
                const int prev_calculated,
                const datetime& time[],
                const double& open[],
                const double& high[],
                const double& low[],
                const double& close[],
                const long& tick_volume[],
                const long& volume[],
                const int& spread[])
  {
   int limit = rates_total - prev_calculated;
   //--- counting from 0 to rates_total
   ArraySetAsSeries(Buffer1, true);
   ArraySetAsSeries(Buffer2, true);
   ArraySetAsSeries(Buffer3, true);
   ArraySetAsSeries(Buffer4, true);
   //--- initial zero
   if(prev_calculated < 1)
     {
      ArrayInitialize(Buffer1, EMPTY_VALUE);
      ArrayInitialize(Buffer2, EMPTY_VALUE);
      ArrayInitialize(Buffer3, EMPTY_VALUE);
      ArrayInitialize(Buffer4, EMPTY_VALUE);
     }
   else
      limit++;
   datetime Time[];

   datetime TimeShift[];
   if(CopyTime(Symbol(), PERIOD_CURRENT, 0, rates_total, TimeShift) <= 0) return(rates_total);
   ArraySetAsSeries(TimeShift, true);
   int barshift_M1[];
   ArrayResize(barshift_M1, rates_total);
   int barshift_D1[];
   ArrayResize(barshift_D1, rates_total);
   for(int i = 0; i < rates_total; i++)
     {
      barshift_M1[i] = iBarShift(Symbol(), PERIOD_M1, TimeShift[i]);
      barshift_D1[i] = iBarShift(Symbol(), PERIOD_D1, TimeShift[i]);
   }
   if(BarsCalculated(RSI_handle) <= 0)
      return(0);
   if(CopyBuffer(RSI_handle, 0, 0, rates_total, RSI) <= 0) return(rates_total);
   ArraySetAsSeries(RSI, true);
   if(CopyOpen(Symbol(), PERIOD_M1, 0, rates_total, Open) <= 0) return(rates_total);
   ArraySetAsSeries(Open, true);
   if(CopyClose(Symbol(), PERIOD_D1, 0, rates_total, Close) <= 0) return(rates_total);
   ArraySetAsSeries(Close, true);
   if(BarsCalculated(MA_handle) <= 0)
      return(0);
   if(CopyBuffer(MA_handle, 0, 0, rates_total, MA) <= 0) return(rates_total);
   ArraySetAsSeries(MA, true);
   if(BarsCalculated(MA_handle2) <= 0)
      return(0);
   if(CopyBuffer(MA_handle2, 0, 0, rates_total, MA2) <= 0) return(rates_total);
   ArraySetAsSeries(MA2, true);
   if(BarsCalculated(MA_handle3) <= 0)
      return(0);
   if(CopyBuffer(MA_handle3, 0, 0, rates_total, MA3) <= 0) return(rates_total);
   ArraySetAsSeries(MA3, true);
   if(BarsCalculated(MA_handle4) <= 0)
      return(0);
   if(CopyBuffer(MA_handle4, 0, 0, rates_total, MA4) <= 0) return(rates_total);
   ArraySetAsSeries(MA4, true);
   if(CopyLow(Symbol(), PERIOD_CURRENT, 0, rates_total, Low) <= 0) return(rates_total);
   ArraySetAsSeries(Low, true);
   if(CopyHigh(Symbol(), PERIOD_CURRENT, 0, rates_total, High) <= 0) return(rates_total);
   ArraySetAsSeries(High, true);
   if(CopyTime(Symbol(), Period(), 0, rates_total, Time) <= 0) return(rates_total);
   ArraySetAsSeries(Time, true);
   //--- main loop
   for(int i = limit-1; i >= 0; i--)
     {
      if (i >= MathMin(PLOT_MAXIMUM_BARS_BACK-1, rates_total-1-OMIT_OLDEST_BARS)) continue; //omit some old rates to prevent "Array out of range" or slow calculation

      if(barshift_M1[i] < 0 || barshift_M1[i] >= rates_total) continue;
      if(barshift_D1[i] < 0 || barshift_D1[i] >= rates_total) continue;

      //Indicator Buffer 1
      if(RSI[i] < Oversold
      && RSI[i+1] > Oversold //Relative Strength Index crosses below fixed value
      && Open[barshift_M1[i]] >= Close[1+barshift_D1[i]] //Candlestick Open >= Candlestick Close
      && MA[i] > MA2[i] //Moving Average > Moving Average
      && MA3[i] > MA4[i] //Moving Average > Moving Average
      )
        {
         Buffer1[i] = Low[1+i]; //Set indicator value at Candlestick Low
         if(i == 1 && Time[1] != time_alert) myAlert("indicator", "Buy"); //Alert on next bar open
         time_alert = Time[1];
        }
      else
        {
         Buffer1[i] = EMPTY_VALUE;
        }
      //Indicator Buffer 2
      if(RSI[i] > Overbought
      && RSI[i+1] < Overbought //Relative Strength Index crosses above fixed value
      && Open[barshift_M1[i]] <= Close[1+barshift_D1[i]] //Candlestick Open <= Candlestick Close
      && MA[i] < MA2[i] //Moving Average < Moving Average
      && MA3[i] < MA4[i] //Moving Average < Moving Average
      )
        {
         Buffer2[i] = High[1+i]; //Set indicator value at Candlestick High
         if(i == 1 && Time[1] != time_alert) myAlert("indicator", "Sell"); //Alert on next bar open
         time_alert = Time[1];
        }
      else
        {
         Buffer2[i] = EMPTY_VALUE;
        }
      //Indicator Buffer 3
      if(MA3[i] > MA4[i]
      && MA3[i+1] < MA4[i+1] //Moving Average crosses above Moving Average
      )
        {
         Buffer3[i] = Low[i]; //Set indicator value at Candlestick Low
         if(i == 1 && Time[1] != time_alert) myAlert("indicator", "Buy Reversal"); //Alert on next bar open
         time_alert = Time[1];
        }
      else
        {
         Buffer3[i] = EMPTY_VALUE;
        }
      //Indicator Buffer 4
      if(MA3[i] < MA4[i]
      && MA3[i+1] > MA4[i+1] //Moving Average crosses below Moving Average
      )
        {
         Buffer4[i] = High[i]; //Set indicator value at Candlestick High
         if(i == 1 && Time[1] != time_alert) myAlert("indicator", "Sell Reversal"); //Alert on next bar open
         time_alert = Time[1];
        }
      else
        {
         Buffer4[i] = EMPTY_VALUE;
        }
     }
   return(rates_total);
  }
//Thank you, friend. 你已经达到了这个阶段,你还可以做得更多+
MQL5显示样式
MQL5为指标提供了多种绘图样式。在开发指标时,主要目标通常是设计能够通过声音和视觉提示来通知用户的系统。这有助于简化交易操作,减少交易者需要不断观察图表的需求,因为计算机会承担这一责任。让我为您简要概述一些可以在MQL5中使用的绘图样式,如DRAW_ARROW(绘制箭头)、DRAW_LINE(绘制线条)、DRAW_HISTOGRAM(绘制直方图)、DRAW_FILLING(绘制填充图形)和DRAW_NONE(不绘制)。请参考下面提供的表格,提供了简洁的说明。有关绘图样式的详细信息,请查阅MQL5参考手册。
| DRAW STYLE | DESCPRITION |
|---|---|
| DRAW_ARROW | 在特定位置画箭头。通常用于突出显示买入/卖出信号或其他重要事件。 |
| DRAW_LINE | 用于连接数据点绘制线条。非常适合用于绘制移动平均线、趋势线和其他基于线条的指标。 |
| DRAW_HISTOGRAM | 以条形图或直方图的形式展示数据。适用于成交量、MACD直方图和其他条形图类指标。 |
| DRAW_FILLING | 用于填充图表上两条线之间的区域,以提供一种视觉上直观的方式来表示数据范围、分布或两个指标之间的差异。 |
| DRAW_NONE | 用于定义一个不在图表上绘制任何视觉表示的指标。 |
将 DRAW_LINE 样式应用到我们的系统中。
让我们利用DRAW_LINE函数在MetaTrader 5图表上以独特的方式展示趋势。过去,我们成功地设置了指标,通过较高周期移动平均线的交叉来有效识别趋势反转。我们现在的目标是改进信息的视觉呈现方式,避免图表上元素过多而造成拥挤。这个新增的功能将使我们能够绘制一条单独的线条来展示趋势,并且随着每个新方向的出现自动改变其颜色。在我们当前的4个缓冲区的基础上,我们计划通过引入缓冲区5和缓冲区6来增强1.04版本的功能。
- 缓冲区5:当100周期移动平均线(MA 100)位于200周期移动平均线(MA 200)之上时,绘制一条蓝色线条。
///properties
#property indicator_type5 DRAW_LINE
#property indicator_style5 STYLE_SOLID
#property indicator_width5 2
#property indicator_color5 0xFFAA00
#property indicator_label5 "Buy Trend"
- 缓冲区6:当100周期移动平均线(MA 100)位于200周期移动平均线(MA 200)之下时,绘制一条红色线条。
#property indicator_type6 DRAW_LINE
#property indicator_style6 STYLE_SOLID
#property indicator_width6 2
#property indicator_color6 0x0000FF
#property indicator_label6 "Sell Trend"
Trend Constraint v1.04的主代码
///Indicator Name: Trend Constraint
#property copyright "Clemence Benjamin"
#property link      "https://mql5.com"
#property version   "1.04"
#property description "A model that seek to produce sell signal when D1 candle is Bearish only and  buy signal when it is Bullish"
//--- indicator settings
#property indicator_chart_window
#property indicator_buffers 6
#property indicator_plots 6

#property indicator_type1 DRAW_ARROW
#property indicator_width1 5
#property indicator_color1 0xFF3C00
#property indicator_label1 "Buy"

#property indicator_type2 DRAW_ARROW
#property indicator_width2 5
#property indicator_color2 0x0000FF
#property indicator_label2 "Sell"

#property indicator_type3 DRAW_ARROW
#property indicator_width3 2
#property indicator_color3 0xE8351A
#property indicator_label3 "Buy Reversal"

#property indicator_type4 DRAW_ARROW
#property indicator_width4 2
#property indicator_color4 0x1A1AE8
#property indicator_label4 "Sell Reversal"

#property indicator_type5 DRAW_LINE
#property indicator_style5 STYLE_SOLID
#property indicator_width5 2
#property indicator_color5 0xFFAA00
#property indicator_label5 "Buy Trend"

#property indicator_type6 DRAW_LINE
#property indicator_style6 STYLE_SOLID
#property indicator_width6 2
#property indicator_color6 0x0000FF
#property indicator_label6 "Sell Trend"

#define PLOT_MAXIMUM_BARS_BACK 5000
#define OMIT_OLDEST_BARS 50

//--- indicator buffers
double Buffer1[];
double Buffer2[];
double Buffer3[];
double Buffer4[];
double Buffer5[];
double Buffer6[];

input double Oversold = 30;
input double Overbought = 70;
input int Slow_MA_period = 200;
input int Fast_MA_period = 100;
datetime time_alert; //used when sending alert
input bool Audible_Alerts = true;
input bool Push_Notifications = true;
double myPoint; //initialized in OnInit
int RSI_handle;
double RSI[];
double Open[];
double Close[];
int MA_handle;
double MA[];
int MA_handle2;
double MA2[];
int MA_handle3;
double MA3[];
int MA_handle4;
double MA4[];
double Low[];
double High[];
int MA_handle5;
double MA5[];
int MA_handle6;
double MA6[];

void myAlert(string type, string message)
  {
   if(type == "print")
      Print(message);
   else if(type == "error")
     {
      Print(type+" | Trend Constraint V1.04 @ "+Symbol()+","+IntegerToString(Period())+" | "+message);
     }
   else if(type == "order")
     {
     }
   else if(type == "modify")
     {
     }
   else if(type == "indicator")
     {
      if(Audible_Alerts) Alert(type+" | Trend Constraint V1.04 @ "+Symbol()+","+IntegerToString(Period())+" | "+message);
      if(Push_Notifications) SendNotification(type+" | Trend Constraint V1.04 @ "+Symbol()+","+IntegerToString(Period())+" | "+message);
     }
  }

//+------------------------------------------------------------------+
//| Custom indicator initialization function                         |
//+------------------------------------------------------------------+
int OnInit()
  {
   SetIndexBuffer(0, Buffer1);
   PlotIndexSetDouble(0, PLOT_EMPTY_VALUE, EMPTY_VALUE);
   PlotIndexSetInteger(0, PLOT_DRAW_BEGIN, MathMax(Bars(Symbol(), PERIOD_CURRENT)-PLOT_MAXIMUM_BARS_BACK+1, OMIT_OLDEST_BARS+1));
   PlotIndexSetInteger(0, PLOT_ARROW, 241);
   SetIndexBuffer(1, Buffer2);
   PlotIndexSetDouble(1, PLOT_EMPTY_VALUE, EMPTY_VALUE);
   PlotIndexSetInteger(1, PLOT_DRAW_BEGIN, MathMax(Bars(Symbol(), PERIOD_CURRENT)-PLOT_MAXIMUM_BARS_BACK+1, OMIT_OLDEST_BARS+1));
   PlotIndexSetInteger(1, PLOT_ARROW, 242);
   SetIndexBuffer(2, Buffer3);
   PlotIndexSetDouble(2, PLOT_EMPTY_VALUE, EMPTY_VALUE);
   PlotIndexSetInteger(2, PLOT_DRAW_BEGIN, MathMax(Bars(Symbol(), PERIOD_CURRENT)-PLOT_MAXIMUM_BARS_BACK+1, OMIT_OLDEST_BARS+1));
   PlotIndexSetInteger(2, PLOT_ARROW, 236);
   SetIndexBuffer(3, Buffer4);
   PlotIndexSetDouble(3, PLOT_EMPTY_VALUE, EMPTY_VALUE);
   PlotIndexSetInteger(3, PLOT_DRAW_BEGIN, MathMax(Bars(Symbol(), PERIOD_CURRENT)-PLOT_MAXIMUM_BARS_BACK+1, OMIT_OLDEST_BARS+1));
   PlotIndexSetInteger(3, PLOT_ARROW, 238);
   SetIndexBuffer(4, Buffer5);
   PlotIndexSetDouble(4, PLOT_EMPTY_VALUE, EMPTY_VALUE);
   PlotIndexSetInteger(4, PLOT_DRAW_BEGIN, MathMax(Bars(Symbol(), PERIOD_CURRENT)-PLOT_MAXIMUM_BARS_BACK+1, OMIT_OLDEST_BARS+1));
   SetIndexBuffer(5, Buffer6);
   PlotIndexSetDouble(5, PLOT_EMPTY_VALUE, EMPTY_VALUE);
   PlotIndexSetInteger(5, PLOT_DRAW_BEGIN, MathMax(Bars(Symbol(), PERIOD_CURRENT)-PLOT_MAXIMUM_BARS_BACK+1, OMIT_OLDEST_BARS+1));
   //initialize myPoint
   myPoint = Point();
   if(Digits() == 5 || Digits() == 3)
     {
      myPoint *= 10;
     }
   RSI_handle = iRSI(NULL, PERIOD_CURRENT, 14, PRICE_CLOSE);
   if(RSI_handle < 0)
     {
      Print("The creation of iRSI has failed: RSI_handle=", INVALID_HANDLE);
      Print("Runtime error = ", GetLastError());
      return(INIT_FAILED);
     }

   MA_handle = iMA(NULL, PERIOD_CURRENT, 7, 0, MODE_SMMA, PRICE_CLOSE);
   if(MA_handle < 0)
     {
      Print("The creation of iMA has failed: MA_handle=", INVALID_HANDLE);
      Print("Runtime error = ", GetLastError());
      return(INIT_FAILED);
     }

   MA_handle2 = iMA(NULL, PERIOD_CURRENT, 400, 0, MODE_SMA, PRICE_CLOSE);
   if(MA_handle2 < 0)
     {
      Print("The creation of iMA has failed: MA_handle2=", INVALID_HANDLE);
      Print("Runtime error = ", GetLastError());
      return(INIT_FAILED);
     }

   MA_handle3 = iMA(NULL, PERIOD_CURRENT, 100, 0, MODE_EMA, PRICE_CLOSE);
   if(MA_handle3 < 0)
     {
      Print("The creation of iMA has failed: MA_handle3=", INVALID_HANDLE);
      Print("Runtime error = ", GetLastError());
      return(INIT_FAILED);
     }

   MA_handle4 = iMA(NULL, PERIOD_CURRENT, 200, 0, MODE_SMA, PRICE_CLOSE);
   if(MA_handle4 < 0)
     {
      Print("The creation of iMA has failed: MA_handle4=", INVALID_HANDLE);
      Print("Runtime error = ", GetLastError());
      return(INIT_FAILED);
     }

   MA_handle5 = iMA(NULL, PERIOD_CURRENT, Fast_MA_period, 0, MODE_SMA, PRICE_CLOSE);
   if(MA_handle5 < 0)
     {
      Print("The creation of iMA has failed: MA_handle5=", INVALID_HANDLE);
      Print("Runtime error = ", GetLastError());
      return(INIT_FAILED);
     }

   MA_handle6 = iMA(NULL, PERIOD_CURRENT, Slow_MA_period, 0, MODE_SMA, PRICE_CLOSE);
   if(MA_handle6 < 0)
     {
      Print("The creation of iMA has failed: MA_handle6=", INVALID_HANDLE);
      Print("Runtime error = ", GetLastError());
      return(INIT_FAILED);
     }

   return(INIT_SUCCEEDED);
  }

//+------------------------------------------------------------------+
//| Custom indicator iteration function                              |
//+------------------------------------------------------------------+
int OnCalculate(const int rates_total,
                const int prev_calculated,
                const datetime& time[],
                const double& open[],
                const double& high[],
                const double& low[],
                const double& close[],
                const long& tick_volume[],
                const long& volume[],
                const int& spread[])
  {
   int limit = rates_total - prev_calculated;
   //--- counting from 0 to rates_total
   ArraySetAsSeries(Buffer1, true);
   ArraySetAsSeries(Buffer2, true);
   ArraySetAsSeries(Buffer3, true);
   ArraySetAsSeries(Buffer4, true);
   ArraySetAsSeries(Buffer5, true);
   ArraySetAsSeries(Buffer6, true);
   //--- initial zero
   if(prev_calculated < 1)
     {
      ArrayInitialize(Buffer1, EMPTY_VALUE);
      ArrayInitialize(Buffer2, EMPTY_VALUE);
      ArrayInitialize(Buffer3, EMPTY_VALUE);
      ArrayInitialize(Buffer4, EMPTY_VALUE);
      ArrayInitialize(Buffer5, EMPTY_VALUE);
      ArrayInitialize(Buffer6, EMPTY_VALUE);
     }
   else
      limit++;
   datetime Time[];

   datetime TimeShift[];
   if(CopyTime(Symbol(), PERIOD_CURRENT, 0, rates_total, TimeShift) <= 0) return(rates_total);
   ArraySetAsSeries(TimeShift, true);
   int barshift_M1[];
   ArrayResize(barshift_M1, rates_total);
   int barshift_D1[];
   ArrayResize(barshift_D1, rates_total);
   for(int i = 0; i < rates_total; i++)
     {
      barshift_M1[i] = iBarShift(Symbol(), PERIOD_M1, TimeShift[i]);
      barshift_D1[i] = iBarShift(Symbol(), PERIOD_D1, TimeShift[i]);
   }
   if(BarsCalculated(RSI_handle) <= 0)
      return(0);
   if(CopyBuffer(RSI_handle, 0, 0, rates_total, RSI) <= 0) return(rates_total);
   ArraySetAsSeries(RSI, true);
   if(CopyOpen(Symbol(), PERIOD_M1, 0, rates_total, Open) <= 0) return(rates_total);
   ArraySetAsSeries(Open, true);
   if(CopyClose(Symbol(), PERIOD_D1, 0, rates_total, Close) <= 0) return(rates_total);
   ArraySetAsSeries(Close, true);
   if(BarsCalculated(MA_handle) <= 0)
      return(0);
   if(CopyBuffer(MA_handle, 0, 0, rates_total, MA) <= 0) return(rates_total);
   ArraySetAsSeries(MA, true);
   if(BarsCalculated(MA_handle2) <= 0)
      return(0);
   if(CopyBuffer(MA_handle2, 0, 0, rates_total, MA2) <= 0) return(rates_total);
   ArraySetAsSeries(MA2, true);
   if(BarsCalculated(MA_handle3) <= 0)
      return(0);
   if(CopyBuffer(MA_handle3, 0, 0, rates_total, MA3) <= 0) return(rates_total);
   ArraySetAsSeries(MA3, true);
   if(BarsCalculated(MA_handle4) <= 0)
      return(0);
   if(CopyBuffer(MA_handle4, 0, 0, rates_total, MA4) <= 0) return(rates_total);
   ArraySetAsSeries(MA4, true);
   if(CopyLow(Symbol(), PERIOD_CURRENT, 0, rates_total, Low) <= 0) return(rates_total);
   ArraySetAsSeries(Low, true);
   if(CopyHigh(Symbol(), PERIOD_CURRENT, 0, rates_total, High) <= 0) return(rates_total);
   ArraySetAsSeries(High, true);
   if(BarsCalculated(MA_handle5) <= 0)
      return(0);
   if(CopyBuffer(MA_handle5, 0, 0, rates_total, MA5) <= 0) return(rates_total);
   ArraySetAsSeries(MA5, true);
   if(BarsCalculated(MA_handle6) <= 0)
      return(0);
   if(CopyBuffer(MA_handle6, 0, 0, rates_total, MA6) <= 0) return(rates_total);
   ArraySetAsSeries(MA6, true);
   if(CopyTime(Symbol(), Period(), 0, rates_total, Time) <= 0) return(rates_total);
   ArraySetAsSeries(Time, true);
   //--- main loop
   for(int i = limit-1; i >= 0; i--)
     {
      if (i >= MathMin(PLOT_MAXIMUM_BARS_BACK-1, rates_total-1-OMIT_OLDEST_BARS)) continue; //omit some old rates to prevent "Array out of range" or slow calculation

      if(barshift_M1[i] < 0 || barshift_M1[i] >= rates_total) continue;
      if(barshift_D1[i] < 0 || barshift_D1[i] >= rates_total) continue;

      //Indicator Buffer 1
      if(RSI[i] < Oversold
      && RSI[i+1] > Oversold //Relative Strength Index crosses below fixed value
      && Open[barshift_M1[i]] >= Close[1+barshift_D1[i]] //Candlestick Open >= Candlestick Close
      && MA[i] > MA2[i] //Moving Average > Moving Average
      && MA3[i] > MA4[i] //Moving Average > Moving Average
      )
        {
         Buffer1[i] = Low[1+i]; //Set indicator value at Candlestick Low
         if(i == 1 && Time[1] != time_alert) myAlert("indicator", "Buy"); //Alert on next bar open
         time_alert = Time[1];
        }
      else
        {
         Buffer1[i] = EMPTY_VALUE;
        }
      //Indicator Buffer 2
      if(RSI[i] > Overbought
      && RSI[i+1] < Overbought //Relative Strength Index crosses above fixed value
      && Open[barshift_M1[i]] <= Close[1+barshift_D1[i]] //Candlestick Open <= Candlestick Close
      && MA[i] < MA2[i] //Moving Average < Moving Average
      && MA3[i] < MA4[i] //Moving Average < Moving Average
      )
        {
         Buffer2[i] = High[1+i]; //Set indicator value at Candlestick High
         if(i == 1 && Time[1] != time_alert) myAlert("indicator", "Sell"); //Alert on next bar open
         time_alert = Time[1];
        }
      else
        {
         Buffer2[i] = EMPTY_VALUE;
        }
      //Indicator Buffer 3
      if(MA5[i] > MA6[i]
      && MA5[i+1] < MA6[i+1] //Moving Average crosses above Moving Average
      )
        {
         Buffer3[i] = Low[i]; //Set indicator value at Candlestick Low
         if(i == 1 && Time[1] != time_alert) myAlert("indicator", "Buy Reversal"); //Alert on next bar open
         time_alert = Time[1];
        }
      else
        {
         Buffer3[i] = EMPTY_VALUE;
        }
      //Indicator Buffer 4
      if(MA5[i] < MA6[i]
      && MA5[i+1] > MA6[i+1] //Moving Average crosses below Moving Average
      )
        {
         Buffer4[i] = High[i]; //Set indicator value at Candlestick High
         if(i == 1 && Time[1] != time_alert) myAlert("indicator", "Sell Reversal"); //Alert on next bar open
         time_alert = Time[1];
        }
      else
        {
         Buffer4[i] = EMPTY_VALUE;
        }
      //Indicator Buffer 5
      if(MA5[i] > MA6[i] //Moving Average > Moving Average
      )
        {
         Buffer5[i] = MA6[i]; //Set indicator value at Moving Average
         if(i == 1 && Time[1] != time_alert) myAlert("indicator", "Buy Trend"); //Alert on next bar open
         time_alert = Time[1];
        }
      else
        {
         Buffer5[i] = EMPTY_VALUE;
        }
      //Indicator Buffer 6
      if(MA5[i] < MA6[i] //Moving Average < Moving Average
      )
        {
         Buffer6[i] = MA6[i]; //Set indicator value at Moving Average
         if(i == 1 && Time[1] != time_alert) myAlert("indicator", "Sell Trend"); //Alert on next bar open
         time_alert = Time[1];
        }
      else
        {
         Buffer6[i] = EMPTY_VALUE;
        }
     }
   return(rates_total);
  }
//You are the best coder
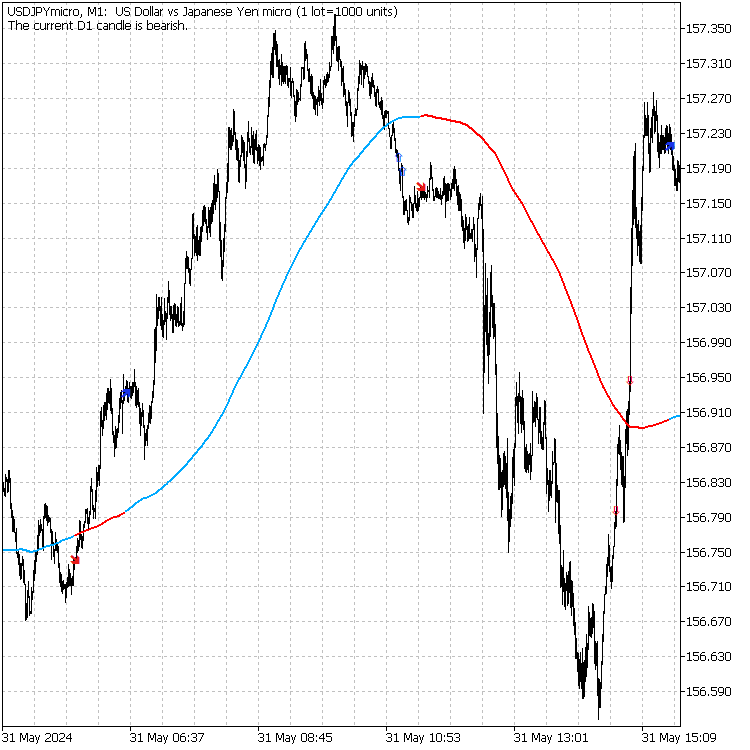
我们创新的程序现在展现出了先进的功能,即每当一个新的波段趋势建立时,就能够调整一条线的颜色。这一功能通过融入色彩来简化图表,从而增强了信号系统,与其他视觉和听觉性质的通知相辅相成。下面的图片直观地展示了这一最新功能的效果。

图2:USDJPY上运行Trend Constraint V1.04

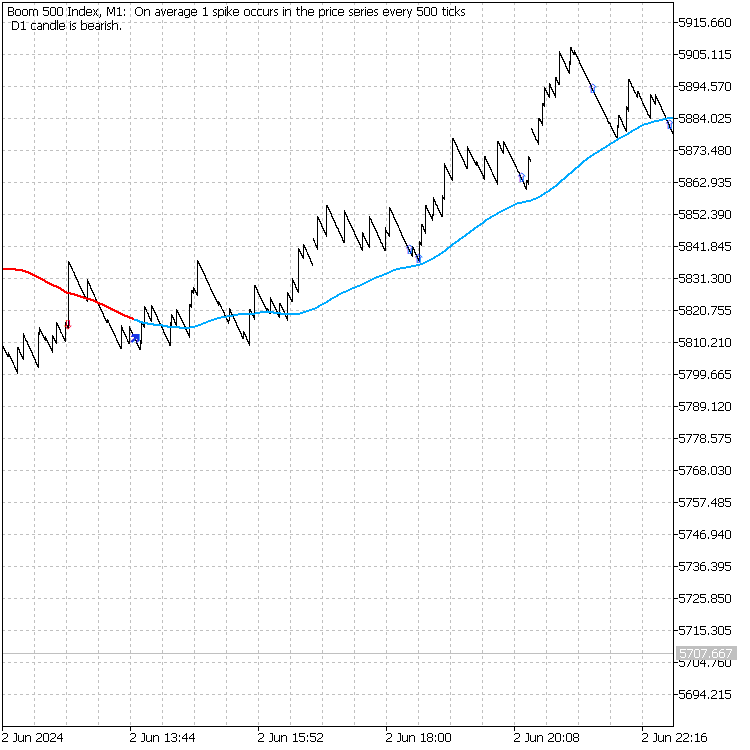
图 3:Trend Constraint v1.00 运行在Boom 500 指数上
我的D1 K线状态
为了给我们的模型添加一个新功能,我们希望在切换到MetaTrader 5并开始使用我们的模型后,能够迅速检查D1(日线)蜡烛图的状态。我决定引入一个脚本,该脚本可以在图表上显示日K线(D1)的状态,即使图表的时间框架不是D1也是如此。这一改进有助于快速识别K线图的状态,特别是在使用M1(1分钟)时间框架时,因为在某些缩短的时间框架下,D1周期的分隔线可能不可见。现在,让我们来查看下面给出的MQL5脚本代码:
//My_D1_candlestatus.mql5
//Author: Clemence Benjamin
//Link: https://www.mql5.com/en/users/billionaire2024/seller
#property copyright "Copyright 2024, Clemence Benjamin"
#property link      "https://www.mql5.com/en/users/billionaire2024/seller"
#property version   "1.00"
#property script_show_inputs
#property strict

//+------------------------------------------------------------------+
//| Script program start function                                    |
//+------------------------------------------------------------------+
void OnStart()
  {
   //--- Get the opening and closing prices of the current D1 candle
   double openPrice = iOpen(NULL, PERIOD_D1, 0);
   double closePrice = iClose(NULL, PERIOD_D1, 0);

   //--- Determine if the candle is bullish or bearish
   string candleStatus;
   if(closePrice > openPrice)
     {
      candleStatus = " D1 candle is bullish.";
     }
   else if(closePrice < openPrice)
     {
      candleStatus = " D1 candle is bearish.";
     }
   else
     {
      candleStatus = " D1 candle is neutral.";// when open price is equal to close price

     }

   //--- Print the status on the chart
   Comment(candleStatus);

   //--- Also print the status in the Experts tab for logging
   Print(candleStatus);
  }
//+------------------------------------------------------------------+
分析My_D1_Candlestatus.mq5脚本的函数和变量
| 函数和变量 | 描述 |
|---|---|
| OnStart() | 这是脚本的主函数,当脚本运行时执行。它获取当前日线的开盘价和收盘价,判断K线是上涨(牛市)、下跌(熊市)还是中性,然后使用Comment()函数在图表上显示这些信息。 |
| iOpen() 和 iClose() | 这两个函数用于获取当前日线的开盘价和收盘价。 |
| candleStatus | 一个字符串变量,用于存储当前日线的状态信息。 |
| Comment() | 此函数在图表上显示状态信息。 |
| Print() | 此函数将状态信息记录到“Experts”标签中,用于额外的日志记录。 |
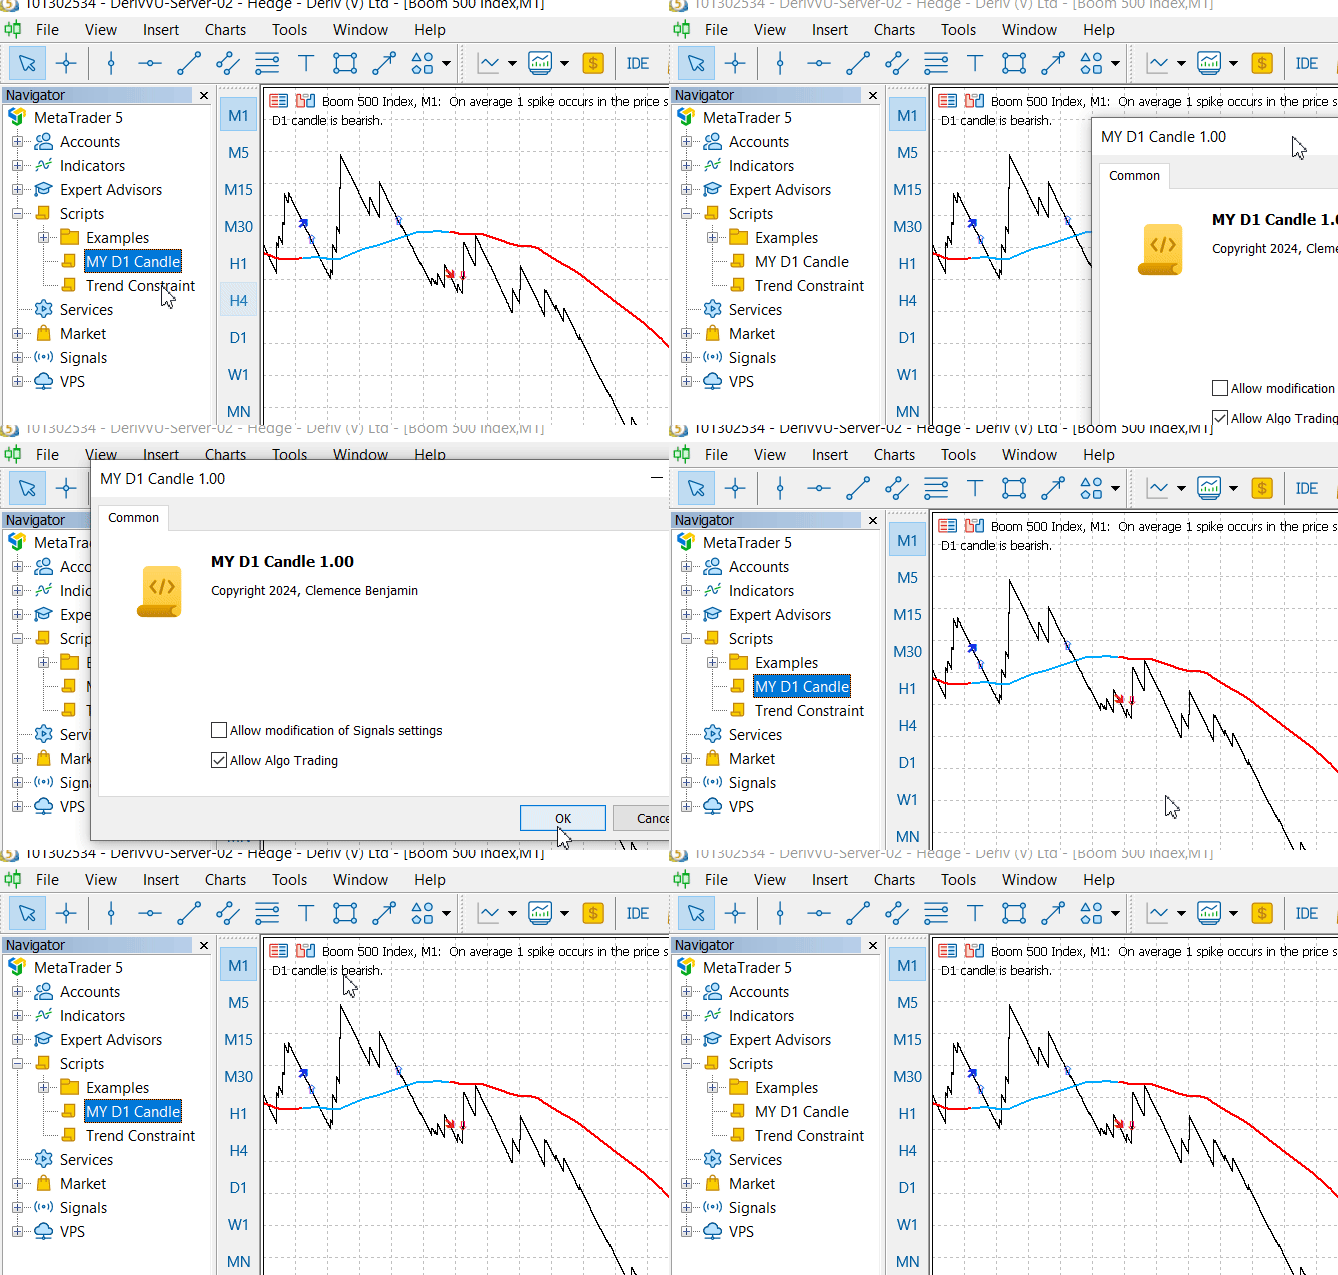
完成代码编译后,您可以按照文中的说明找到脚本并执行它。脚本将显示一个注释,显示当前K线的状态。

图4:运行My_D1_candlestatus.mq5脚本
MQL5绘图样式的其他替代方案
MetaTrader 5提供了多种绘图工具,如线条、通道和图形,方便交易者进行市场评估,这些工具都位于MetaTrader平台中。通过深入掌握MQL5面向对象编程语言及其与Python和C++的关联,交易者能够设计个性化的辅助工具和扩展。交易者可以利用这些工具提升技术分析能力,做出更明智的交易决策。MetaTrader 5的灵活性和定制选项使交易者能够根据自己的偏好和策略调整交易体验。
结论
我们成功地将新功能集成到程序中,取得了积极成果,这些成果有望影响我们后续从指标向EA发展的版本。MQL5的绘图样式为交易者带来了显著的好处,提高了数据可视化的清晰度、精确度和定制性。这些样式增强了技术分析能力,促进了高级图表技术的使用,并支持实时交互更新。此外,MQL5绘图样式提供的灵活性和创造力使交易者能够创建独特的指标和分析工具,丰富他们的交易方法和整体市场理解。
我们的模型正在向更加精细的方向发展,只需点击按钮即可获得即时的可视化信息。脚本会立即传达日线的状态,而DRAW_LINE功能则以易于理解的方式在低时间框架上强调趋势。我已包含此处讨论的所有功能的源文件。我相信您正在关注后续进展并有了自己的看法;请随时分享您的评论并参与讨论。
本文由MetaQuotes Ltd译自英文
原文地址: https://www.mql5.com/en/articles/14899
注意: MetaQuotes Ltd.将保留所有关于这些材料的权利。全部或部分复制或者转载这些材料将被禁止。
本文由网站的一位用户撰写,反映了他们的个人观点。MetaQuotes Ltd 不对所提供信息的准确性负责,也不对因使用所述解决方案、策略或建议而产生的任何后果负责。
 神经网络实践:最小二乘法
 您应当知道的 MQL5 向导技术(第 13 部分):智能信号类 DBSCAN
 为 Metatrader 5 开发 MQTT 客户端:TDD 方法 - 第 6 部分
 突破结构(BoS)交易策略分步指南

查看新文章:构建蜡烛图趋势约束模型(第 4 部分):为每个趋势波定制显示风格。
作者:Clemence Benjamin克莱蒙斯-本杰明