
构建一个K线图趋势约束模型(第二部分):融合原生指标
内容
引言
MetaTrader 5内置了多种指标,为交易者在市场中提供了显著的分析优势。本文将重点讨论其中的两个:移动平均线和相对强弱指数(RSI)。移动平均线常用于识别趋势的方向以及潜在的支撑位和阻力位。它们通过平滑价格数据来创建一条流畅的线条,从而更容易发现趋势。另一方面,相对强弱指数(RSI)是一种动量振荡器,用于衡量价格变动的速度和变化。交易者利用RSI来确定市场的超买和超卖状况,这有助于他们做出更为明智的交易决策。通过将这两个指标结合使用,交易者可以获得关于市场趋势以及潜在入场和出场点的宝贵见解。
以下是MetaTrader 5中常用的一些内置指标:
- 移动平均线(Moving Averages)
- 布林带 (Bollinger Bands)
- 相对强弱指数(RSI)
- 平滑异同移动平均线(MACD)
- 随机振荡器 (Stochastic Oscillator)
- 平均真实波动幅度(ATR)
- 一目平衡表指标(Ichimoku Kinko Hyo)
- 菲波纳奇回撤(Fibonacci Retracement)
通过结合移动平均线和相对强弱指数以及其他技术分析工具,交易者可以制定出更为全面的交易策略。交易者需要持续监控市场状况,并据此调整他们的策略,这样才能保持领先,并抓住盈利机会。保持自律和耐心至关重要,因为交易可能充满不确定性和波动性。通过将移动平均线和相对强弱指数纳入他们的分析中,交易者可以改善他们的决策过程,并增加在市场中成功的机会。记住,交易是一项需要时间和实践才能掌握的技能,因此致力于学习和提高你的交易能力是非常重要的。
回顾历史
让我们来分析下面的代码,以便我们能够评估指标在过去至少几千根K线数据上的表现。K线图对于识别市场趋势至关重要,因为它展示了每个时间段内的开盘价、收盘价、最高价和最低价之间的关系。通过分析过去的价格走势,交易者可以确定趋势的方向和强度,并据此调整他们的交易策略。历史上的K线形态可以精确地指出关键支撑位和阻力位,这些位置通常是价格暂停或反转的地方。通过研究价格在这些水平上的过去表现,交易者可以预测未来的价格走势,并为他们的交易设定有效的入场和出场点。交易者可以利用历史K线数据来回测他们的交易策略,并评估在不同市场环境下的表现。通过使用历史数据进行交易测试,交易者可以评估他们策略的有效性,并进行必要的调整以提高交易结果。简而言之,深入研究K线图历史是技术分析的重要组成部分,它为交易者提供了关于市场趋势、形态和行为的有价值见解,这些见解可以指导他们做出明智且盈利的交易选择。
除了分析历史K线形态外,交易者还可以使用技术指标来进一步加深对市场动态的理解。这些指标有助于识别潜在的入场和出场点,并提供趋势反转或持续的信号。通过将K线图提供的见解与指标生成的信号相结合,交易者可以制定出一个更加全面的交易策略,该策略同时考虑了价格行为和技术分析。这种整体方法可以改善决策制定,并提高在动态且不断变化的金融市场中成功交易的可能性。
让我们来检查这段代码,它定义了我们的指标在K线图上将回溯多远的历史数据作为我们主程序的一部分。
#define PLOT_MAXIMUM_BARS_BACK 10000 //the integer value can be made higher expanding the gap you can visualize in history
#define OMIT_OLDEST_BARS 50
识别当前系统的一些问题
在这个阶段,我们检查趋势约束指标在图表上提供的信号。尽管它成功地过滤掉了负面信号,但我们仍然面临着在非常小的视觉尺度上出现偏离趋势信号的问题。消除这些信号并专注于真正的趋势信号是很重要的。这突显了通过MQL5使用内置工具(如移动平均线和相对强弱指数RSI)的必要性。在接下来的部分中,我们将进一步深入探讨这些工具。
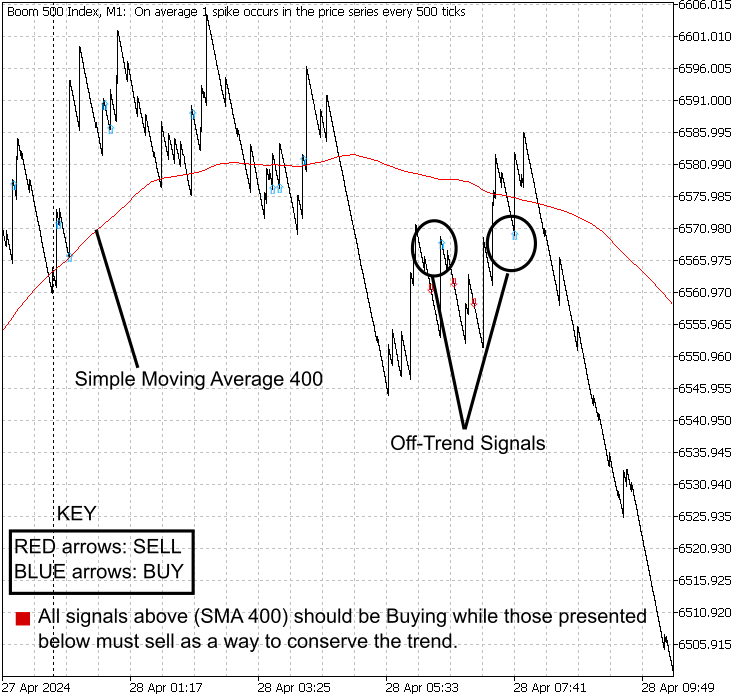
图 1:Trend Constraint v1.00, Boom 500 index
在接下来的部分中,我们将探讨移动平均线和相对强弱指数(RSI)如何帮助增强我们的趋势分析能力,并为决策提供更准确的信号。通过将这些工具纳入我们的分析中,我们旨在提高交易策略的整体有效性,并在市场中取得更好的结果。让我们更深入地了解这些工具的功能和优势,以优化我们的交易方法。
编写下一个版本的MQL5程序
一旦我们的MQL5开发之旅开始,每个完成的阶段都标志着一个版本的诞生。随着我们不断向程序中添加功能,我们需要将版本升级。让我们来看看在代码开头是如何进行版本控制的。下面是我们趋势约束(Trend Constraint)指标的第一版代码。
///Indicator Name: Trend Constraint
#property copyright "Clemence Benjamin"
#property link      "https://mql5.com"
#property version   "1.00"
#property description "A model that seek to produce sell signal when D1 candle is Bearish only and  buy signal when it is Bullish"
要升级我们的版本,我们只需更改代码中version属性下的数字即可。例如,在这篇文章中,我们的下一个趋势约束(Trend Constraint)指标的版本将是1.01。下面是更新后的代码片段,展示了它将在文章后面的主代码中如何显示。
///Indicator Name: Trend Constraint
#property copyright "Clemence Benjamin"
#property link      "https://mql5.com"
#property version   "1.01"
#property description "A model that seek to produce sell signal when D1 candle is Bearish only and  buy signal when it is Bullish"
太棒了!这就是我们升级MQL5程序的方法。接下来,我们将把它升级到1.02版、1.03版、1.04版,以此类推。
研究移动平均线
移动平均线(MAs)在展示市场趋势方面至关重要,包括慢速和快速移动平均线。这两条线的交叉可能表明趋势的延续或反转。在本文中,我使用了一条周期为7的平滑移动平均线,与一条长周期400的简单移动平均线进行对比,以消除某些偏离趋势的信号。这种方法能够更准确地反映市场的潜在趋势,过滤掉短期波动和噪声。通过结合使用快速和慢速移动平均线,我能够识别出重要的趋势变化,同时最大限度地减少假信号。这种方法在捕捉市场的大趋势方面证明是有效的,并为做出明智的交易决策提供了有价值的见解。
移动平均线是一种广泛使用的技术分析工具,它通过创建一个不断更新的平均价格来平滑价格数据。它有助于交易者识别趋势和潜在的反转点。移动平均线的概念是为了减少短期波动的影响,并突出价格运动中的长期趋势而开发的。
在金融分析中使用移动平均线可以追溯到20世纪中叶的早期技术分析师,如理查德·唐奇安(Richard Donchian)和乔治·马雷夏尔(George Marechal)。
计算简单移动平均线(SMA)的公式很简单:
SMA = (P1 + P2 ... + Pn)/n
其中:
- SMA = 简单移动平均(Simple Moving Average)
- P1, P2, ..., Pn = 指定周期(例如收盘价)的价格
- n = 计算平均值所涵盖的周期数(例如天数)。
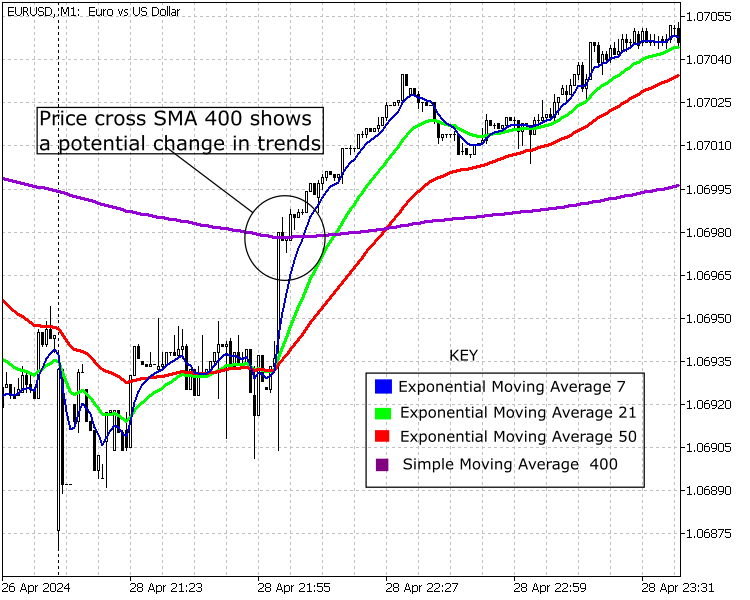
图 2: 移动平均线, EURUSD
把移动平均线融入程序中
最慢速的移动平均线在识别趋势变化方面具有重要意义。这从价格与慢速移动平均线的相互作用中显而易见。通常,价格在继续或改变趋势之前会多次测试慢速移动平均线。慢速移动平均线紧密跟随当前的价格走势。通过这种方式,慢速移动平均线充当了稳健的支撑位或阻力位,反映了潜在趋势的强度。 交易者经常使用此指标来确认趋势的反转或延续,因为其滞后性提供了可靠的市场情绪衡量标准。通过观察价格与慢速移动平均线之间的关系,投资者可以获得有关市场动态的有价值见解,并做出明智的交易决策。
此外,慢速移动平均线平滑价格波动的能力可以为交易者提供更清晰的市场整体方向视图。通过关注价格与慢速移动平均线之间的收敛或发散,投资者可以预测动量的潜在变化。该指标在捕捉长期趋势方面的可靠性使其成为交易者寻求应对大幅价格波动同时过滤掉短期噪声的宝贵工具。了解慢速移动平均线的细微差别可以增强交易者在金融市场中更加精确和自信地应对复杂情况的能力。
在前面的文章中,我们开发了一个带有两个买卖缓冲区的D1趋势约束指标。虽然它最初看起来令人满意,但现在我们的目标是进一步提高其有效性。与我们的前期工作类似,该代码包含两个缓冲区。我们的目标是使用慢速移动平均线来过滤输出信号,以过滤掉虚假信号。慢速移动平均线在确定趋势方面发挥着重要作用。该限制规定,仅当价格高于400期简单移动平均线(SMA)时才买入,仅当价格低于400期SMA时才卖出。
- 平滑简单移动平均线(SSMA)7代表价格
- 简单移动平均线400代表趋势强化
- MQL5代码如下
///Indicator Name: Trend Constraint
#property copyright "Clemence Benjamin"
#property link      "https://mql5.com"
#property version   "1.00"
#property description "A model that seek to produce sell signal when D1 candle is Bearish only and  buy signal when it is Bullish"

//--- indicator settings
#property indicator_chart_window
#property indicator_buffers 2
#property indicator_plots 2

#property indicator_type1 DRAW_ARROW
#property indicator_width1 5
#property indicator_color1 0xD42A00
#property indicator_label1 "Buy"

#property indicator_type2 DRAW_ARROW
#property indicator_width2 5
#property indicator_color2 0x0000D4
#property indicator_label2 "Sell"

#define PLOT_MAXIMUM_BARS_BACK 5000
#define OMIT_OLDEST_BARS 50

//--- indicator buffers
double Buffer1[];
double Buffer2[];

double myPoint; //initialized in OnInit
int MA_handle;
double MA[];
int MA_handle2;
double MA2[];
double Open[];
double Close[];
int MA_handle3;
double MA3[];
int MA_handle4;
double MA4[];
double Low[];
double High[];

void myAlert(string type, string message)
  {
   if(type == "print")
      Print(message);
   else if(type == "error")
     {
      Print(type+" | Trend Constraint @ "+Symbol()+","+IntegerToString(Period())+" | "+message);
     }
   else if(type == "order")
     {
     }
   else if(type == "modify")
     {
     }
  }

//+------------------------------------------------------------------+
//| Custom indicator initialization function                         |
//+------------------------------------------------------------------+
int OnInit()
  {
   SetIndexBuffer(0, Buffer1);
   PlotIndexSetDouble(0, PLOT_EMPTY_VALUE, EMPTY_VALUE);
   PlotIndexSetInteger(0, PLOT_DRAW_BEGIN, MathMax(Bars(Symbol(), PERIOD_CURRENT)-PLOT_MAXIMUM_BARS_BACK+1, OMIT_OLDEST_BARS+1));
   PlotIndexSetInteger(0, PLOT_ARROW, 241);
   SetIndexBuffer(1, Buffer2);
   PlotIndexSetDouble(1, PLOT_EMPTY_VALUE, EMPTY_VALUE);
   PlotIndexSetInteger(1, PLOT_DRAW_BEGIN, MathMax(Bars(Symbol(), PERIOD_CURRENT)-PLOT_MAXIMUM_BARS_BACK+1, OMIT_OLDEST_BARS+1));
   PlotIndexSetInteger(1, PLOT_ARROW, 242);
   //initialize myPoint
   myPoint = Point();
   if(Digits() == 5 || Digits() == 3)
     {
      myPoint *= 10;
     }
   MA_handle = iMA(NULL, PERIOD_CURRENT, 7, 0, MODE_EMA, PRICE_CLOSE);
   if(MA_handle < 0)
     {
      Print("The creation of iMA has failed: MA_handle=", INVALID_HANDLE);
      Print("Runtime error = ", GetLastError());
      return(INIT_FAILED);
     }

   MA_handle2 = iMA(NULL, PERIOD_CURRENT, 21, 0, MODE_EMA, PRICE_CLOSE);
   if(MA_handle2 < 0)
     {
      Print("The creation of iMA has failed: MA_handle2=", INVALID_HANDLE);
      Print("Runtime error = ", GetLastError());
      return(INIT_FAILED);
     }

   MA_handle3 = iMA(NULL, PERIOD_CURRENT, 7, 0, MODE_SMMA, PRICE_CLOSE);
   if(MA_handle3 < 0)
     {
      Print("The creation of iMA has failed: MA_handle3=", INVALID_HANDLE);
      Print("Runtime error = ", GetLastError());
      return(INIT_FAILED);
     }

   MA_handle4 = iMA(NULL, PERIOD_CURRENT, 400, 0, MODE_SMA, PRICE_CLOSE);
   if(MA_handle4 < 0)
     {
      Print("The creation of iMA has failed: MA_handle4=", INVALID_HANDLE);
      Print("Runtime error = ", GetLastError());
      return(INIT_FAILED);
     }

   return(INIT_SUCCEEDED);
  }

//+------------------------------------------------------------------+
//| Custom indicator iteration function                              |
//+------------------------------------------------------------------+
int OnCalculate(const int rates_total,
                const int prev_calculated,
                const datetime& time[],
                const double& open[],
                const double& high[],
                const double& low[],
                const double& close[],
                const long& tick_volume[],
                const long& volume[],
                const int& spread[])
  {
   int limit = rates_total - prev_calculated;
   //--- counting from 0 to rates_total
   ArraySetAsSeries(Buffer1, true);
   ArraySetAsSeries(Buffer2, true);
   //--- initial zero
   if(prev_calculated < 1)
     {
      ArrayInitialize(Buffer1, EMPTY_VALUE);
      ArrayInitialize(Buffer2, EMPTY_VALUE);
     }
   else
      limit++;

   datetime TimeShift[];
   if(CopyTime(Symbol(), PERIOD_CURRENT, 0, rates_total, TimeShift) <= 0) return(rates_total);
   ArraySetAsSeries(TimeShift, true);
   int barshift_M1[];
   ArrayResize(barshift_M1, rates_total);
   int barshift_D1[];
   ArrayResize(barshift_D1, rates_total);
   for(int i = 0; i < rates_total; i++)
     {
      barshift_M1[i] = iBarShift(Symbol(), PERIOD_M1, TimeShift[i]);
      barshift_D1[i] = iBarShift(Symbol(), PERIOD_D1, TimeShift[i]);
   }
   if(BarsCalculated(MA_handle) <= 0)
      return(0);
   if(CopyBuffer(MA_handle, 0, 0, rates_total, MA) <= 0) return(rates_total);
   ArraySetAsSeries(MA, true);
   if(BarsCalculated(MA_handle2) <= 0)
      return(0);
   if(CopyBuffer(MA_handle2, 0, 0, rates_total, MA2) <= 0) return(rates_total);
   ArraySetAsSeries(MA2, true);
   if(CopyOpen(Symbol(), PERIOD_M1, 0, rates_total, Open) <= 0) return(rates_total);
   ArraySetAsSeries(Open, true);
   if(CopyClose(Symbol(), PERIOD_D1, 0, rates_total, Close) <= 0) return(rates_total);
   ArraySetAsSeries(Close, true);
   if(BarsCalculated(MA_handle3) <= 0)
      return(0);
   if(CopyBuffer(MA_handle3, 0, 0, rates_total, MA3) <= 0) return(rates_total);
   ArraySetAsSeries(MA3, true);
   if(BarsCalculated(MA_handle4) <= 0)
      return(0);
   if(CopyBuffer(MA_handle4, 0, 0, rates_total, MA4) <= 0) return(rates_total);
   ArraySetAsSeries(MA4, true);
   if(CopyLow(Symbol(), PERIOD_CURRENT, 0, rates_total, Low) <= 0) return(rates_total);
   ArraySetAsSeries(Low, true);
   if(CopyHigh(Symbol(), PERIOD_CURRENT, 0, rates_total, High) <= 0) return(rates_total);
   ArraySetAsSeries(High, true);
   //--- main loop
   for(int i = limit-1; i >= 0; i--)
     {
      if (i >= MathMin(PLOT_MAXIMUM_BARS_BACK-1, rates_total-1-OMIT_OLDEST_BARS)) continue; //omit some old rates to prevent "Array out of range" or slow calculation

      if(barshift_M1[i] < 0 || barshift_M1[i] >= rates_total) continue;
      if(barshift_D1[i] < 0 || barshift_D1[i] >= rates_total) continue;

      //Indicator Buffer 1
      if(MA[i] > MA2[i]
      && MA[i+1] < MA2[i+1] //Moving Average crosses above Moving Average
      && Open[barshift_M1[i]] >= Close[1+barshift_D1[i]] //Candlestick Open >= Candlestick Close
      && MA3[i] > MA4[i] //Moving Average > Moving Average
      )
        {
         Buffer1[i] = Low[i]; //Set indicator value at Candlestick Low
        }
      else
        {
         Buffer1[i] = EMPTY_VALUE;
        }
      //Indicator Buffer 2
      if(MA[i] < MA2[i]
      && MA[i+1] > MA2[i+1] //Moving Average crosses below Moving Average
      && Open[barshift_M1[i]] <= Close[1+barshift_D1[i]] //Candlestick Open <= Candlestick Close
      && MA3[i] < MA4[i] //Moving Average < Moving Average
      )
        {
         Buffer2[i] = High[i]; //Set indicator value at Candlestick High
        }
      else
        {
         Buffer2[i] = EMPTY_VALUE;
        }
     }
   return(rates_total);
  }
//Thank you for following along this is ready to  compile
研究RSI振荡器
相对强弱指数(RSI)有助于识别市场的极端区域,包括超买和超卖区域。这对于希望确定潜在反转点或趋势延续机会的交易者来说非常有用。通过结合其他技术指标和分析方法使用RSI,交易者在进入或退出交易时可以做出更明智的决策。此外,RSI还可以用来确认趋势的强度,或发现价格与量能之间的背离,这可能表明潜在的方向变化。交易者在做出交易决策时应谨慎,不应仅依赖相对强弱指数(RSI),而应始终考虑其他因素,如市场状况、新闻事件以及整体市场情绪。重要的是要记住,没有哪个指标是万无一失的,成功的交易策略通常需要结合多种工具和分析方法。
下面的RSI公式归功于J. Welles Wilder Jr.,他于1978年提出了这一概念。
RSI = 100 - (100/(1+RS))
其中:
- RS = 平均获利/平均亏损
- 平均收益 = 指定期间内收益的总和 / 期间的数量
- 平均亏损 = 指定期间内亏损的总和 / 期间的数量
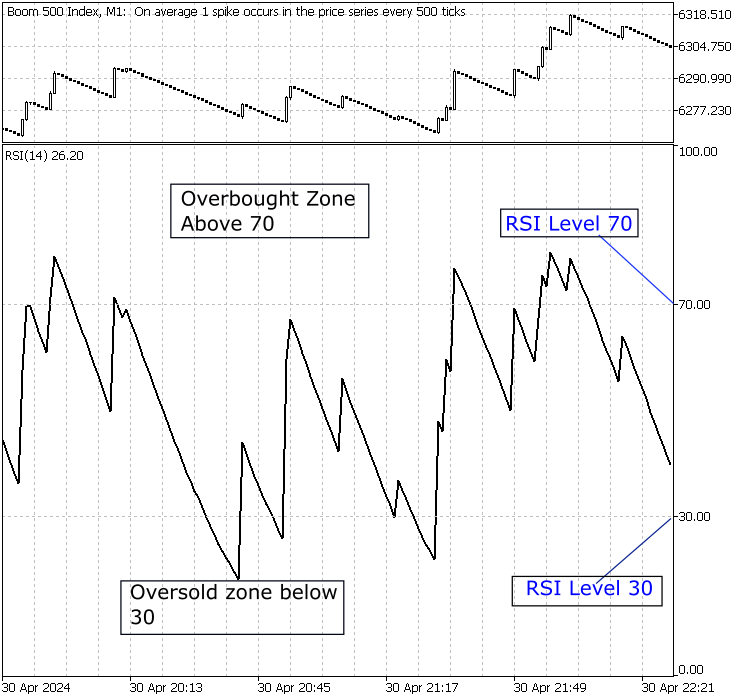
图 3:RSI levels, Boom 500 index
实现RSI指标
在代码中识别相对强弱指数(RSI)水平并将其与主要趋势相结合可以非常有用。在本节中,我们将RSI条件纳入我们的MQL5指标程序中。将相对强弱指数(RSI)的条件融入我们的MQL5指标程序中,使我们能够更好地分析市场趋势,并做出更加明智的交易决策。通过将RSI水平与主要趋势相结合,我们可以更准确地识别潜在的入场和出场点,从而提高交易策略的有效性。我们以前依赖移动平均线交叉作为入场条件。现在,我们不再使用移动平均线交叉,而是使用RSI水平作为入场条件,并结合最近纳入的其他条件,创建了新版本——Trend Constrain V1.02。
在这个阶段,我们需要纳入RSI值的输入,以便对超买和超卖区域进行优化。请查看下面的代码。
input double Oversold = 30;
input double Overbought = 70;
//I have set the default standard values, but you can alter them to suit your strategy and instrument being traded.
现在,让我们将这些RSI条件实现到代码中,以增强我们指标的功能。让我们从定义指标中想要使用的RSI水平开始。我们可以将超买水平设置为70,超卖水平设置为30。这将有助于我们识别市场中潜在的反转点。接下来,我们将在代码中添加必要的逻辑来检查这些RSI条件,并据此生成信号。这将为我们提供更全面的市场动态视图,并帮助我们做出更明智的交易决策。让我们开始将这些更改实现到我们的MQL5指标程序中。
///Indicator Name: Trend Constraint
#property copyright "Clemence Benjamin"
#property link      "https://mql5.com"
#property version   "1.02"
#property description "A model that seek to produce sell signal when D1 candle is Bearish only and  buy signal when it is Bullish"

///--- indicator settings
#property indicator_chart_window
#property indicator_buffers 2
#property indicator_plots 2

#property indicator_type1 DRAW_ARROW
#property indicator_width1 5
#property indicator_color1 0xFF3C00
#property indicator_label1 "Buy"

#property indicator_type2 DRAW_ARROW
#property indicator_width2 5
#property indicator_color2 0x0000FF
#property indicator_label2 "Sell"

#define PLOT_MAXIMUM_BARS_BACK 5000
#define OMIT_OLDEST_BARS 50

//--- indicator buffers
double Buffer1[];
double Buffer2[];

input double Oversold = 30;
input double Overbought = 70;
double myPoint; //initialized in OnInit
int RSI_handle;
double RSI[];
double Open[];
double Close[];
int MA_handle;
double MA[];
int MA_handle2;
double MA2[];
double Low[];
double High[];

void myAlert(string type, string message)
  {
   if(type == "print")
      Print(message);
   else if(type == "error")
     {
      Print(type+" | Trend Constraint V1.02 @ "+Symbol()+","+IntegerToString(Period())+" | "+message);
     }
   else if(type == "order")
     {
     }
   else if(type == "modify")
     {
     }
  }

//+------------------------------------------------------------------+
//| Custom indicator initialization function                         |
//+------------------------------------------------------------------+
int OnInit()
  {
   SetIndexBuffer(0, Buffer1);
   PlotIndexSetDouble(0, PLOT_EMPTY_VALUE, EMPTY_VALUE);
   PlotIndexSetInteger(0, PLOT_DRAW_BEGIN, MathMax(Bars(Symbol(), PERIOD_CURRENT)-PLOT_MAXIMUM_BARS_BACK+1, OMIT_OLDEST_BARS+1));
   PlotIndexSetInteger(0, PLOT_ARROW, 241);
   SetIndexBuffer(1, Buffer2);
   PlotIndexSetDouble(1, PLOT_EMPTY_VALUE, EMPTY_VALUE);
   PlotIndexSetInteger(1, PLOT_DRAW_BEGIN, MathMax(Bars(Symbol(), PERIOD_CURRENT)-PLOT_MAXIMUM_BARS_BACK+1, OMIT_OLDEST_BARS+1));
   PlotIndexSetInteger(1, PLOT_ARROW, 242);
   //initialize myPoint
   myPoint = Point();
   if(Digits() == 5 || Digits() == 3)
     {
      myPoint *= 10;
     }
   RSI_handle = iRSI(NULL, PERIOD_CURRENT, 14, PRICE_CLOSE);
   if(RSI_handle < 0)
     {
      Print("The creation of iRSI has failed: RSI_handle=", INVALID_HANDLE);
      Print("Runtime error = ", GetLastError());
      return(INIT_FAILED);
     }

   MA_handle = iMA(NULL, PERIOD_CURRENT, 7, 0, MODE_SMMA, PRICE_CLOSE);
   if(MA_handle < 0)
     {
      Print("The creation of iMA has failed: MA_handle=", INVALID_HANDLE);
      Print("Runtime error = ", GetLastError());
      return(INIT_FAILED);
     }

   MA_handle2 = iMA(NULL, PERIOD_CURRENT, 400, 0, MODE_SMA, PRICE_CLOSE);
   if(MA_handle2 < 0)
     {
      Print("The creation of iMA has failed: MA_handle2=", INVALID_HANDLE);
      Print("Runtime error = ", GetLastError());
      return(INIT_FAILED);
     }

   return(INIT_SUCCEEDED);
  }

//+------------------------------------------------------------------+
//| Custom indicator iteration function                              |
//+------------------------------------------------------------------+
int OnCalculate(const int rates_total,
                const int prev_calculated,
                const datetime& time[],
                const double& open[],
                const double& high[],
                const double& low[],
                const double& close[],
                const long& tick_volume[],
                const long& volume[],
                const int& spread[])
  {
   int limit = rates_total - prev_calculated;
   //--- counting from 0 to rates_total
   ArraySetAsSeries(Buffer1, true);
   ArraySetAsSeries(Buffer2, true);
   //--- initial zero
   if(prev_calculated < 1)
     {
      ArrayInitialize(Buffer1, EMPTY_VALUE);
      ArrayInitialize(Buffer2, EMPTY_VALUE);
     }
   else
      limit++;

   datetime TimeShift[];
   if(CopyTime(Symbol(), PERIOD_CURRENT, 0, rates_total, TimeShift) <= 0) return(rates_total);
   ArraySetAsSeries(TimeShift, true);
   int barshift_M1[];
   ArrayResize(barshift_M1, rates_total);
   int barshift_D1[];
   ArrayResize(barshift_D1, rates_total);
   for(int i = 0; i < rates_total; i++)
     {
      barshift_M1[i] = iBarShift(Symbol(), PERIOD_M1, TimeShift[i]);
      barshift_D1[i] = iBarShift(Symbol(), PERIOD_D1, TimeShift[i]);
   }
   if(BarsCalculated(RSI_handle) <= 0)
      return(0);
   if(CopyBuffer(RSI_handle, 0, 0, rates_total, RSI) <= 0) return(rates_total);
   ArraySetAsSeries(RSI, true);
   if(CopyOpen(Symbol(), PERIOD_M1, 0, rates_total, Open) <= 0) return(rates_total);
   ArraySetAsSeries(Open, true);
   if(CopyClose(Symbol(), PERIOD_D1, 0, rates_total, Close) <= 0) return(rates_total);
   ArraySetAsSeries(Close, true);
   if(BarsCalculated(MA_handle) <= 0)
      return(0);
   if(CopyBuffer(MA_handle, 0, 0, rates_total, MA) <= 0) return(rates_total);
   ArraySetAsSeries(MA, true);
   if(BarsCalculated(MA_handle2) <= 0)
      return(0);
   if(CopyBuffer(MA_handle2, 0, 0, rates_total, MA2) <= 0) return(rates_total);
   ArraySetAsSeries(MA2, true);
   if(CopyLow(Symbol(), PERIOD_CURRENT, 0, rates_total, Low) <= 0) return(rates_total);
   ArraySetAsSeries(Low, true);
   if(CopyHigh(Symbol(), PERIOD_CURRENT, 0, rates_total, High) <= 0) return(rates_total);
   ArraySetAsSeries(High, true);
   //--- main loop
   for(int i = limit-1; i >= 0; i--)
     {
      if (i >= MathMin(PLOT_MAXIMUM_BARS_BACK-1, rates_total-1-OMIT_OLDEST_BARS)) continue; //omit some old rates to prevent "Array out of range" or slow calculation

      if(barshift_M1[i] < 0 || barshift_M1[i] >= rates_total) continue;
      if(barshift_D1[i] < 0 || barshift_D1[i] >= rates_total) continue;

      //Indicator Buffer 1
      if(RSI[i] < Oversold
      && RSI[i+1] > Oversold //Relative Strength Index crosses below fixed value
      && Open[barshift_M1[i]] >= Close[1+barshift_D1[i]] //Candlestick Open >= Candlestick Close
      && MA[i] > MA2[i] //Moving Average > Moving Average
      )
        {
         Buffer1[i] = Low[i]; //Set indicator value at Candlestick Low
        }
      else
        {
         Buffer1[i] = EMPTY_VALUE;
        }
      //Indicator Buffer 2
      if(RSI[i] > Overbought
      && RSI[i+1] < Overbought //Relative Strength Index crosses above fixed value
      && Open[barshift_M1[i]] <= Close[1+barshift_D1[i]] //Candlestick Open <= Candlestick Close
      && MA[i] < MA2[i] //Moving Average < Moving Average
      )
        {
         Buffer2[i] = High[i]; //Set indicator value at Candlestick High
        }
      else
        {
         Buffer2[i] = EMPTY_VALUE;
        }
     }
   return(rates_total);
  }
// Thank you for following along we are here
比较结果
在回顾了之前的文章后,我们在创建清晰图表并展示信号数量方面取得了显著进展。相对强弱指数(RSI)和移动平均线对我们的结果产生了积极影响,它们作为可视化指标,帮助我们监测趋势的变化。我们的长时间框架K线趋势约束指标也有所改善。此外,纳入简单移动平均线(SMA 400)指标为我们提供了更加深入的市场潜在反转的洞察力,从而提高了我们整体分析的准确性。通过结合这些不同的信号,我们更能做出明智的交易决策,并适应不断变化的市场条件。我对我们取得的进展感到兴奋,并致力于继续完善这一策略,以期在未来取得更好的成果。
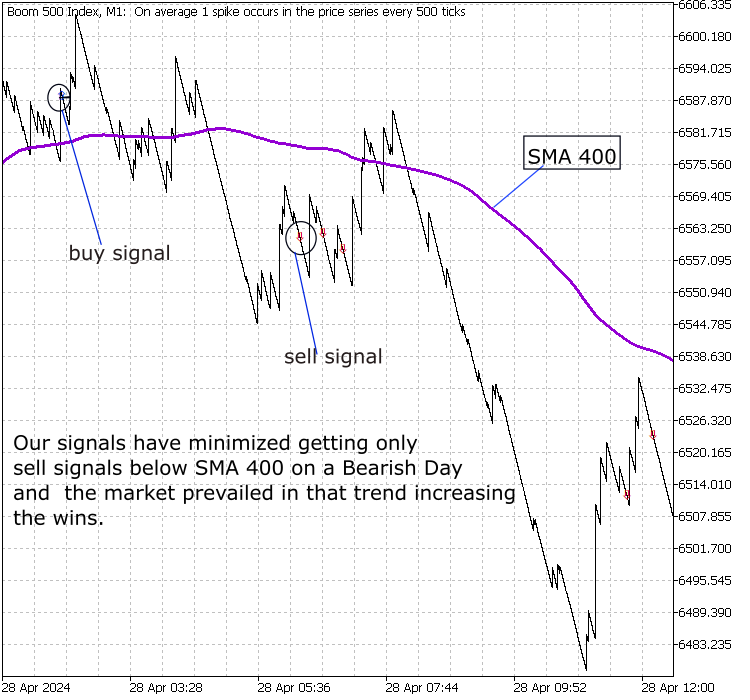
图 4:Trend Constraint v1.02, Boom 500 index
上面的图片可以参照文章开头,当时我们正在寻找当前系统存在的一些问题。
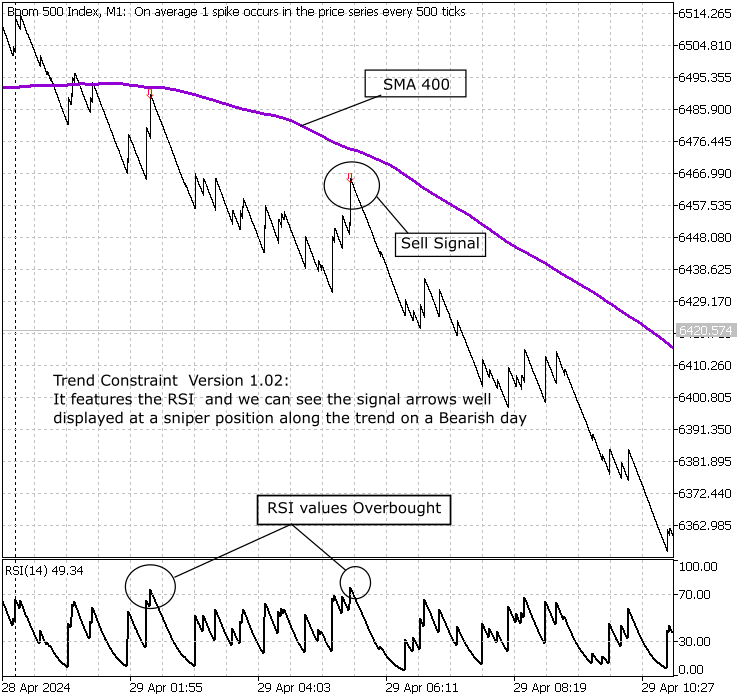
图 5:Trend Constraint v1.02, Boom 500 index
结论
K线图趋势约束指标不能替代移动平均线,但可以与之相辅相成,取得优异的结果。MT5上的内置指标是创建其他自定义指标的基础。这些工具一起使用时可以非常有效。我们在这个开发过程中已经进入了一个新的阶段,并开始面临权重和刷新挑战等问题,这些问题需要关注。在继续完善这个系统的过程中,我们的下一篇文章将集中讨论如何解决这些挑战。
请参考 Algobook
本文由MetaQuotes Ltd译自英文
原文地址: https://www.mql5.com/en/articles/14803
注意: MetaQuotes Ltd.将保留所有关于这些材料的权利。全部或部分复制或者转载这些材料将被禁止。
本文由网站的一位用户撰写,反映了他们的个人观点。MetaQuotes Ltd 不对所提供信息的准确性负责,也不对因使用所述解决方案、策略或建议而产生的任何后果负责。
 神经网络变得简单(第 76 部分):配合多未来变换器探索不同的交互形态
 龟壳演化算法(TSEA)
 群体优化算法:抵抗陷入局部极值(第一部分)
深刻!
谢谢。希望对你有用。