The First Red MT4
- Göstergeler
- Sürüm: 1.0
- Etkinleştirmeler: 5
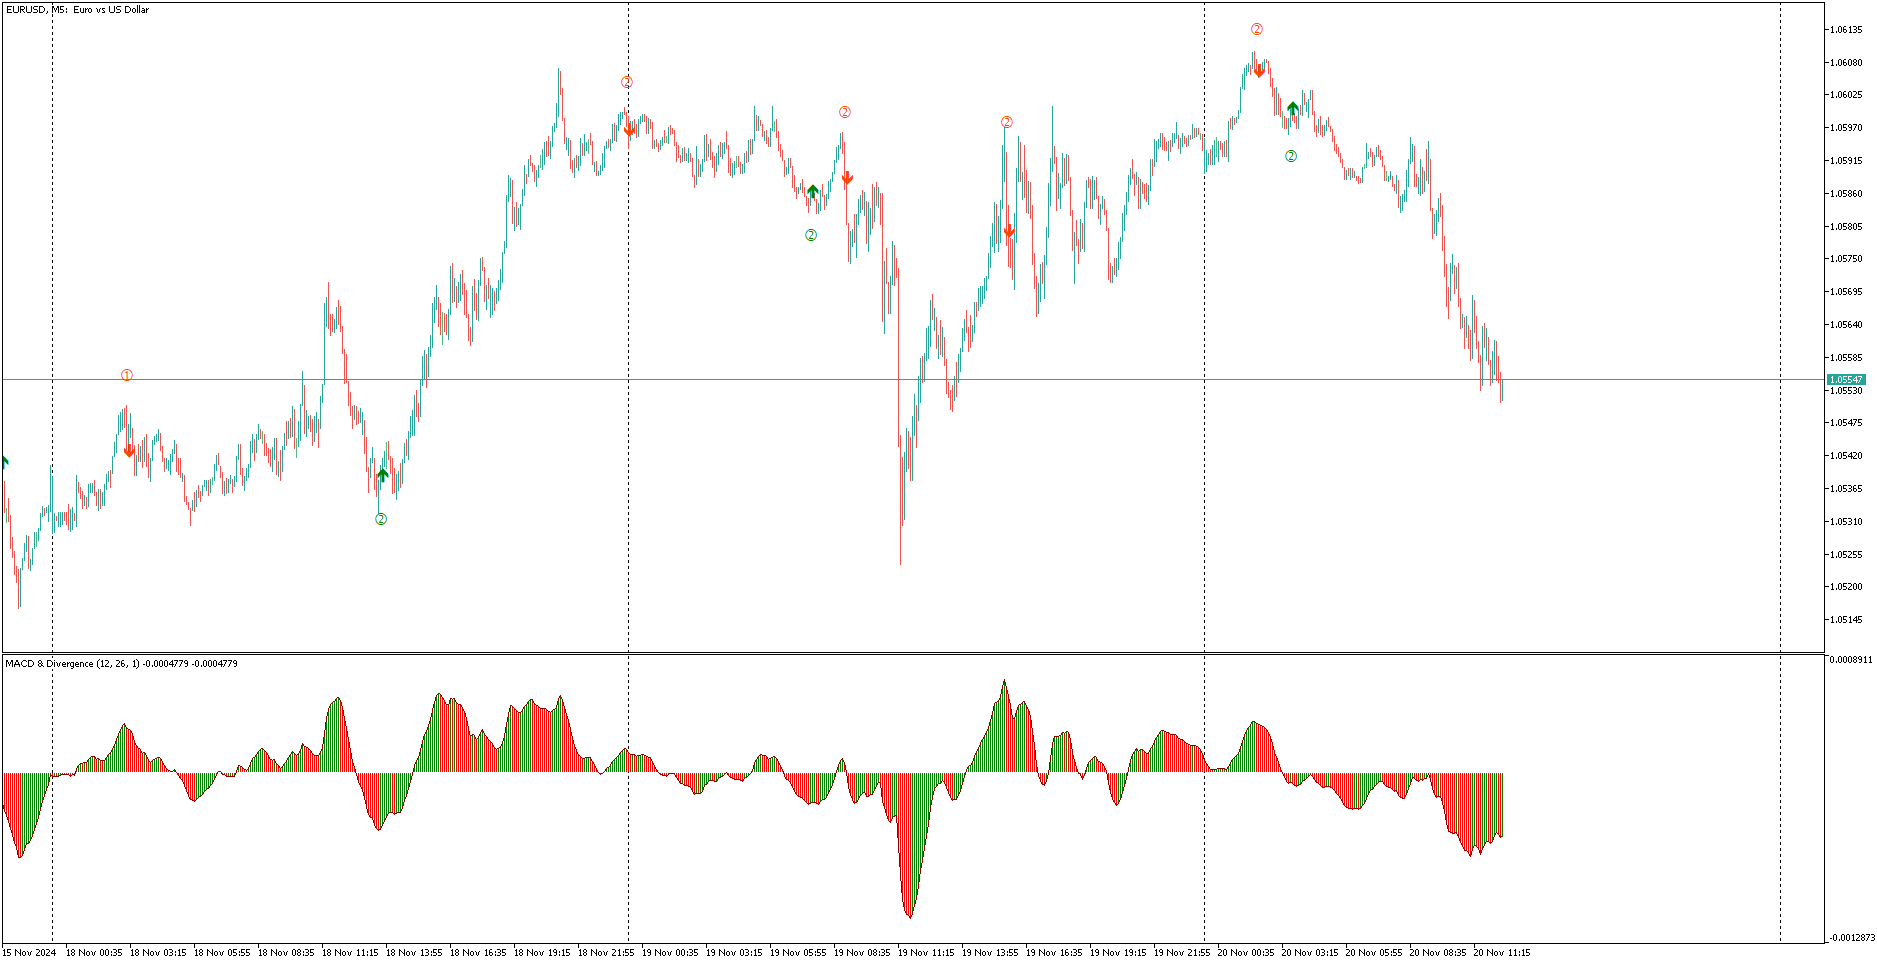
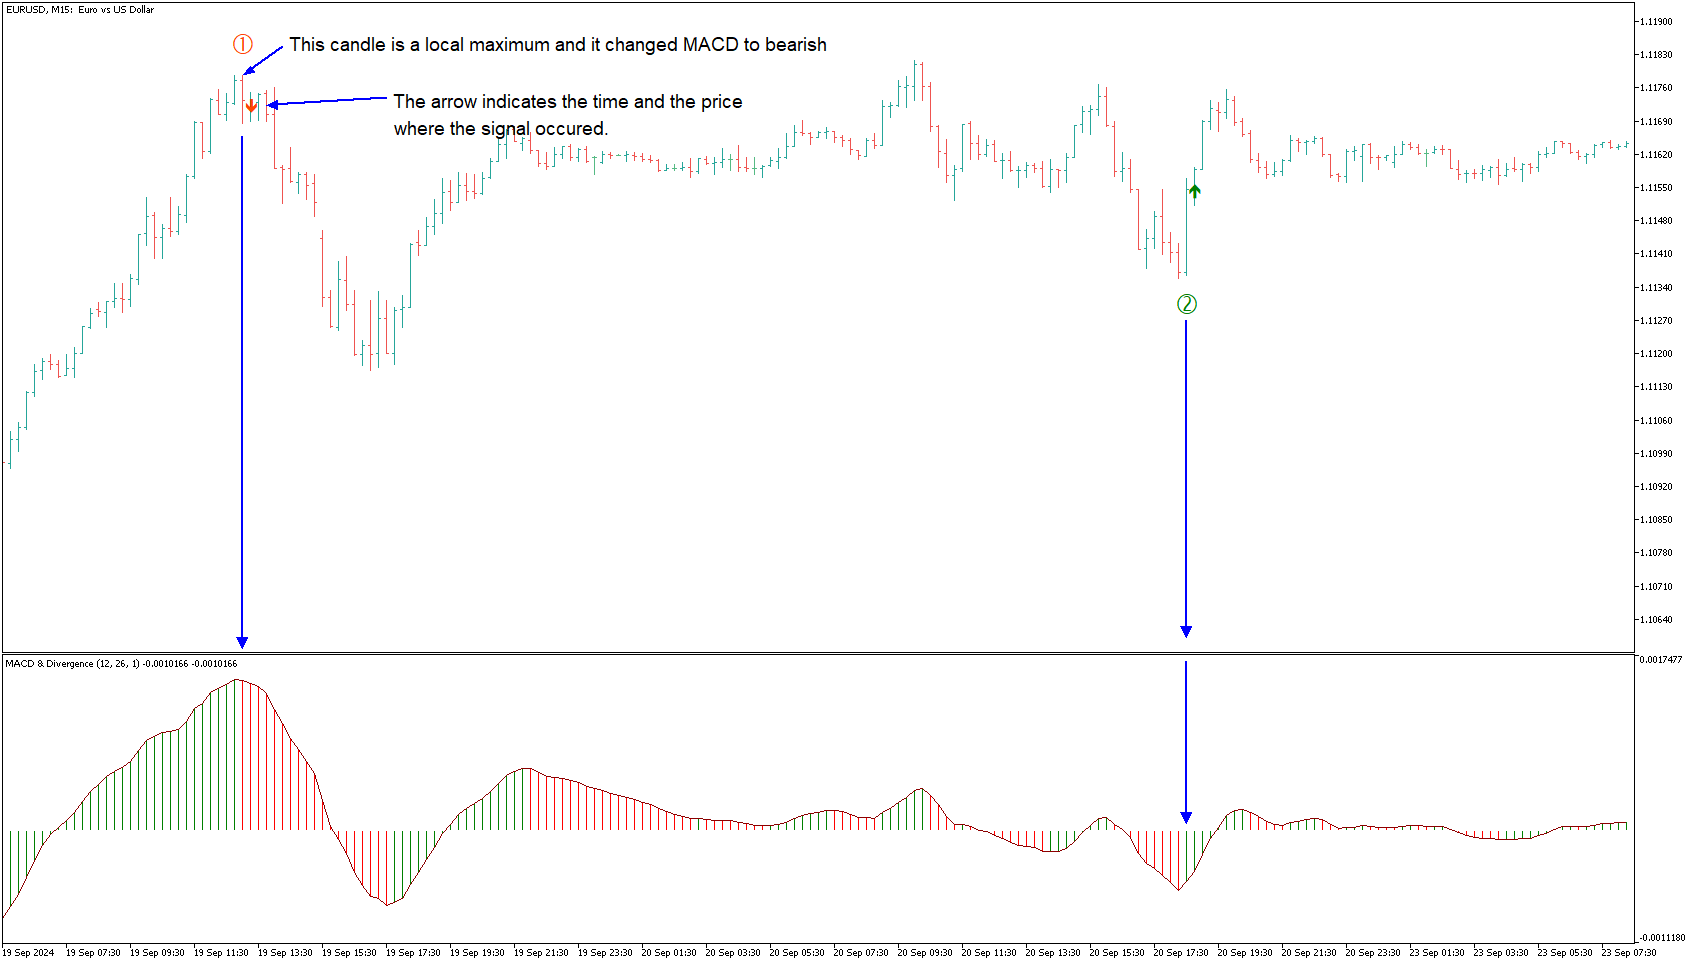
"The First Red" göstergesi, Dariusz Dargo tarafından oluşturulan stratejiye dayalı olarak geliştirilmiştir. Bu gösterge, "The First Red" stratejisi ve "Second Red," "First Green" ve "Second Green" gibi genişletme koşullarını karşılayan mumları grafik üzerinde belirlemek ve işaretlemek için tasarlanmıştır. Strateji, yerel aşırılıkların ve MACD osilatöründen gelen sinyallerin analizine odaklanır.
-
İlk Kırmızı Mum (First Red Candle): Bir mum, yerel bir maksimum oluşturduğunda ve MACD histogramı düşüş yönüne geçtiğinde "First Red" olarak işaretlenir. Grafik sembolü: Mumun üzerinde kırmızı aşağı ok.
-
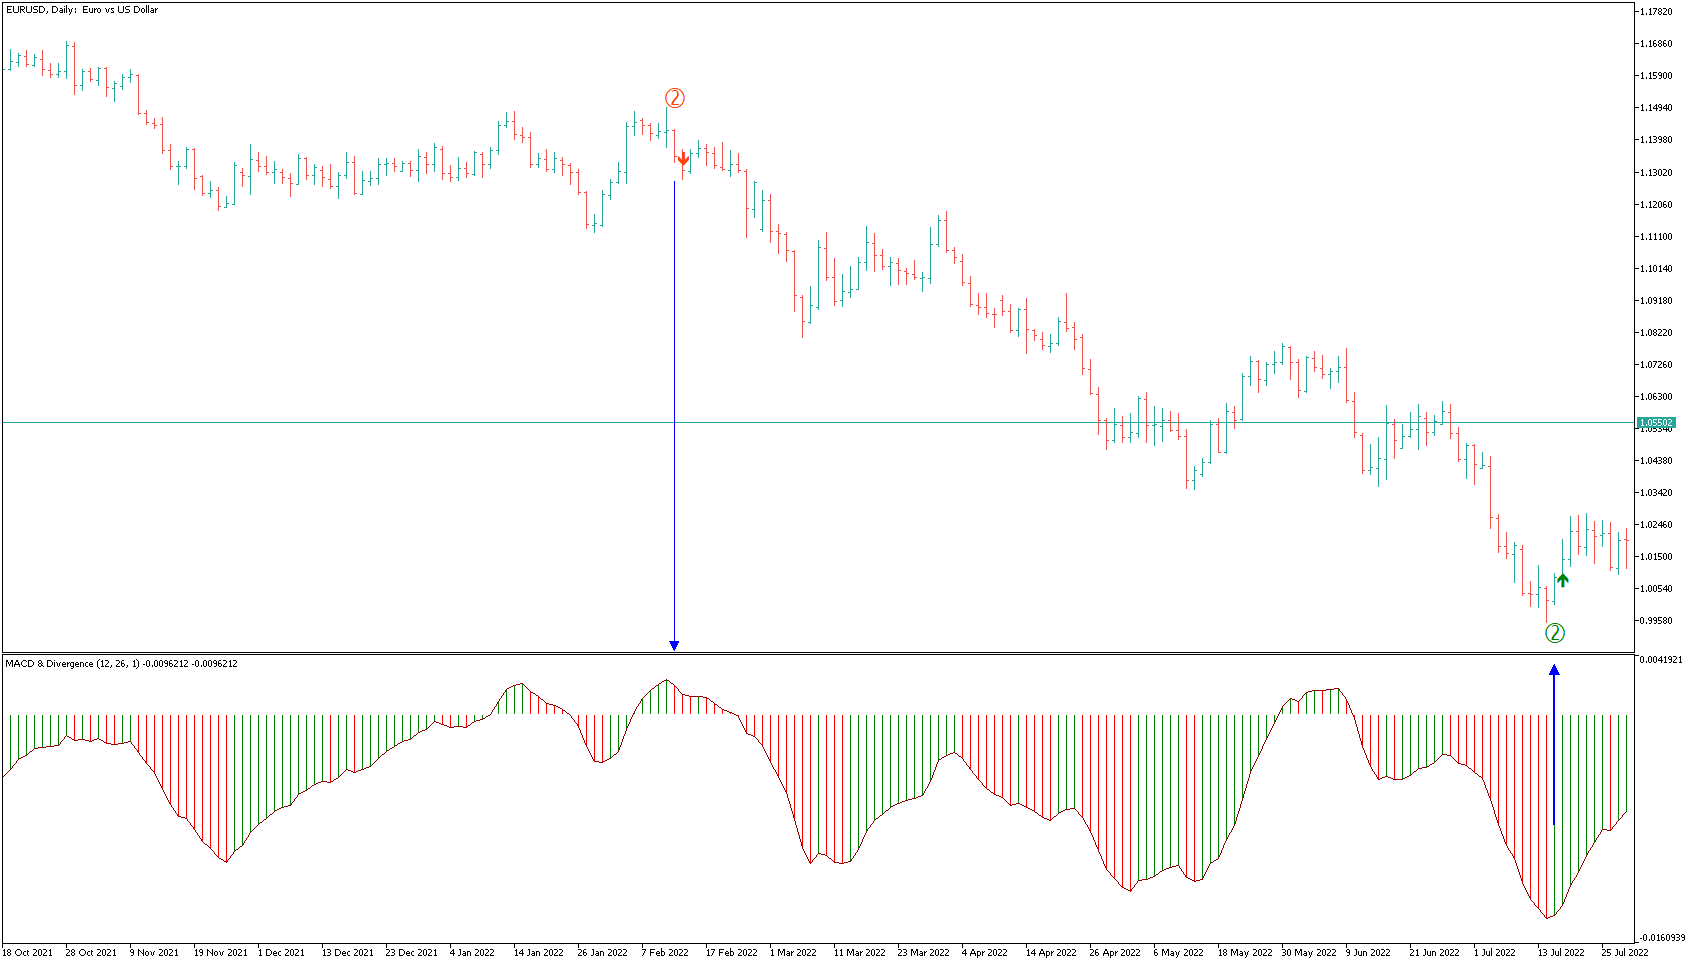
İkinci Kırmızı Mum (Second Red Candle): "First Red"den sonra gelen ikinci düşüş mumu, yön değişikliğini doğrular. Grafik sembolü: Mumun üzerinde kırmızı "2" numarası.
-
İlk Yeşil Mum (First Green Candle): Bir mum, yerel bir minimum oluşturduğunda ve MACD histogramı yükseliş yönüne geçtiğinde "First Green" olarak işaretlenir. Grafik sembolü: Mumun altında yeşil yukarı ok.
-
İkinci Yeşil Mum (Second Green Candle): "First Green"den sonra gelen ikinci yükseliş mumu, yön değişikliğini doğrular. Grafik sembolü: Mumun altında yeşil "2" numarası.
Gösterge Özellikleri:
- Mumların grafikte görsel olarak işaretlenmesi.
- Momentum değişikliklerini doğru bir şekilde tespit etmek için MACD osilatörü ile entegrasyon.
- Kolay yorumlama için özelleştirilebilir renkler ve semboller.
Amaç: Gösterge, dinamik dönüş noktaları ve hassas piyasa giriş sinyalleri arayan yatırımcılara yöneliktir ve hem standart mum grafiklerinde hem de Range Bar grafiklerinde etkili bir şekilde kullanılabilir.