MT5 Macd Divergence Scanner

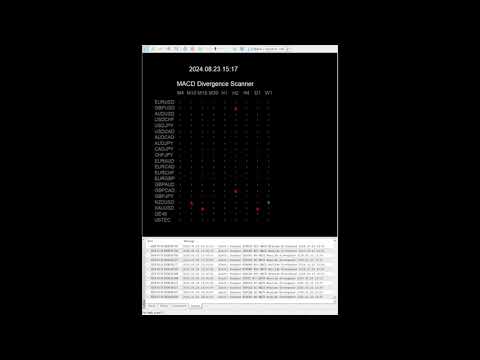
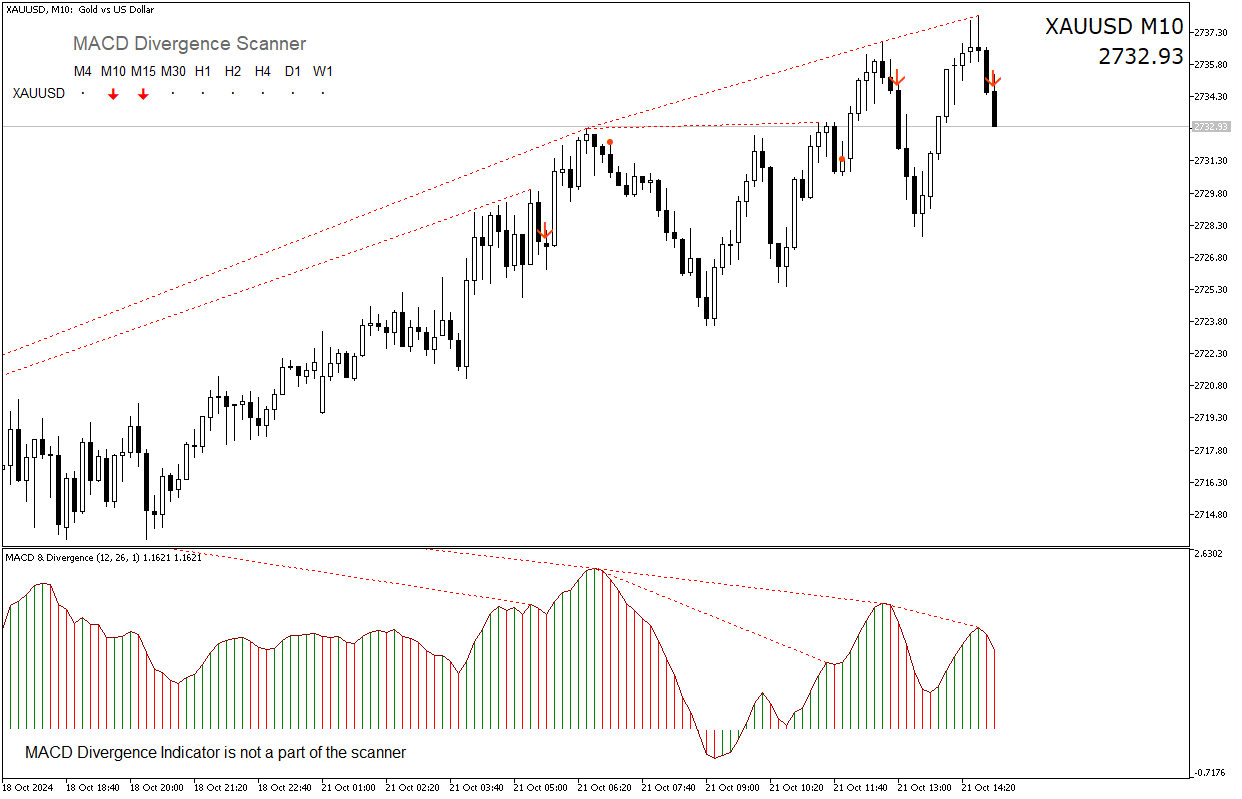
This indicator helps you monitor multiple currency pairs and timeframes all at once. It displays the occurrence of divergences between price and the MACD indicator in a clear and easy-to-read table. Monitoring multiple timeframes and currency pairs in one place helps traders identify a divergence without needing to switch between charts. Divergences can be bullish or bearish. For example, if the price forms a higher high while the MACD forms a lower high, this indicates bearish divergence. On the other hand, if the price forms a lower low while the MACD forms a higher low, this indicates bullish divergence.

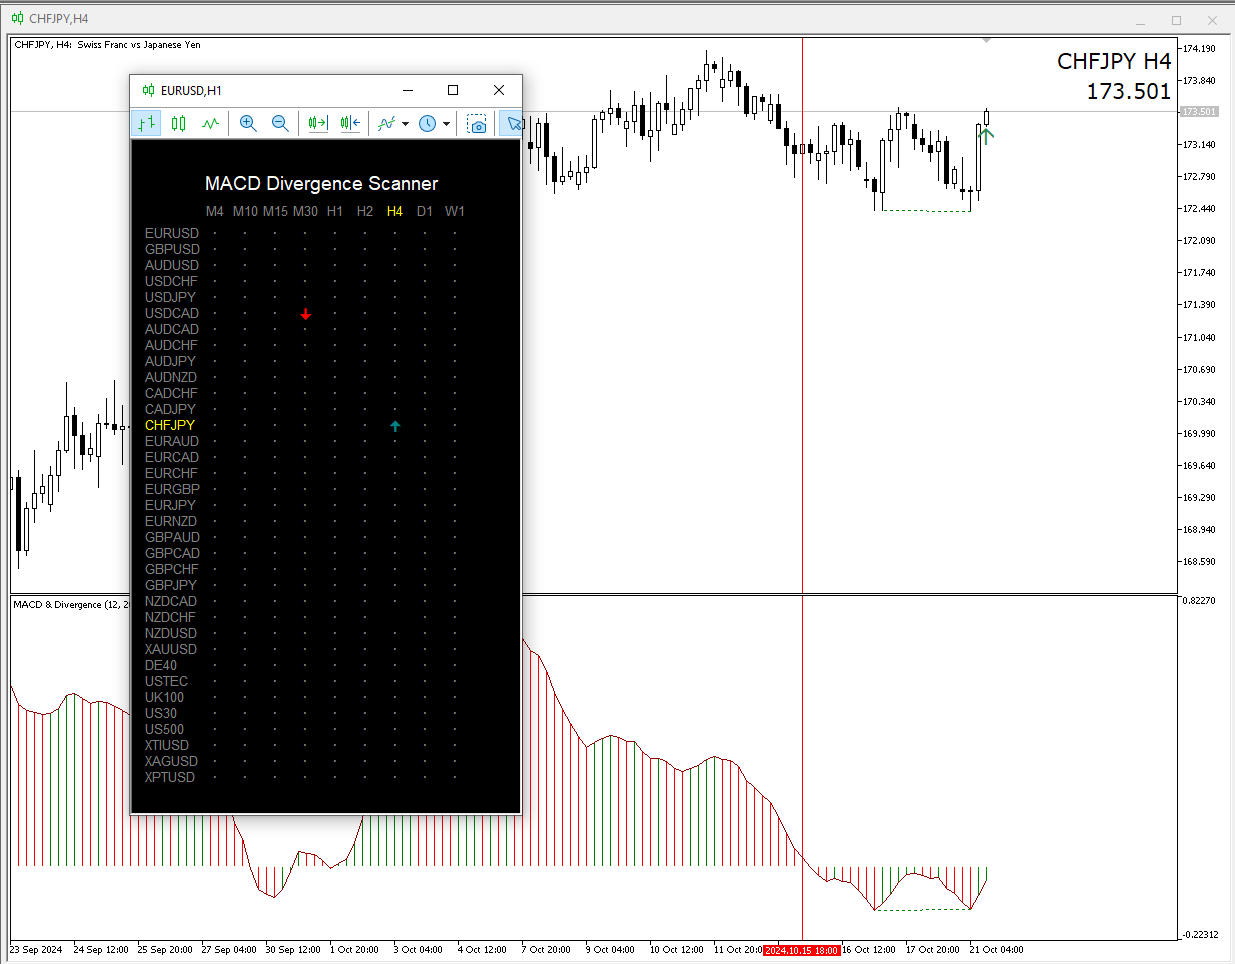
Each symbol (such as EURUSD, GBPUSD) is listed in the table on the left, while different timeframes (like M5, H1, D1) are shown across the top.  The dots in the table indicate that no divergence is detected.  If an arrow appears, it suggests a signal based on a divergence. Arrows help traders easily identify key moments when the market may be changing direction. A red arrow indicates a potential sell, while a green arrow suggests a potential buy. The appearance of an arrow is accompanied by an alert being sent to the terminal. Any potential trade should be supported by additional conditions, such as conducting higher timeframe analysis, using moving averages, or identifying support and resistance levels.

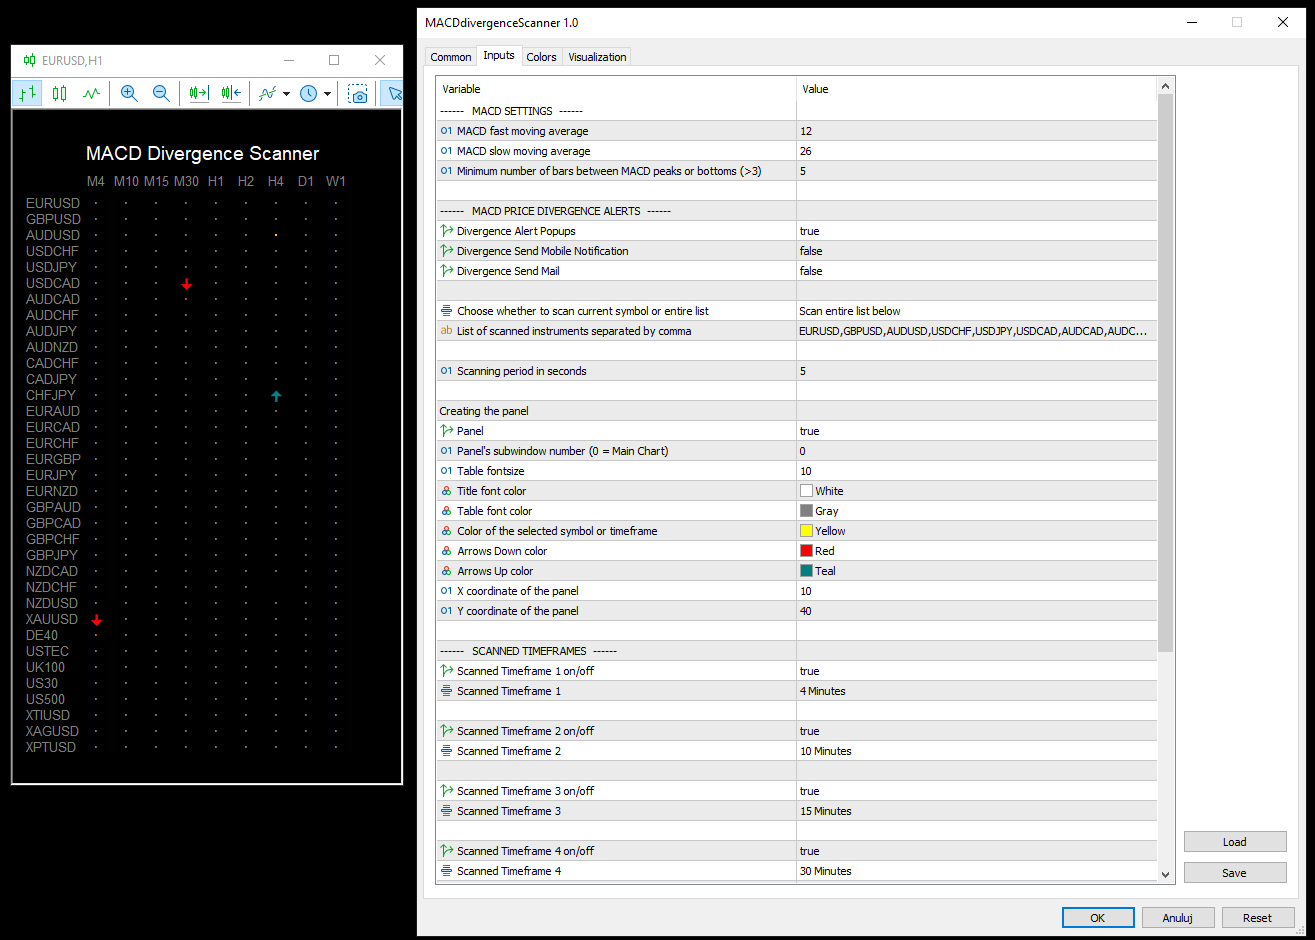
The indicator can be used in two modes: one that scans only the chart instrument, and another that scans a list of symbols. The user provides the list in a menu by separating each symbol name with a comma, without spaces. In the latter case, it is best to use a separate window that can be detached from the main MT5 window.

The indicator was successfully tested on 35 instruments and 9 timeframes.


Önerilen ürünler
FXC iMACD-DivergencE MT5 Indicator This is an advanced MACD indicator that finds trend-turn divergences on the current symbol. The indicator detects divergence between the MACD and the price movements as a strong trend-turn pattern. Main features: Advanced divergence settings Price based on Close, Open or High/Low prices Give Buy/Sell open signals PUSH notifications E-mail sending Pop-up alert Customizeable Information panel Input parameters: MACD Fast-EMA: The Fast-EMA variable of the MACD indi
FXC iDeM-DivergencE MT5 Indicator This is an advanced DeMarker indicator that finds trend-turn divergences on the current symbol. The indicator detects divergence between the DeMarker and the price movements as a strong trend-turn pattern. Main features: Advanced divergence settings Price based on Close, Open or High/Low prices Give Buy/Sell open signals PUSH notifications E-mail sending Pop-up alert Customizeable Information panel Input parameters: DeM Period: The Period size of the DeMarker in
MFI Divergence for MetaTrader 5 MFI Divergence is a practical and easy-to-use MT5 indicator that detects regular and hidden divergences using the Money Flow Index (MFI) . It is built for traders who want a cleaner way to spot possible reversals , continuation setups , and momentum weakness directly from chart structure. The indicator runs in a separate window and automatically analyzes MFI pivot highs and lows against price highs and lows . When divergence conditions are found, it draws cle
MACD Alerts
Matthew Palulis
MACD Crossover with Alerts, Colored Histogram, and Zero Line Arrows Overview The MACD Crossover Indicator is designed to help traders analyze trend direction and momentum shifts. This enhanced version of the classic MACD includes visual crossover markers, dynamic histogram coloring, and real-time alerts, offering a clear and structured approach to market analysis. Histogram color changes based on MACD position (above or below zero). Zero-line arrows for crossover points to highlight key trend
HMA Trend Professional MT5
Pavel Zamoshnikov
4.25 (4)
Improved version of the free HMA Trend indicator (for MetaTrader 4) with statistical analysis. HMA Trend is a trend indicator based on the Hull Moving Average (HMA) with two periods. HMA with a slow period identifies the trend, while HMA with a fast period determines the short-term movements and signals in the trend direction. The main differences from the free version: Ability to predict the probability of a trend reversal using analysis of history data. Plotting statistical charts for analyzi
Stochastic R
Antony Augustine
Stochastic  Reversal  allows you to recognize reversals professionally. Stochastic Indicator: This technical indicator was developed by George Lane more than 50 years ago. The reason why this indicator survived for so many years is because it continues to show consistent signals even in these current times. The Stochastic indicator is a momentum indicator that shows you how strong or weak the current trend is. It helps you identify overbought and oversold market conditions within a trend.  Rules
RBreaker
Zhong Long Wu
RBreaker Gold Indicators is a short-term intraday trading strategy for gold futures that combines trend following and intraday reversal approaches. It not only captures profits during trending markets but also enables timely profit-taking and counter-trend trading during market reversals. This strategy has been ranked among the top ten most profitable trading strategies by the American magazine   Futures Truth   for 15 consecutive years. It boasts a long lifecycle and remains widely used and st
Schaff Trend Cycle STC
Mohammad Taher Halimi Tabrizi
The Schaff Trend Cycle indicator is the product of combining Slow Stochastics and the moving average convergence/divergence (MACD). The MACD has a reputation as a trend indicator, but it's also notorious for lagging due to its slow responsive signal line. The improved signal line gives the STC its relevance as an early warning sign to detect currency trends. this indicator is converted from Trading View code of STC Indicator - A Better MACD [SHK]
Технический индикатор Universal Oscillator является комбинацией торговых сигналов самых популярных и широко используемых осцилляторов. Индикатор представлен гистограммами, а также линиями fast и slow MA, что позволяет расширить список получаемых торговых рекомендаций и работать как по тренду, так и в боковом движении рынка. Таким образом, гистограммы позволяют определить момент пробоя ценовых значений и движение в новой фазе рынка, а линии указывают на зоны перекупленности и перепроданности.  Ос
TRI Visualizer
Yoshimi Mon 三 Ura
TRI Visualizer MT5 – Thermodynamic Market Analysis Overview The TRI (Thermal Range Indicator) Visualizer Enhanced is a rare market analysis indicator that goes beyond conventional technical analysis, applying principles of thermodynamics from physics. It interprets market price fluctuations as “thermodynamic energy,” enabling the highly accurate detection of subtle market changes that are often overlooked. Innovative Mechanisms 1. Dual Calculation Engines Classic TRI Mode Formula: |Close
FXC iRSI-DivergencE MT5 Indicator This is an advanced RSI indicator that finds trend-turn divergences on the current symbol. The indicator detects divergence between the RSI and the price movements as a strong trend-turn pattern. Main features: Advanced divergence settings Price based on Close, Open or High/Low prices Give Buy/Sell open signals PUSH notifications E-mail sending Pop-up alert Customizeable Information panel Input parameters: RSI Period: The Period size of the RSI indicator. RSI Ap
Noize Absorption Index - is the manual trading system that measures the difference of pressure between bears forces and bulls forces. Green line - is a noize free index that showing curent situation. Zero value of index shows totally choppy/flat market.Values above zero level shows how powerfull bullish wave is and values below zero measures bearish forces.Up arrow appears on bearish market when it's ready to reverse, dn arrow appears on weak bullish market, as a result of reverse expectation.
Universal Soul Reaper
Pieter Gerhardus Van Zyl
Universal Soul Reaper is an atmospheric market-flow oscillator designed to interpret price behavior as a cycle of spiritual energy. Instead of reacting to raw price alone, it visualizes the state of the market’s soul —revealing when momentum is awakening, stabilizing, or fading. The indicator operates in a separate window and presents three interwoven entities: the Ectoplasmic Veil , the Spirit Boundary , and the Soul Core . Together, they form a living framework that helps traders sense pressu
This is similar in it's idea as the Binary Advance/Lite indicator, but this is intended to use as a levels indicator, as well as trend reversal and how ranging the market is. It takes several useful indicators and combines them in such a way as to declutter your charts, yet prove even more useful together, than separate. RSI, RVI, DeMarker, MACD are added together then multiplied by ATR and StdDev to reveal multiple factors: How far the price has changed, and as the price slows down and reverses
Volume Profile V6
Andrey Kolesnik
4.67 (3)
Piyasa Hacim Profili Göstergesi + Akıllı Osilatör. Döviz çiftleri, hisse senetleri, vadeli işlemler, kripto paralar gibi hemen hemen tüm enstrümanlarda hem gerçek hacimler hem de tick hacimleri üzerinde çalışır. Profil oluşturma aralığını otomatik olarak (örneğin bir haftalık veya bir aylık vb.) belirleyebileceğiniz gibi, sınırları (kırmızı ve mavi iki dikey çizgi) hareket ettirerek aralığı manuel olarak da ayarlayabilirsiniz. Histogram şeklinde görüntülenir. Belirli bir seviyedeki histogram gen
Macd's main chart indicator 1. You can determine the price at which the MACD will change from buy to sell, and vice versa. It is the cousin of the oscillator predictor. If you know a position at the time, then the exact price, current and next (future) columns will need to reach the MACD crossover. You can also see how far the market has to go before your current position is helped or blocked by the next MACD crossover force. You can do this in all time frames because the predictor is updated i
Crea i tuoi EA di trading ad alta frequenza con Quantum Flash Abbiamo tutti sentito parlare di costruttori e generatori nel trading, ma hai mai provato Quantum Flash? È un generatore rivoluzionario che ti aiuta a creare i tuoi Expert Advisor (EA) di trading ad alta frequenza (HFT) con il codice sorgente completo! Come funziona Quantum Flash? Quantum Flash utilizza un algoritmo intelligente che impiega la generazione casuale per creare il tuo EA HFT. Mentre alcuni generatori si concentrano solo
Wolfe Wave Scanner MT5
Reza Aghajanpour
5 (7)
**  All Symbols  x  All Timeframes  scan just by pressing scanner button ** *** Contact me  to send you instruction and add you in "Wolfe Wave Scanner group" for sharing or seeing experiences with other users. Introduction: A Wolfe Wave is created with five-wave patterns in price. It shows supply and demand and a fight towards a balance price. T hese waves of price actions can help traders identify the boundaries of   the trend . Also  It helps forecast how the price will move in the near futur
This indicator is designed to detect the best divergences between price/MACD and price/RSI. MACD and RSI produce by far the best divergence signals therefore this indicator focus on those two divergences. This indicator scans for you up to 15 instruments and up to 21 timeframes for bullish and bearish divergences. You need to add the indicator only to one single chart ! The indicator will then automatically scan all configured instruments and timeframes. Important Information The indicator che
MACD Pro Master
Itumeleng Mohlouwa Kgotso Tladi
MACD Pro Master The MACD Pro Master is your ultimate trading companion, designed to revolutionize your financial journey and unlock the doors to wealth. Here's why it's the next best thing since sliced bread: Advantages Precision Trading : The MACD Pro Master leverages the powerful Moving Average Convergence Divergence (MACD) indicator to provide accurate buy and sell trades,  ensuring you capitalize on every market opportunity. Customizable Settings : Tailor the trading strategy to your unique
The Optimized MACD Divergence indicator is a powerful tool designed to identify potential trading opportunities by detecting divergences between price action and the MACD indicator. It combines classic divergence analysis with candlestick pattern recognition and volume filtering to provide more accurate and reliable signals. How it Works The indicator operates on the following principles: MACD Calculation:   It calculates the MACD indicator using user-defined parameters for fast EMA, slow EMA,
Cvd Divergence
Thalles Nascimento De Carvalho
CVD Divergence – Profesyonel Emir Akışı ve Diverjans Analizi CVD Divergence, fiyat ile Kümülatif Delta Hacmi (CVD) arasındaki güvenilir uyumsuzlukları tespit etmek için tasarlanmış teknik bir göstergedir. Gerçek emir akışının fiyat hareketini doğrulamadığı anları yüksek hassasiyetle belirleyerek olası dönüşleri, momentum zayıflamasını ve kurumsal manipülasyonları ortaya çıkarır. Gösterge, agresif hacim analizini fiyat yapısıyla birleştirerek net, objektif ve erken sinyaller sağlar. Göstergenin Ö
# DRAWDOWN INDICATOR V4.0 - The Essential Tool to Master Your Trading ## Transform Your Trading with a Complete Real-Time Performance Overview In the demanding world of Forex and CFD trading, **knowing your real-time performance** isn't a luxury—it's an **absolute necessity**. The **Drawdown Indicator V4.0** is much more than a simple indicator: it's your **professional dashboard** that gives you a clear, precise, and instant view of your trading account status. --- ## Why This Indicator
Stochastic Divergen MT5
Komang Putra Riswanjaya
2 (1)
Overview The Stochastic Divergence Indicator is a tool designed to help identify potential market turning points by analyzing divergences between price and the Stochastic Oscillator. It highlights divergence signals visually on the chart, assisting traders in observing possible trend changes. Key Features No Repaint: Once a signal is formed, it remains on the chart. Adjustable Parameters: Settings can be modified to fit different trading preferences and timeframes. Visual Display: Arrows are plo
Bu gösterge, fiyat ile Hareketli Ortalama Yakınsama Sapması ( MACD ) ve Göreceli Güç Endeksi ( RSI ) teknik göstergeleri arasındaki sapmaları tespit eder. Göstergenin sinyalleri yeniden çizilmez; ok işareti bulunan çubuk kapandıktan sonra giriş sinyali görünür. Sapma şu şekilde tanımlanır: Fiyat grafiği yeni bir zirve yaparsa ve MACD veya RSI değeri önceki seviyenin altında kalırsa, bu düşüş yönlü bir sapmadır. Fiyat grafiği yeni diplere düşerse ve MACD veya RSI değeri önceki seviyelerin üzer
Pro Gold System Indicator
PEDRO JOAQUIM GONCALVES GOMES
ADVANCED FUNCTIONALITIES: Trend Score (0-100) with visual bar Intelligent signals with adjustable strength (1-10) Risk management with automatic TP/SL Audible and visual alerts Price zones with smooth filling Multi-indicator analysis (RSI, ATR, BB, EMAs) DESIGN FEATURES Modern Visual: Smooth and well-spaced lines (EMA with 2-3px width) Vibrant and professional colors (Sky Blue, Orange, Gold) Modern arrows (code 233/234) for buy/sell signals Configurable dark/light theme Adjustable transparency f
Stratos Pali mt5
Michela Russo
4.5 (8)
Stratos Pali Indicator is a revolutionary tool designed to enhance your trading strategy by accurately identifying market trends. This sophisticated indicator uses a unique algorithm to generate a complete histogram, which records when the trend is Long or Short. When a trend reversal occurs, an arrow appears, indicating the new direction of the trend. Important Information Revealed Leave a review and contact me via mql5 message to receive My Top 5 set files for Stratos Pali at no cost ! Down
Advanced Trading Chaos  The main purpose of the indicator is to help the trader detect the signals described by Bill Williams in his books to make a quick and correct trading decision. 1)Bullish/Bearish Reversal Bar(BDB) 2) Divergent Bar(DB) 3) Second Sage Signal — the third consecutive Awesome Oscillator bar  4) Working fractals (Fractals that worked above/below the red forehead  5) Three bar coloring modes 5.1) Coloring of bars according to the AO indicator (Including the squatting bar) 5.2
The Trend Duration Forecast MT5 indicator is designed to estimate the probable lifespan of a bullish or bearish trend. Using a Hull Moving Average (HMA) to detect directional shifts, it tracks the duration of each historical trend and calculates an average to forecast how long the current trend is statistically likely to continue. This allows traders to visualize both real-time trend strength and potential exhaustion zones with exceptional clarity. KEY FEATURES Dynamic Trend Detection:   Utiliz
The indicator identifies divergences between chart and RSI, with the possibility of confirmation by stochastics or MACD. A divergence line with an arrow appears on the chart when divergence is detected after the current candle has expired. There are various filter parameters that increase the accuracy of the signals. To identify a divergence, point A must be set in the RSI, then point B Value must be edited, which sets the difference between point A and point B. The indicator can be used for tim
Bu ürünün alıcıları ayrıca şunları da satın alıyor
ARIPoint
Temirlan Kdyrkhan
ARIPoint is a powerful trading companion designed to generate high-probability entry signals with dynamic TP/SL/DP levels based on volatility. Built-in performance tracking shows win/loss stats, PP1/PP2 hits, and success rates all updated live. Key Features: Buy/Sell signals with adaptive volatility bands Real-time TP/SL/DP levels based on ATR Built-in MA Filter with optional ATR/StdDev volatility Performance stats panel (Success, Profit/Loss, PP1/PP2) Alerts via popup, sound, push, or email Cu
SuperScalp Pro
Van Minh Nguyen
4.57 (21)
SuperScalp Pro – Gelişmiş Çoklu Filtre Scalping Gösterge Sistemi SuperScalp Pro, işlem fırsatlarını belirlemeye yardımcı olmak için klasik Supertrend ile birden fazla akıllı onay filtresini birleştiren gelişmiş bir scalping göstergesidir. M1’den H4’e kadar farklı zaman dilimlerinde verimli şekilde çalışır ve XAUUSD, BTCUSD ile majör Forex pariteleri için optimize edilmiştir. Gösterge, net Al ve Sat sinyalleri sunar ve ATR tabanlı otomatik giriş fiyatı, stop loss ve take profit seviyeleri hesapla
Divergence Bomber
Ihor Otkydach
4.9 (86)
Bu göstergeyi satın alan herkese aşağıdaki ekstra içerikler ücretsiz olarak sunulmaktadır: Her işlemi otomatik olarak yöneten, Stop Loss ve Take Profit seviyelerini ayarlayan ve işlemleri strateji kurallarına göre kapatan özel yardımcı araç: "Bomber Utility" Göstergenin farklı varlıklar üzerinde kullanılmasına yönelik ayar dosyaları (set dosyaları) Bomber Utility için 3 farklı modda kullanım sunan ayar dosyaları: "Minimum Risk", "Dengeli Risk" ve "Bekle-Gör Stratejisi" Bu ticaret stratejisini hı
Entry In The Zone and SMC Multi Timeframe is a real-time 2-in-1 market analysis tool that combines market structure analysis and a No Repaint BUY / SELL signal system into a single indicator, built on Smart Money Concepts (SMC) — a widely adopted framework used by professional traders to understand market structure. This indicator helps you see the market more clearly, make decisions based on structure rather than guesswork, and focus on high-probability zones where price is more likely to react
Quantum TrendPulse
Bogdan Ion Puscasu
5 (23)
SuperTrend   ,   RSI   ve   Stochastic'in   gücünü tek bir kapsamlı göstergede birleştirerek işlem potansiyelinizi en üst düzeye çıkaran nihai işlem aracı olan   Quantum TrendPulse'u   tanıtıyoruz. Hassasiyet ve verimlilik arayan yatırımcılar için tasarlanan bu gösterge, piyasa trendlerini, momentum değişimlerini ve en uygun giriş ve çıkış noktalarını güvenle belirlemenize yardımcı olur. Temel Özellikler: SuperTrend Entegrasyonu:   Güncel piyasa trendlerini kolayca takip edin ve karlılık dalgası
Azimuth Pro
Ottaviano De Cicco
5 (7)
Azimuth Pro V2: Synthetic Fractal Structure and Confirmed Entries for MT5 Overview Azimuth Pro is a multi-level swing structure indicator by Merkava Labs . Four nested swing layers, swing-anchored VWAP, ABC pattern detection, three-timeframe structural filtering, and closed-bar confirmed entries — one chart, one workflow from micro-swings to macro-cycles. This is not a blind signal product. It is a structure-first workflow for traders who care about location, context, and timing. V2 Launch Offe
Gann Made Easy , bay teorisini kullanarak ticaretin en iyi ilkelerine dayanan, profesyonel ve kullanımı kolay bir Forex ticaret sistemidir. WD Gann. Gösterge, Zararı Durdur ve Kâr Al Seviyeleri dahil olmak üzere doğru SATIN AL ve SAT sinyalleri sağlar. PUSH bildirimlerini kullanarak hareket halindeyken bile işlem yapabilirsiniz. Satın alma işleminden sonra, alım satım talimatlarını ve harika ek göstergeleri ücretsiz olarak almak için lütfen benimle iletişime geçin! Muhtemelen Gann ticaret yöntem
Bu indikatörü satın alırsanız, Profesyonel Trade Manager’ımı  + EA ÜCRETSİZ olarak alacaksınız. Öncelikle, bu Ticaret Sistemi'nin Non-Repainting, Non-Redrawing ve Non-Lagging Göstergesi olduğunu vurgulamak önemlidir, bu da hem manuel hem de robot ticareti için ideal hale getirir. Online kurs, kılavuz ve ön ayarları indir. "Smart Trend Trading System MT5", yeni ve deneyimli tüccarlar için özelleştirilmiş kapsamlı bir ticaret çözümüdür. 10'dan fazla premium göstergeyi birleştiriyor ve 7'den fazla
FX Trend MT5 NG
Daniel Stein
5 (4)
FX Trend NG: Yeni Nesil Çoklu Piyasa Trend Zekâsı Genel Bakış FX Trend NG , çoklu zaman dilimlerinde çalışan profesyonel bir trend analiz ve piyasa izleme aracıdır. Piyasanın yapısını saniyeler içinde anlamanızı sağlar. Birden fazla grafik arasında geçiş yapmak yerine, hangi enstrümanların trendde olduğunu, momentumun nerede zayıfladığını ve hangi zaman dilimlerinin uyumlu olduğunu anında görebilirsiniz. Lansman Teklifi – FX Trend NG sadece $30 (6 Ay) veya $80 Ömür Boyu Lisans ile edinin. Zate
Trend Screener Pro MT5
STE S.S.COMPANY
4.85 (104)
Trend Göstergesi, Trend Alım Satım ve Filtreleme için Çığır Açan Benzersiz Çözüm, Tüm Önemli Trend Özellikleriyle Tek Bir Araç İçinde Yerleştirildi! Forex, emtialar, kripto para birimleri, endeksler ve hisse senetleri gibi tüm sembollerde/araçlarda kullanılabilen %100 yeniden boyamayan çoklu zaman çerçevesi ve Çoklu para birimi göstergesidir. Trend Screener, grafikte noktalarla ok trend sinyalleri sağlayan etkili bir trend trend göstergesidir. Trend analizörü göstergesinde bulunan özellikler: 1.
Grabber System MT5
Ihor Otkydach
4.83 (23)
Size mükemmel bir teknik gösterge olan Grabber’ı tanıtıyorum. Bu araç, kullanıma hazır bir “her şey dahil” işlem stratejisi olarak çalışır. Tek bir yazılım kodu içinde güçlü piyasa teknik analiz araçları, işlem sinyalleri (oklar), uyarı işlevleri ve push bildirimleri entegre edilmiştir. Bu göstergeyi satın alan herkes aşağıdaki hediyeleri ücretsiz olarak alır: Açık emirleri otomatik yönetmek için Grabber Yardımcı Aracı Kurulum, yapılandırma ve nasıl işlem yapılacağını adım adım anlatan video kıl
Meravith MT5
Ivan Stefanov
5 (1)
Göstergе, herhangi bir noktadan hacmi analiz eder ve bu hacim için piyasanın tükeniş seviyelerini hesaplar. Meravith’in ana çizgileri: Boğa hacim tükeniş çizgisi – hedef olarak kullanılır. Ayı hacim tükeniş çizgisi – hedef olarak kullanılır. Trend çizgisi – piyasa trendini gösterir. Piyasanın boğa mı ayı mı olduğuna bağlı olarak rengi değişir ve trend desteği görevi görür. Nasıl kullanılır: Mor dikey çizgiye çift tıklayın ve istediğiniz konuma taşıyın. Her şeyi analiz edebilirsiniz – trendleri v
CGE Trading Suite
Carl Gustav Johan Ekstrom
5 (2)
Institutional-Grade Analytics for MT5 C GE Trading Suite delivers the analytical edge typically reserved for professional trading desks. The platform integrates a full suite of analytical tools into one seamless workflow: dynamic grid mapping, liquidity behavior analysis, ECM, trend lines, MIDAS, trade cycles, and directional channel projections. Together, these provide a unified view of market structure and momentum. Directional clarity is further enhanced by the capital flow index, which meas
SignalTech MT5 is a trading system for EURUSD, USDCHF, USDJPY, AUDUSD, NZDUSD, EURJPY, AUDJPY, NZDJPY, CADJPY H2 and H3 Timeframe.  It can generate signals with Buy/Sell Arrows and Pop-Up/Sound Alerts. Each signal has clear Entry and Stop Loss levels, which should be automatically flagged on the chart, as well as potential Targets 1, 2, and 3. The Entry and TP levels are fixed after the trade is taken. The exit level is dynamic. If there are signs of a potential short-term trend reversal, the
Hangi stratejinin sizin sembolunuzde gercekten calistigini gorun - gercek paranizi riske atmadan once. Power Bar, herhangi bir sembol ve herhangi bir zaman diliminde asiri fiyat barlarini tespit eder, ardindan 3 farkli islem stratejisini aninda geriye donuk test eder. Boylece kazanma oranlarini, kar faktorlerini ve P&L'yi yan yana karsilastirabilirsiniz. Tek bir interaktif panelde. Tahmin yok. Esriye uydurma yok. Sadece veri. Power Bar'i benzersiz yapan nedir? Cogu indikator size bir sinyal ver
FX Power MT5 NG
Daniel Stein
5 (31)
FX Power: Daha Akıllı Ticaret Kararları için Para Birimlerinin Gücünü Analiz Edin Genel Bakış FX Power , her piyasa koşulunda başlıca para birimlerinin ve altının gerçek gücünü anlamak için vazgeçilmez bir araçtır. Güçlü para birimlerini alıp zayıf olanları satarak, FX Power ticaret kararlarınızı basitleştirir ve yüksek olasılıklı fırsatları ortaya çıkarır. İster trendlere sadık kalın ister Delta'nın aşırı değerlerini kullanarak tersine dönüşleri öngörün, bu araç ticaret tarzınıza mükemmel bir
Atomic Analyst MT5
Issam Kassas
3.94 (31)
Öncelikle belirtmek gerekir ki bu Ticaret Göstergesi Yeniden Çizim Yapmaz, Gecikmez ve Gecikme Göstermez, bu da hem manuel hem de robot ticareti için ideal hale getirir. Kullanıcı kılavuzu: ayarlar, girişler ve strateji. Atom Analisti, Piyasada Daha İyi Bir Avantaj Bulmak İçin Fiyatın Gücünü ve Momentumunu Kullanan PA Fiyat Hareketi Göstergesidir. Gürültüleri ve Yanlış Sinyalleri Kaldırmaya ve Ticaret Potansiyelini Artırmaya Yardımcı Olan Gelişmiş Filtrelerle Donatılmıştır. Birden fazla katmanl
OmniSync Projection
Antonio-alin Teculescu
5 (1)
Chronos Fractal Engine is an innovative price projection indicator for MetaTrader 5, designed to transform your technical analysis by intelligently identifying and projecting historical price patterns. Built upon an advanced correlation algorithm and the fractal principles of the market, this powerful tool visualizes potential future price movements, giving you a unique edge in your trading decisions. What is Chronos Fractal Engine? At its core, the Chronos Fractal Engine employs a sophisticat
Tanıtım       Quantum Breakout PRO   , Breakout Bölgeleri ile ticaret yapma şeklinizi değiştiren çığır açan MQL5 Göstergesi! 13 yılı aşkın ticaret tecrübesine sahip deneyimli tüccarlardan oluşan bir ekip tarafından geliştirilmiştir.       Kuantum Breakout PRO       yenilikçi ve dinamik koparma bölgesi stratejisiyle ticaret yolculuğunuzu yeni zirvelere taşımak için tasarlanmıştır. Kuantum Breakout Göstergesi, size 5 kar hedefi bölgesi ile kırılma bölgelerinde sinyal okları ve kırılma kutusuna da
Bill Williams Advanced
Siarhei Vashchylka
5 (11)
Bill Williams Advanced is designed for automatic chart analysis using Bill Williams' "Profitunity" system. The indicator analyzes four timeframes at once. Manual (Be sure to read before purchasing) Advantages 1. Analyzes the chart using Bill Williams' "Profitunity" system. Signals are displayed in a table in the corner of the screen and on the price chart. 2. Finds all known AO and AC signals, as well as zone signals. Equipped with a trend filter based on the Alligator. 3. Finds "Divergence Bar
Berma Bands
Muhammad Elbermawi
5 (8)
Berma Bantları (BB'ler) göstergesi, piyasa trendlerini belirlemeyi ve bunlardan yararlanmayı amaçlayan yatırımcılar için değerli bir araçtır. Fiyat ile BB'ler arasındaki ilişkiyi analiz ederek, yatırımcılar bir piyasanın trend veya aralıklı fazda olup olmadığını ayırt edebilir. Daha fazla bilgi edinmek için [ Berma Home Blog ] adresini ziyaret edin. Berma Bantları üç belirgin çizgiden oluşur: Üst Berma Bandı, Orta Berma Bandı ve Alt Berma Bandı. Bu çizgiler fiyatın etrafına çizilir ve genel tren
Btmm state engine pro
Garry James Goodchild
5 (4)
BTMM State Engine Pro is a MetaTrader 5 indicator for traders who use the Beat The Market Maker approach: Asian session context, kill zone timing, level progression, peak formation detection, and a multi-pair scanner from a single chart. It combines cycle state logic with a built-in scanner dashboard so you do not need the same tool on many charts at once. What it does Draws the Asian session range; session times can follow broker server offset or be set in inputs. Tracks level progression (L
Auto Optimized Parabolic RSI: Gelişmiş 3D Momentum Motoru Çoğu perakende indikatörü, piyasa volatilitesi değiştiği an çöken statik girdilere dayandığı için başarısız olur. Auto Optimized Parabolic RSI, kendi matematiksel avantajını sürekli olarak yeniden hesaplayarak "indikatör körelmesi" (indicator decay) sorununu çözer ve kurumsal düzeyde kantitatif adaptasyonu doğrudan MT5 terminalinize getirir. Temel Avantaj: Özel Bellek İçi (In-Memory) 3D Optimizasyon Standart otomatik optimize ediciler, te
Crystal Heikin Ashi Signals
Muhammad Jawad Shabir
5 (2)
Crystal Heikin Ashi Signals - Professional Trend & Signal Detection Indicator Advanced Heikin Ashi Visualization with Intelligent Signal System for Manual & Automated Trading Final Price: $149 ---------> Price goes up $10 after every 10 sales . Limited slots available — act fast . Overview Crystal Heikin Ashi Signals is a professional-grade MetaTrader 5 indicator that combines pure Heikin Ashi candle visualization with an advanced momentum-shift detection system. Designed for both manual traders
Meridian Pro
Ottaviano De Cicco
5 (1)
Meridian Pro: Professional Multi-Timeframe Trend Matrix for MT5 Overview Meridian Pro is a multi-timeframe trend matrix by Merkava Labs that compresses directional state, strength, momentum condition and matrix agreement into one compact panel. One adaptive engine, applied consistently from M1 to W1. No per-symbol tuning. No indicator stacking. One structured readout across every asset and every timeframe. Launch Offer — Get Meridian Pro for USD 99 (introductory). Regular price: USD 149. 1. Why
Top indicator for MT5   providing accurate signals to enter a trade without repainting! It can be applied to any financial assets:   forex, cryptocurrencies, metals, stocks, indices .  Watch  the video  (6:22) with an example of processing only one signal that paid off the indicator! MT4 version is here It will provide pretty accurate trading signals and tell you when it's best to open a trade and close it. Most traders improve their trading results during the first trading week with the help of
ARICoins
Temirlan Kdyrkhan
ARICoin is a powerful trading companion designed to generate high-probability entry signals with dynamic TP/SL/DP levels based on volatility. Built-in performance tracking shows win/loss stats, PP1/PP2 hits, and success rates all updated live. Key Features: Buy/Sell signals with adaptive volatility bands Real-time TP/SL/DP levels based on ATR Built-in MA Filter with optional ATR/StdDev volatility Performance stats panel (Success, Profit/Loss, PP1/PP2) Alerts via popup, sound, push, or email Cust
Trend indicator AI mt5
Ramil Minniakhmetov
5 (16)
Trend Ai göstergesi, trend tanımlamasını işlem yapılabilir giriş noktaları ve geri dönüş uyarılarıyla birleştirerek bir yatırımcının piyasa analizini geliştirecek harika bir araçtır. Bu gösterge, kullanıcıların forex piyasasının karmaşıklıklarında güvenle ve hassasiyetle yol almalarını sağlar. Birincil sinyallerin ötesinde, Trend Ai göstergesi geri çekilmeler veya düzeltmeler sırasında ortaya çıkan ikincil giriş noktalarını belirleyerek, yatırımcıların belirlenen trend içindeki fiyat düzeltmele
Gann Kare Göstergesi, W.D. Gann tarafından yazılan "Piyasa Tahminleri için Matematiksel Formül" makalesine dayalı güçlü bir piyasa analizi aracıdır. Bu araç, piyasa analizi için matematiksel ve Gann teorilerini kullanarak hassas analizler gerçekleştirir. 144, 90, 52 karelerini ve ayrıca 9 karesini kullanır. Ayrıca, ın 9 karesi ve bu kareyle ilişkili kanallar ve yıldız modelleri için yöntemini içerir. Kullanıcı Kılavuzu ve Uygulama: Bu göstergeleri kullanmadan önce, kullanıcı kılavuzunu okumanız
Meravith Scanner
Ivan Stefanov
5 (1)
MERAVITH SCANNER, MetaTrader 5 için profesyonel bir finansal piyasa göstergesidir ve birden fazla analiz aracını tek bir entegre sistemde birleştirir. Tüm hesaplamaları, özel hacim ağırlıklı ortalama fiyat (VWAP) metodolojisini kullanarak otomatik olarak gerçekleştirir ve subjektif yorumları tamamen ortadan kaldırır. Bu gösterge, tüm varlık sınıflarında (Forex, Hisseler, Endeksler, Emtialar, Kripto Paralar) ve M1’den Aylık’a kadar tüm zaman dilimlerinde çalışır. Temel prensip, fiyatın hacmi taki
Yazarın diğer ürünleri
Supply Demand Ranger
Krzysztof Janusz Stankiewic
5 (4)
The indicator draws supply and demand zones. The zone timeframe can be set independently of the chart timeframe. For instance, it is possible to set M5 zones on an H4 chart. The importance of zones can be adjusted using the zone strength parameter. Demand zones are displayed if at least one candle in the range of the zone is entirely above the zone. Similarly, supply zones are displayed if at least one candle within the zone is entirely below the zone.
Supply Demand FVG Zones
Krzysztof Janusz Stankiewic
5 (1)
Supply or demand zones refer to price areas where a significant amount of supply or demand had previously entered the market, causing prices to either fall or rise. If the price returns to the demand or supply zone, it is likely to bounce off due to the large number of orders previously placed within the zone. These orders will be defended in these areas. The Fair Value Gap (FVG) is a concept used to identify imbalances in the equilibrium of buying and selling. Fair Value Gaps are formed in a t
Purpose of the Inside Bar and Outside Bar Breakout Scanner Indicator: The Inside Bar & Outside Bar Breakout Scanner  is an advanced dashboard designed to scan multiple instruments and timeframes simultaneously. Its primary function is to identify two powerful candlestick patterns—the  Inside Bar (IB)  and the  Outside Bar (OB) —and then to detect and classify breakouts from these formations. The indicator presents its findings in a clean, organized table, signaling potential trend continuation o
Integrated Dashboard Scanner
Krzysztof Janusz Stankiewic
5 (1)
Integrated Dashboard Scanner – Version 4.00 The Ultimate Market Command Center just got smarter. Now with Programmable Logic Presets. The Integrated Dashboard Scanner (IDS) monitors multiple symbols and timeframes from a single, DPI-aware panel. Version 4.00 introduces a revolutionary Preset Editor , allowing you to combine signals from different modules into complex, custom strategies without writing a single line of code. NEW IN VERSION 4.00: Filter Presets & Logic Editor Stop scanning for
MACD Divergence and TFR for MT5
Krzysztof Janusz Stankiewic
5 (1)
The indicator identifies divergence by analyzing the slopes of lines connecting price and MACD histogram peaks or troughs. Bullish Divergence (Convergence): Occurs when the lines connecting MACD troughs and corresponding price troughs have opposite slopes and are converging. Bearish Divergence: Occurs when the lines connecting MACD peaks and corresponding price peaks have opposite slopes and are diverging. When a divergence signal is detected, the indicator marks the chart with dots at the pric
The First Red MT5
Krzysztof Janusz Stankiewic
"The First Red" göstergesi, Dariusz Dargo tarafından oluşturulan stratejiye dayalı olarak geliştirilmiştir. Bu gösterge, "The First Red" stratejisi ve "Second Red," "First Green" ve "Second Green" gibi genişletme koşullarını karşılayan mumları grafik üzerinde belirlemek ve işaretlemek için tasarlanmıştır. Strateji, yerel aşırılıkların ve MACD osilatöründen gelen sinyallerin analizine odaklanır. İlk Kırmızı Mum (First Red Candle):   Bir mum, yerel bir maksimum oluşturduğunda ve MACD histogramı dü
MACD Divergence and TFR for MT4
Krzysztof Janusz Stankiewic
5 (1)
The indicator identifies divergence by analyzing the slopes of lines connecting price and MACD histogram peaks or troughs. Bullish Divergence (Convergence): Occurs when the lines connecting MACD troughs and corresponding price troughs have opposite slopes and are converging. Bearish Divergence: Occurs when the lines connecting MACD peaks and corresponding price peaks have opposite slopes and are diverging. When a divergence signal is detected, the indicator marks the chart with dots at the pric
Symbol
Krzysztof Janusz Stankiewic
For those who monitor charts from afar, this utility is essential. It displays the chart symbol, time frame, and bid price as text. Users can adjust the text position, color, and font size. It’s also a useful tool for forex video publishers. There will be no more complaints about which symbol and time frame are displayed on the screen, even if the content is viewed on a phone. Symbol prefixes such as “_ecn” or “_stp” can be removed from the displayed symbol.
FREE
Supply Demand FVG
Krzysztof Janusz Stankiewic
3 (2)
The indicator offers a comprehensive suite of features for identifying key market areas, including: Supply Zones Demand Zones Fair Value Gaps (FVG) and provides alerts whenever price reaches a supply or demand zone. Key Features: Historical Zones: In addition to active zones, the indicator now includes historical supply, demand, and FVG zones, allowing for a deeper analysis of past price behavior. Flexible Zone Timeframes: Zones can be plotted independently of the chart's timeframe, enabling sce
MT4 Macd Divergence Scanner
Krzysztof Janusz Stankiewic
Bu gösterge, birden fazla döviz çiftini ve zaman dilimini aynı anda izlemek için verimli bir yöntem sunar. Fiyat ile MACD arasındaki uyumsuzlukları net ve anlaşılır bir tabloda görsel olarak sergileyerek, yatırımcıların grafikler arasında sürekli geçiş yapmak zorunda kalmadan potansiyel piyasa dönüş noktalarını tespit etmelerine imkân tanır. Diverjanslar, yükseliş veya düşüş eğilimi değişimlerini işaret edebilir. Örneğin, fiyat yeni bir zirve yaparken MACD bunu daha yüksek bir zirve ile doğrulam
The First Red MT4
Krzysztof Janusz Stankiewic
"The First Red" göstergesi, Dariusz Dargo tarafından oluşturulan stratejiye dayalı olarak geliştirilmiştir. Bu gösterge, "The First Red" stratejisi ve "Second Red," "First Green" ve "Second Green" gibi genişletme koşullarını karşılayan mumları grafik üzerinde belirlemek ve işaretlemek için tasarlanmıştır. Strateji, yerel aşırılıkların ve MACD osilatöründen gelen sinyallerin analizine odaklanır. İlk Kırmızı Mum (First Red Candle):   Bir mum, yerel bir maksimum oluşturduğunda ve MACD histogramı dü
Filtrele:
Değerlendirme yok
Değerlendirmeye yanıt