The First Red MT4
- インディケータ
- バージョン: 1.0
- アクティベーション: 5
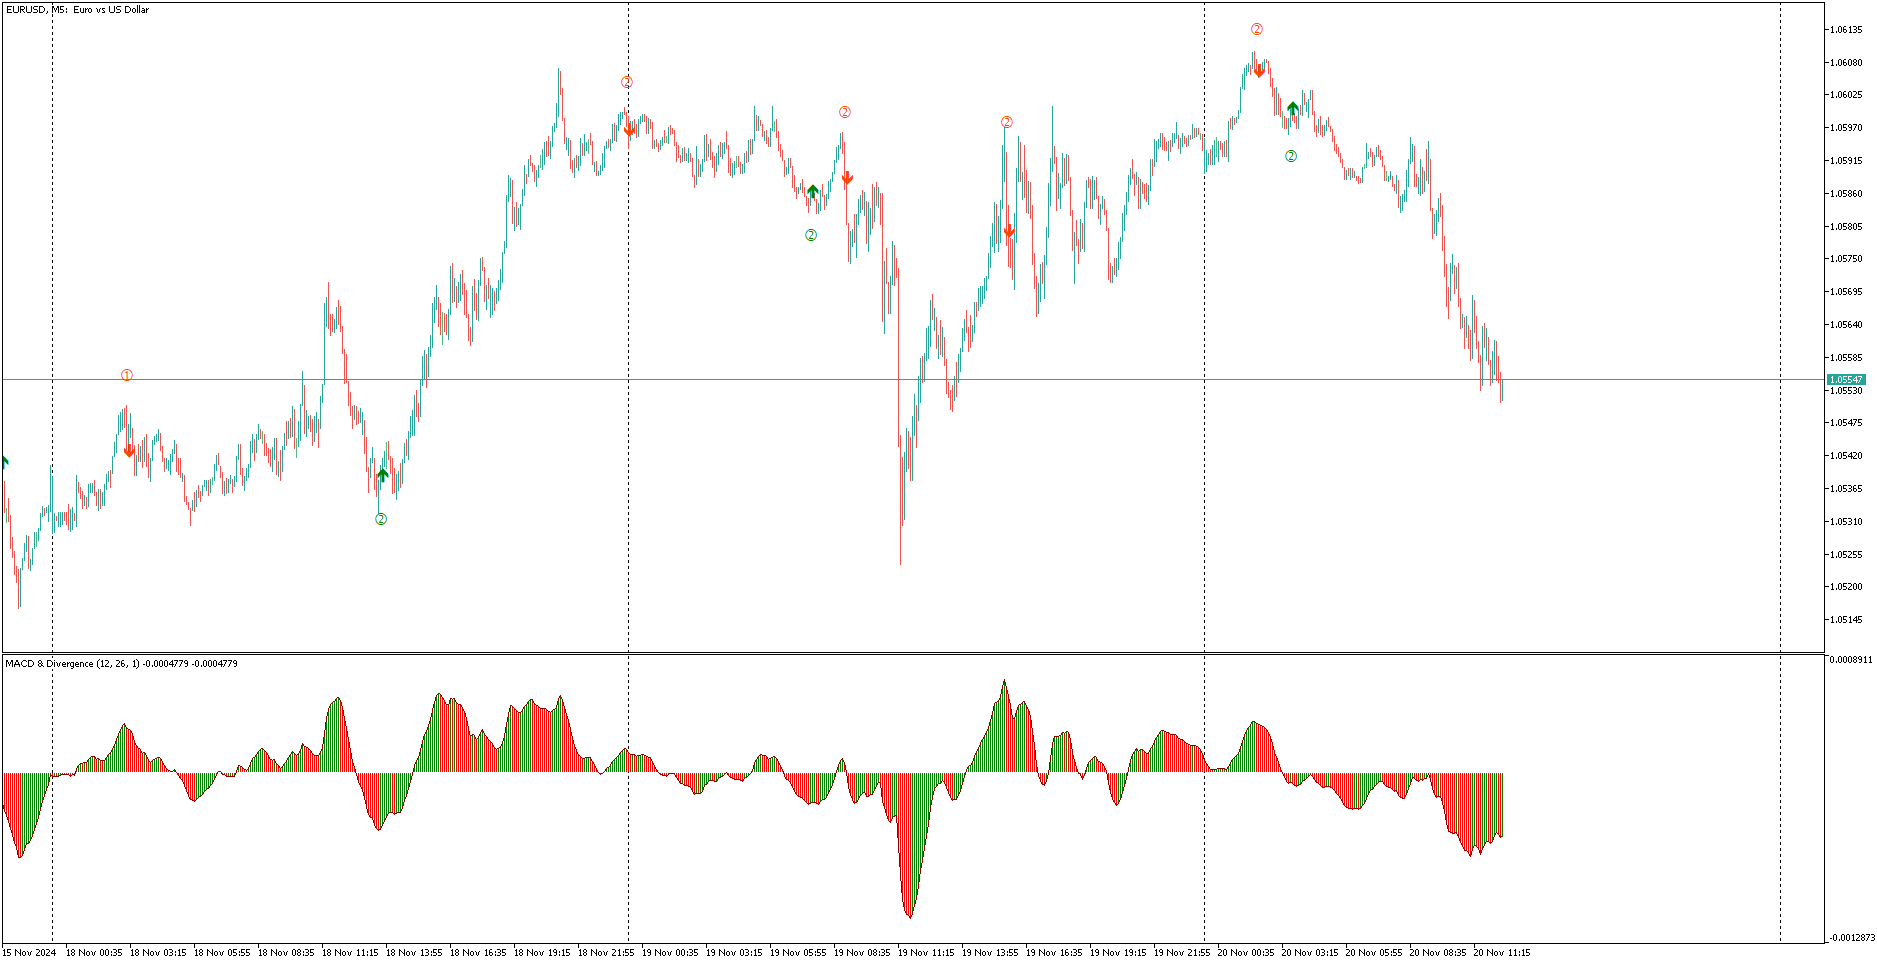
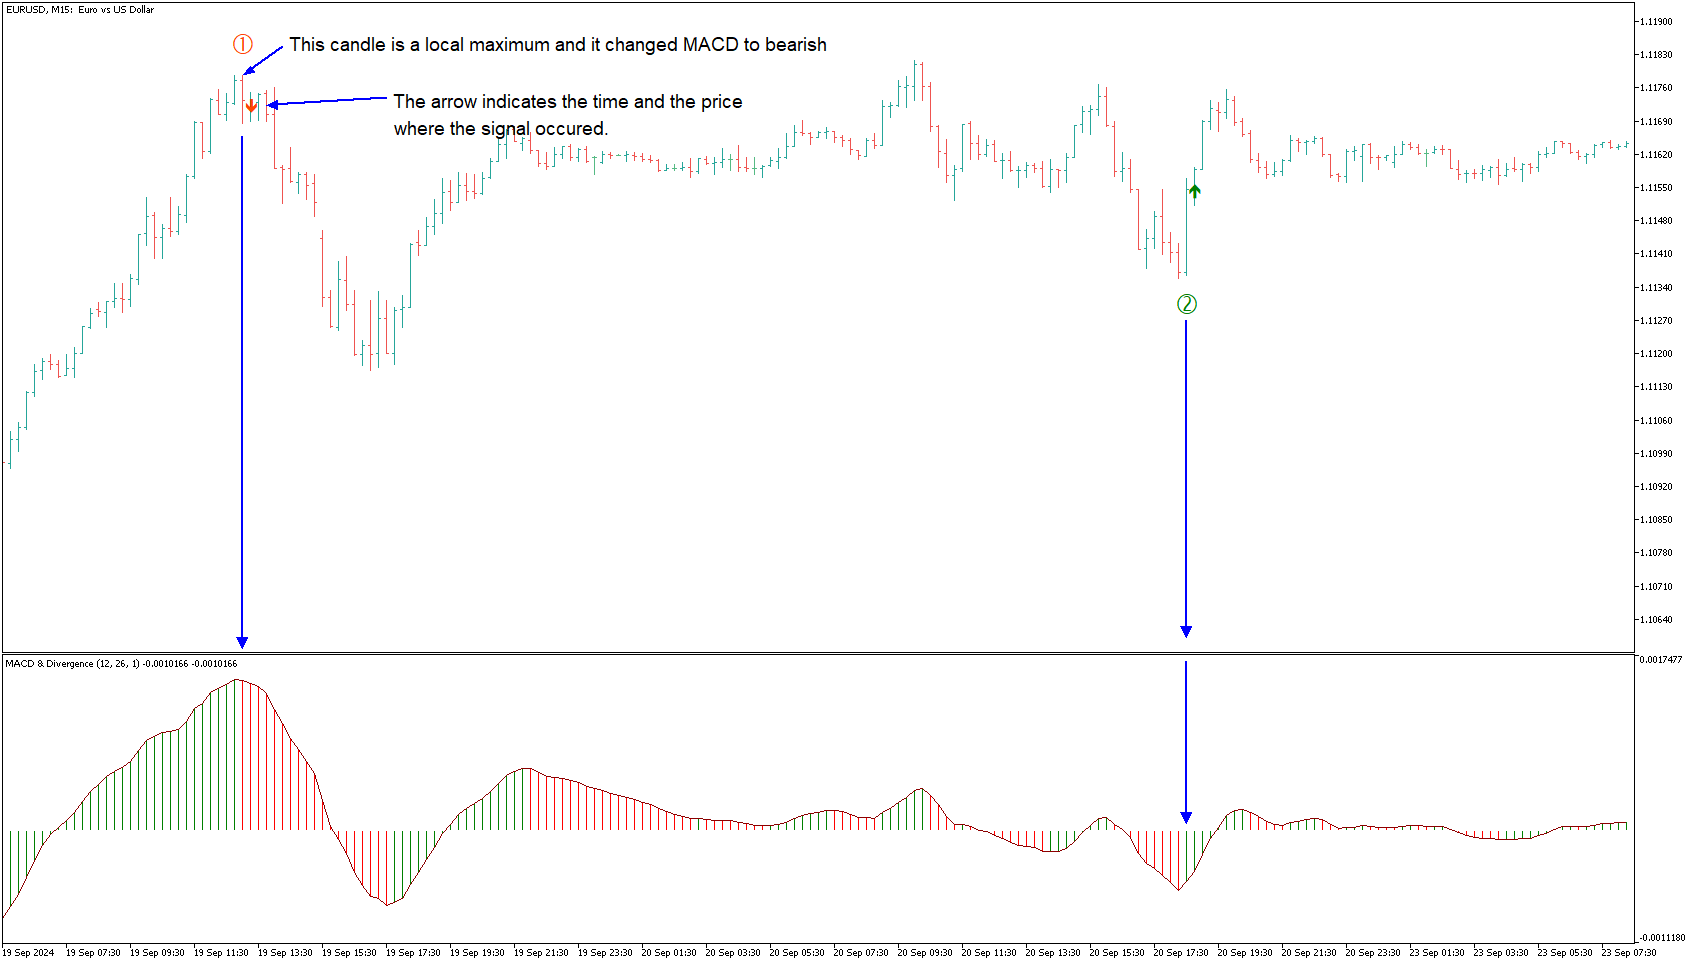
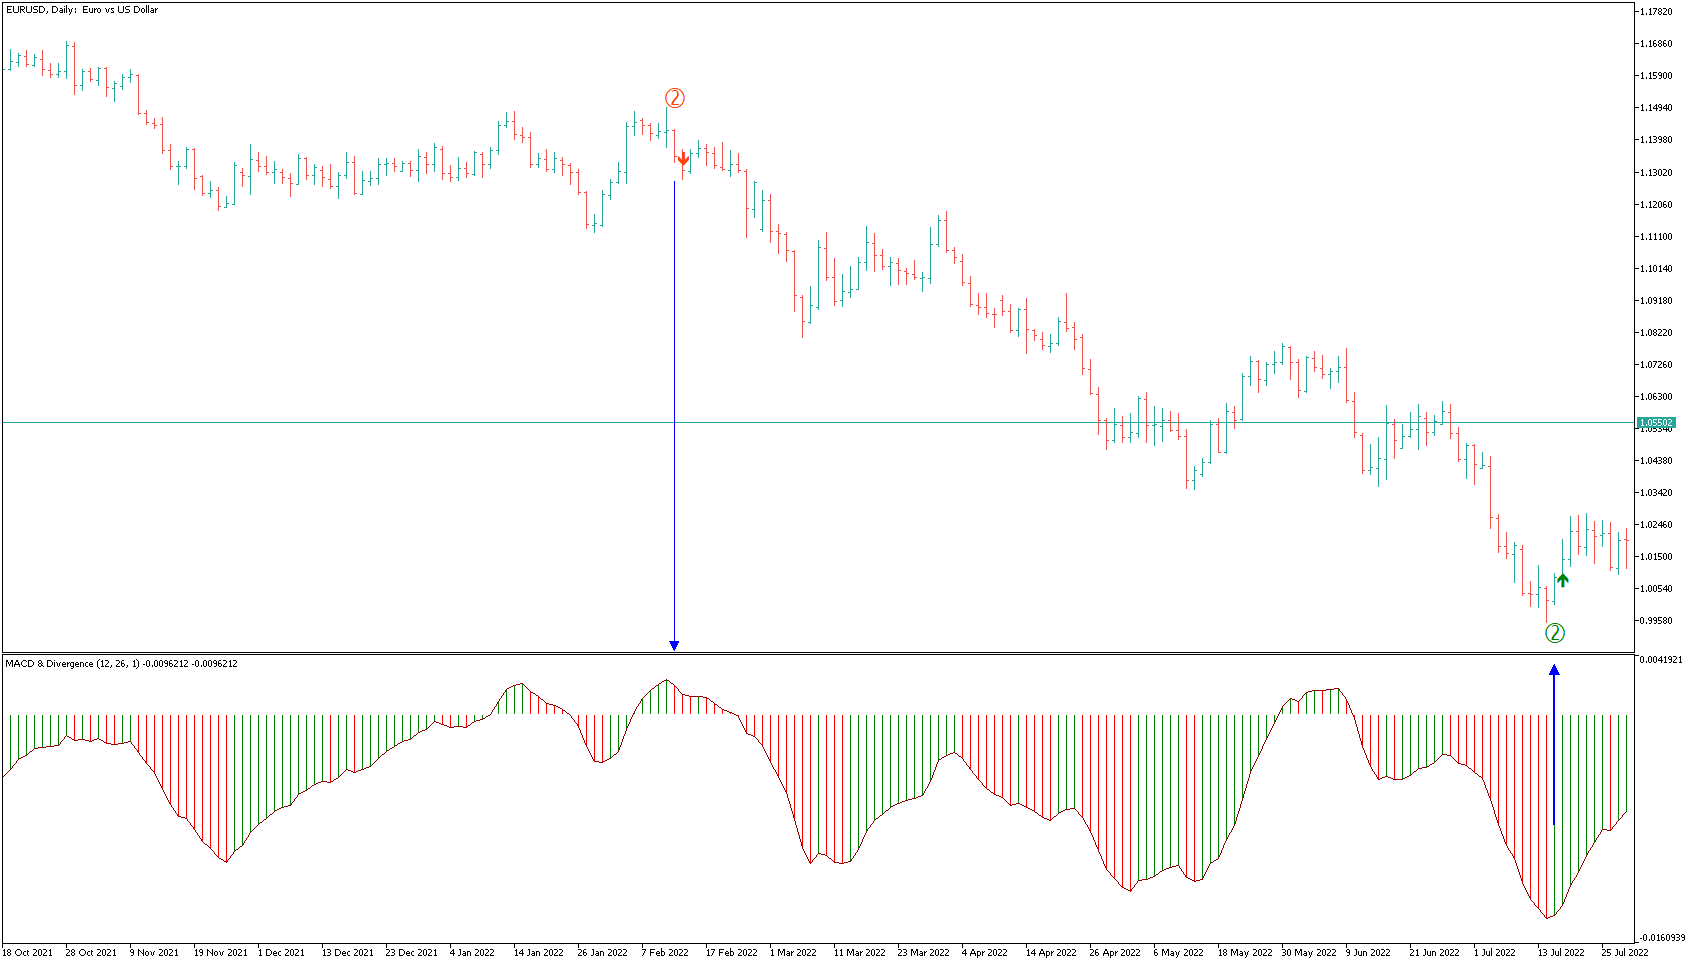
「The First Red」インジケーターは、ダリウシュ・ダルゴ(Dariusz Dargo)が考案した戦略に基づき、「The First Red」戦略および「Second Red」、「First Green」、「Second Green」などの拡張条件を満たすローソク足をチャート上で特定してマークするために設計されています。この戦略は、局所的な極値の分析とMACDオシレーターのシグナルを中心に展開されています。
-
第一の赤いローソク足(First Red Candle): ローソク足が局所的な最高値を形成し、MACDヒストグラムが下降方向に転じたときに「First Red」としてマークされます。 チャート上のシンボル:ローソク足の上に赤い下向きの矢印。
-
第二の赤いローソク足(Second Red Candle): 「First Red」に続く第二の下降ローソク足で、方向転換を確認します。 チャート上のシンボル:ローソク足の上に赤い数字「2」。
-
第一の緑のローソク足(First Green Candle): ローソク足が局所的な最安値を形成し、MACDヒストグラムが上昇方向に転じたときに「First Green」としてマークされます。 チャート上のシンボル:ローソク足の下に緑の上向きの矢印。
-
第二の緑のローソク足(Second Green Candle): 「First Green」に続く第二の上昇ローソク足で、方向転換を確認します。 チャート上のシンボル:ローソク足の下に緑の数字「2」。
インジケーターの特徴:
- チャート上でローソク足を視覚的にマークします。
- MACDオシレーターと統合して、モメンタムの変化を正確に識別します。
- 色やシンボルをカスタマイズ可能で、解釈が容易です。
目的: このインジケーターは、ダイナミックな転換点や正確な市場参入シグナルを求めるトレーダー向けに設計されており、標準のローソク足チャートやレンジバーのチャートで効果的に使用できます。