The First Red MT4
- Indicatori
- Versione: 1.0
- Attivazioni: 5
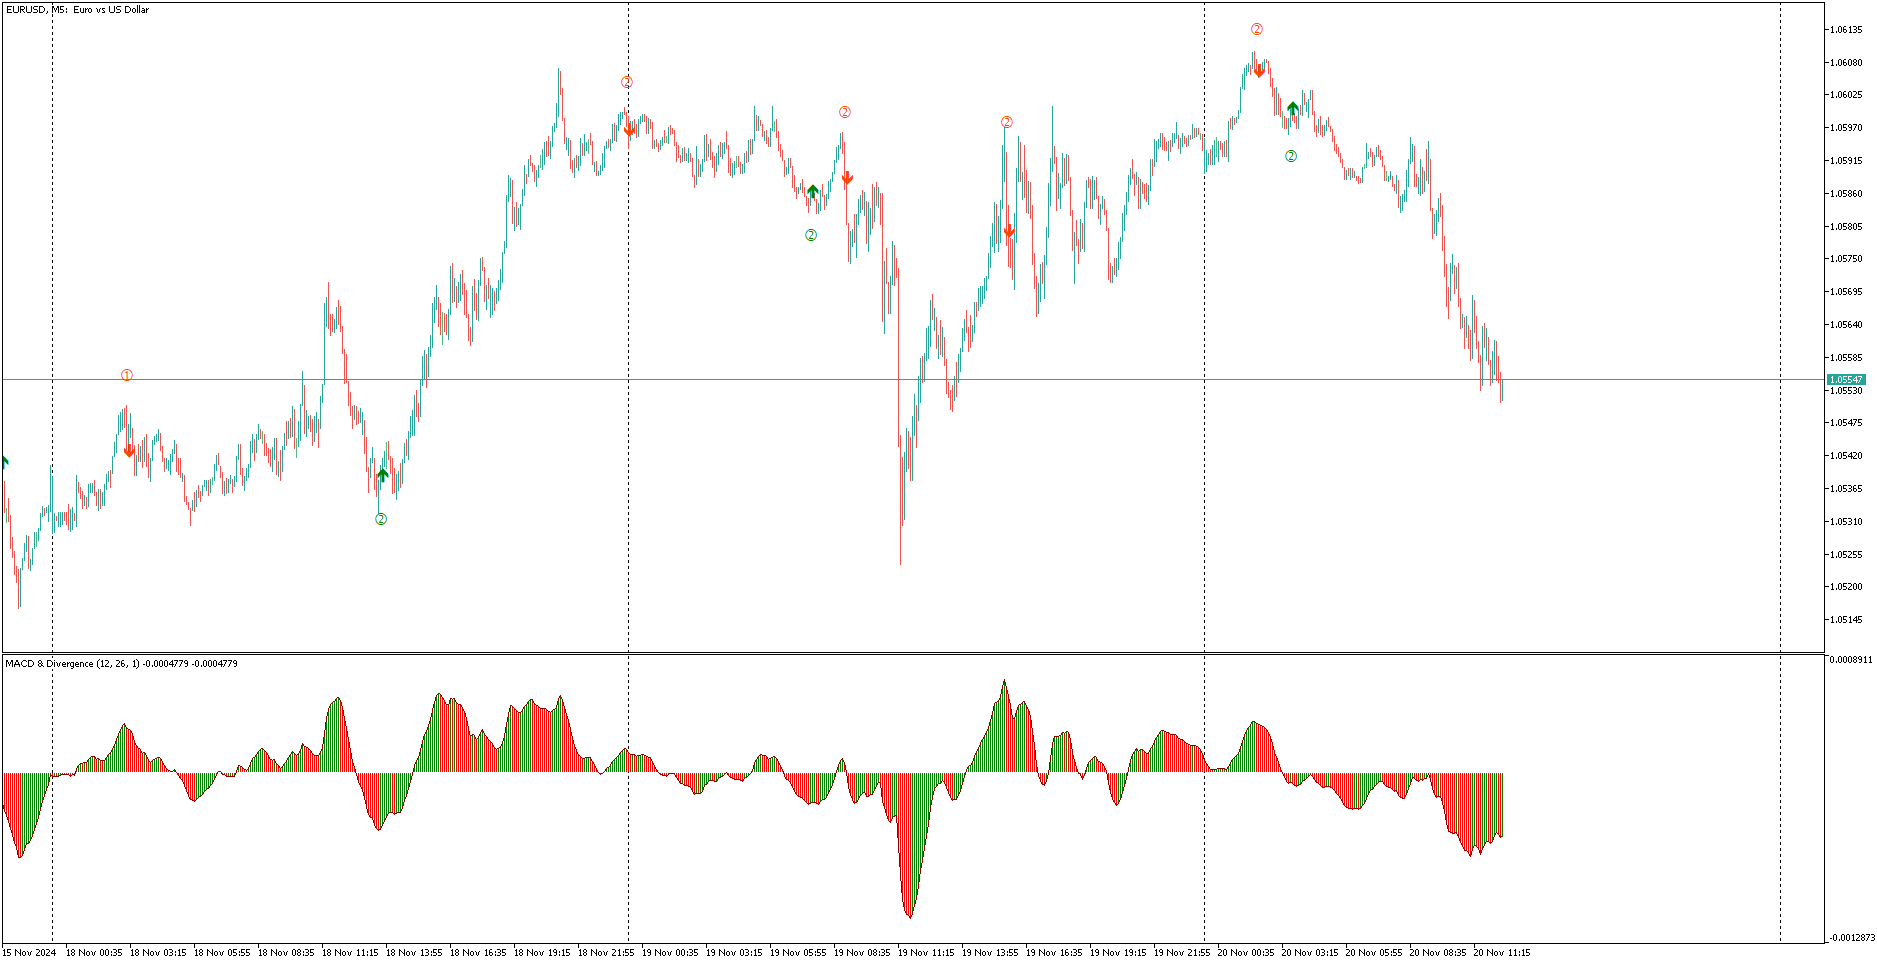
L'indicatore "The First Red", basato sulla strategia ideata da Dariusz Dargo, è progettato per identificare e contrassegnare le candele sul grafico che soddisfano le condizioni della strategia "The First Red" e le sue estensioni, come "Second Red", "First Green" e "Second Green". La strategia si concentra sull'analisi degli estremi locali e dei segnali dell'oscillatore MACD.
-
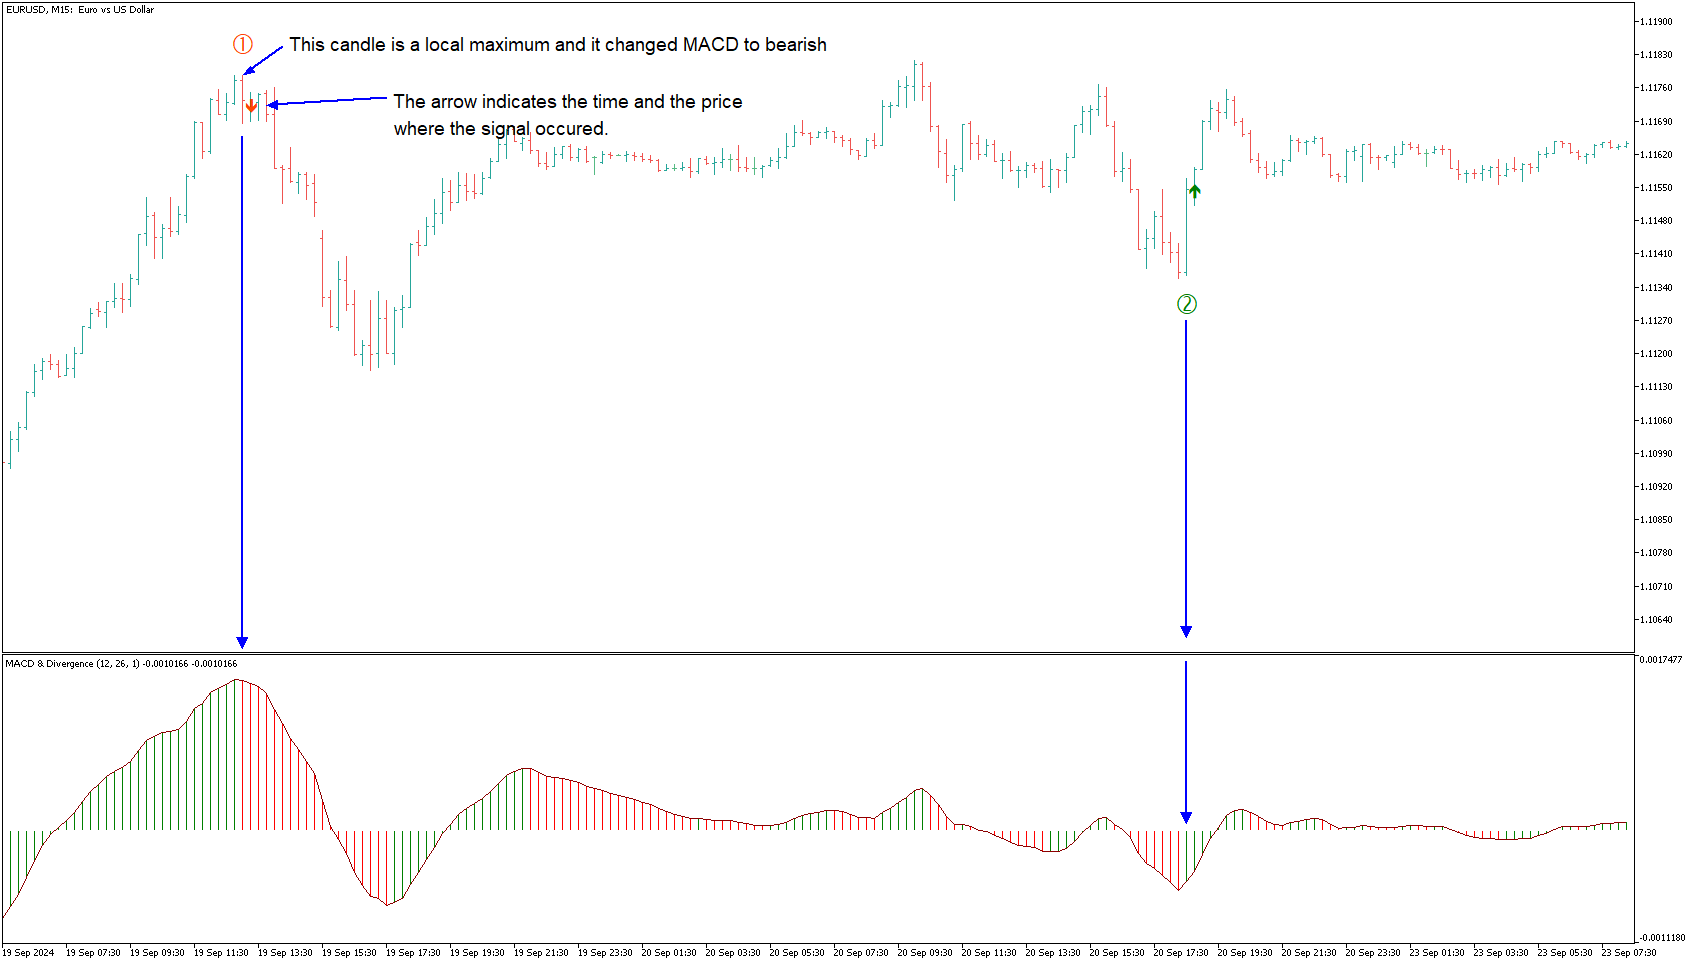
Prima candela rossa (First Red Candle): Una candela viene contrassegnata come "First Red" quando stabilisce un massimo locale e l'istogramma MACD cambia direzione verso il ribasso. Simbolo sul grafico: una freccia rossa rivolta verso il basso sopra la candela.
-
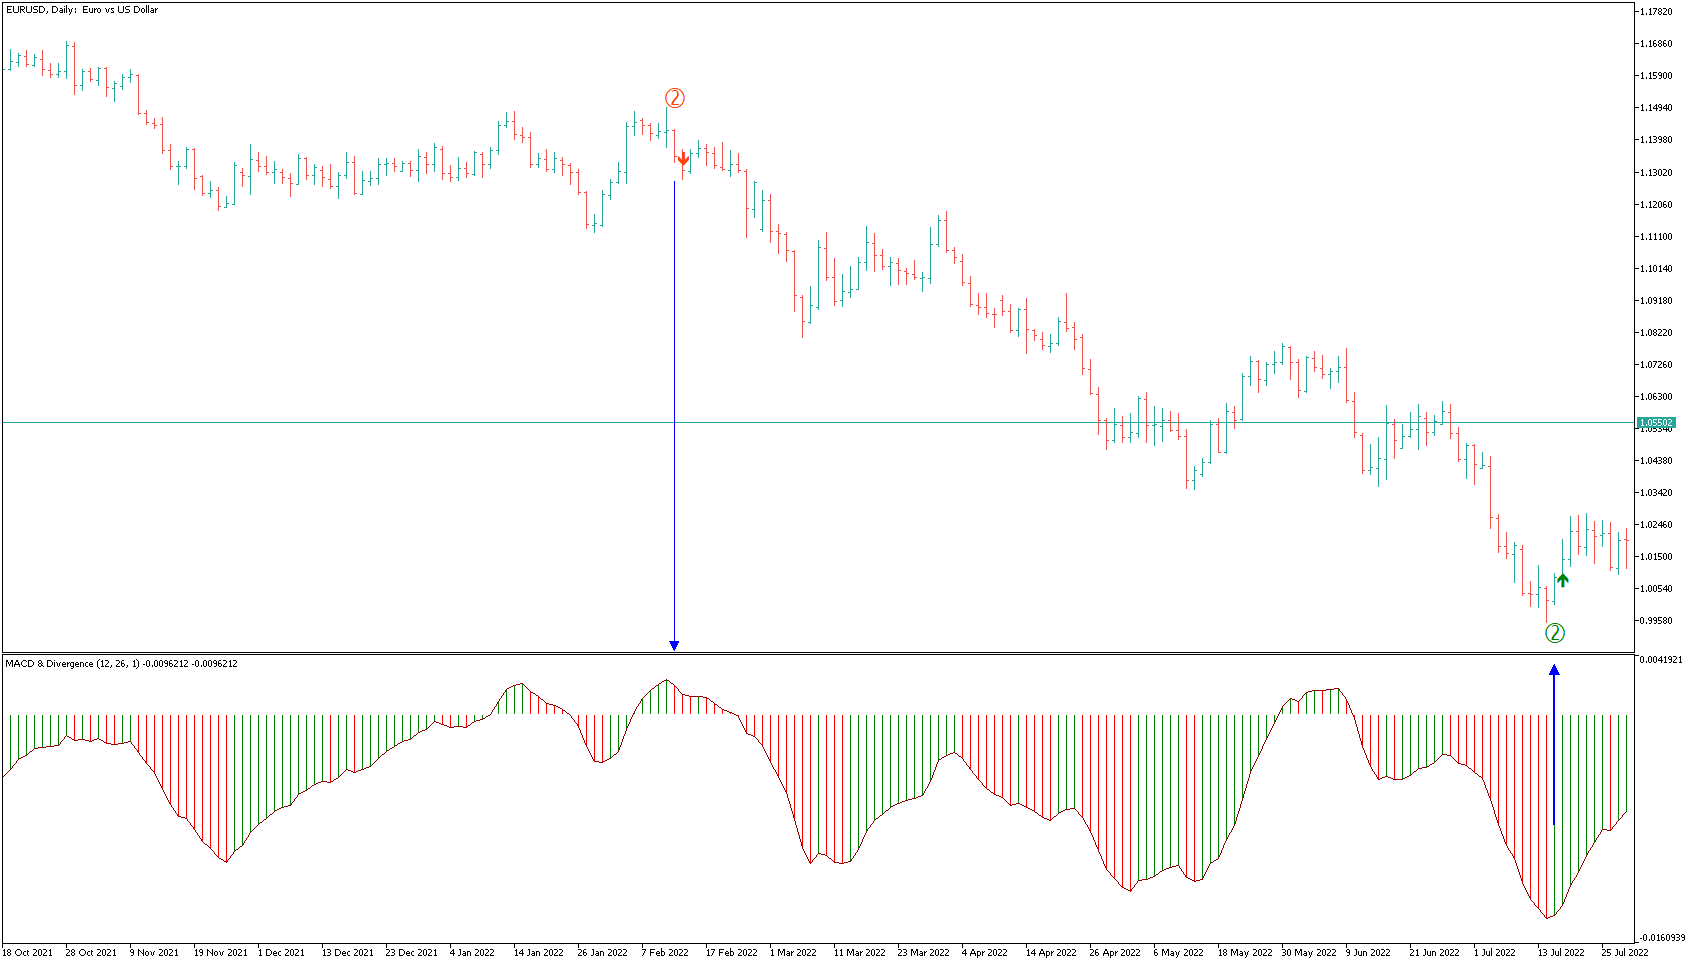
Seconda candela rossa (Second Red Candle): La seconda candela ribassista che segue la "First Red", confermando il cambiamento di direzione. Simbolo sul grafico: il numero "2" rosso sopra la candela.
-
Prima candela verde (First Green Candle): Una candela viene contrassegnata come "First Green" quando stabilisce un minimo locale e l'istogramma MACD cambia direzione verso il rialzo. Simbolo sul grafico: una freccia verde rivolta verso l'alto sotto la candela.
-
Seconda candela verde (Second Green Candle): La seconda candela rialzista che segue la "First Green", confermando il cambiamento di direzione. Simbolo sul grafico: il numero "2" verde sotto la candela.
Caratteristiche dell'indicatore:
- Contrassegno visivo delle candele direttamente sul grafico.
- Integrazione con l'oscillatore MACD per un'identificazione precisa dei cambiamenti di momentum.
- Colori e simboli personalizzabili per una facile interpretazione.
Scopo: L'indicatore è pensato per i trader che cercano punti di svolta dinamici e segnali di ingresso precisi, e può essere utilizzato efficacemente sia sui grafici a candele standard che sui grafici Range Bar.