The First Red MT4
- 지표
- 버전: 1.0
- 활성화: 5
"The First Red" 지표는 Dariusz Dargo가 만든 전략을 기반으로 하며, "The First Red" 전략과 "Second Red," "First Green," "Second Green"과 같은 확장 조건을 충족하는 캔들을 차트에서 식별하고 표시하도록 설계되었습니다. 이 전략은 지역적 극한값과 MACD 오실레이터의 신호를 분석하는 데 중점을 둡니다.
-
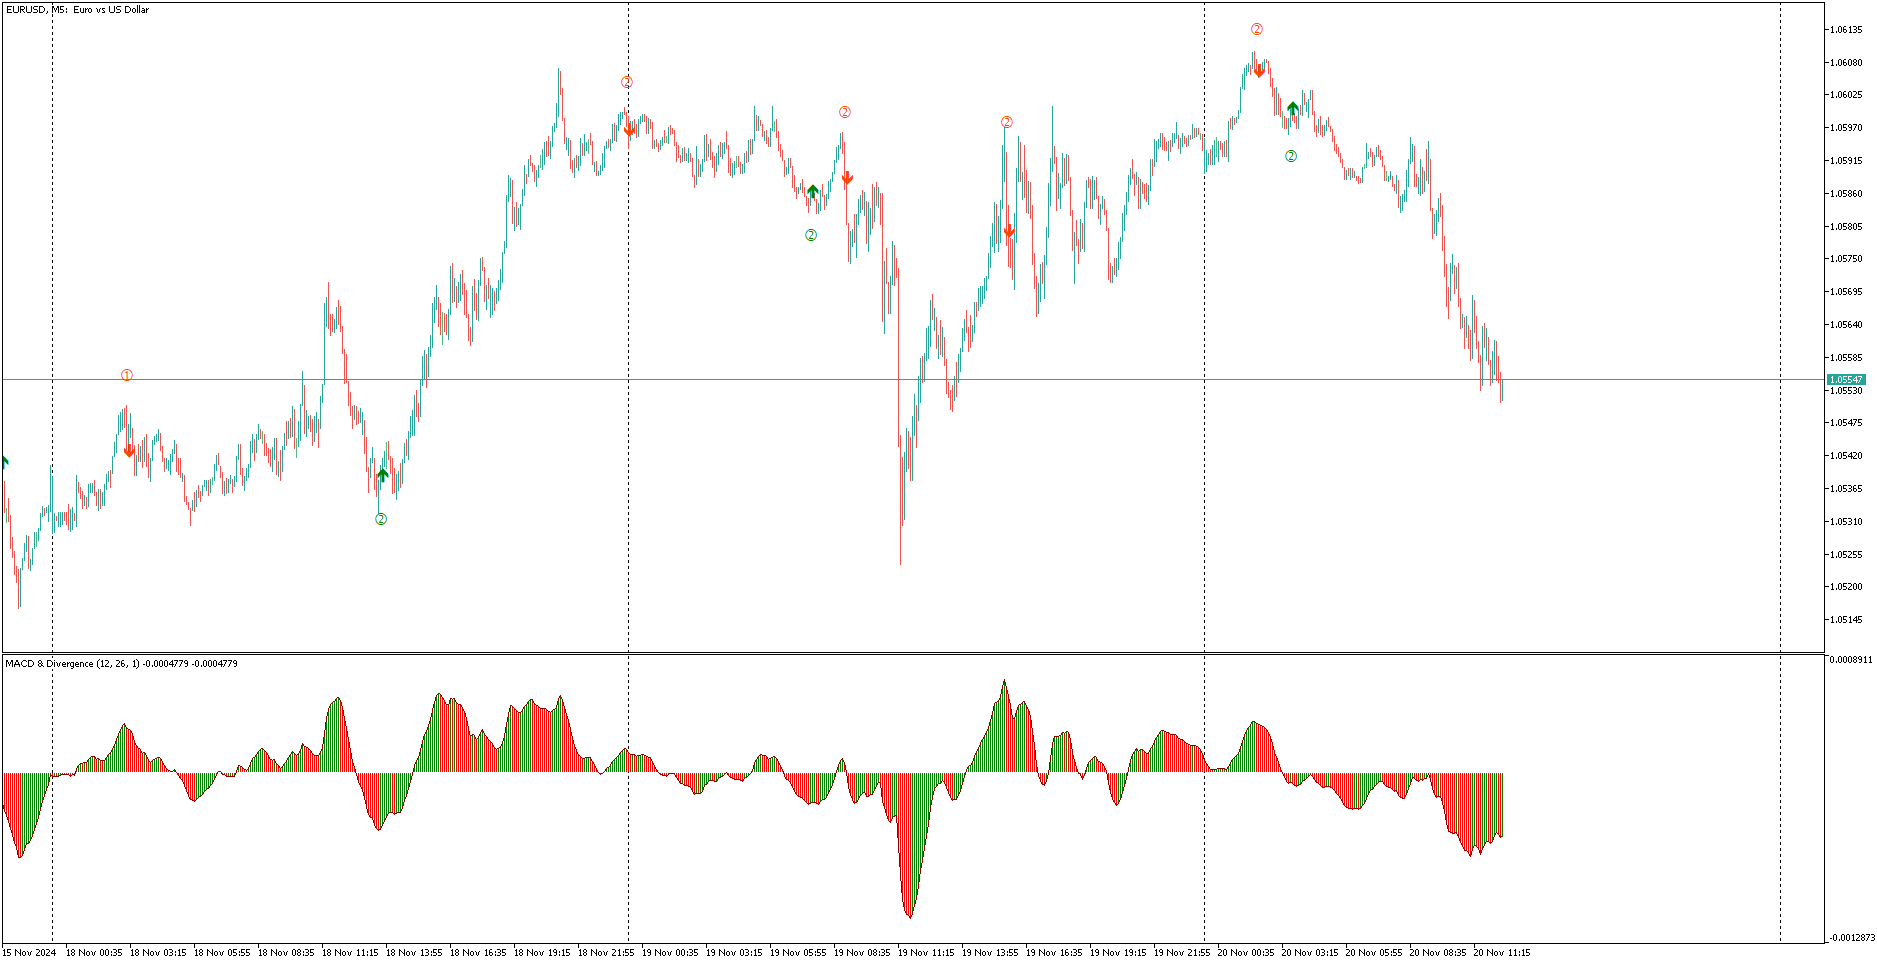
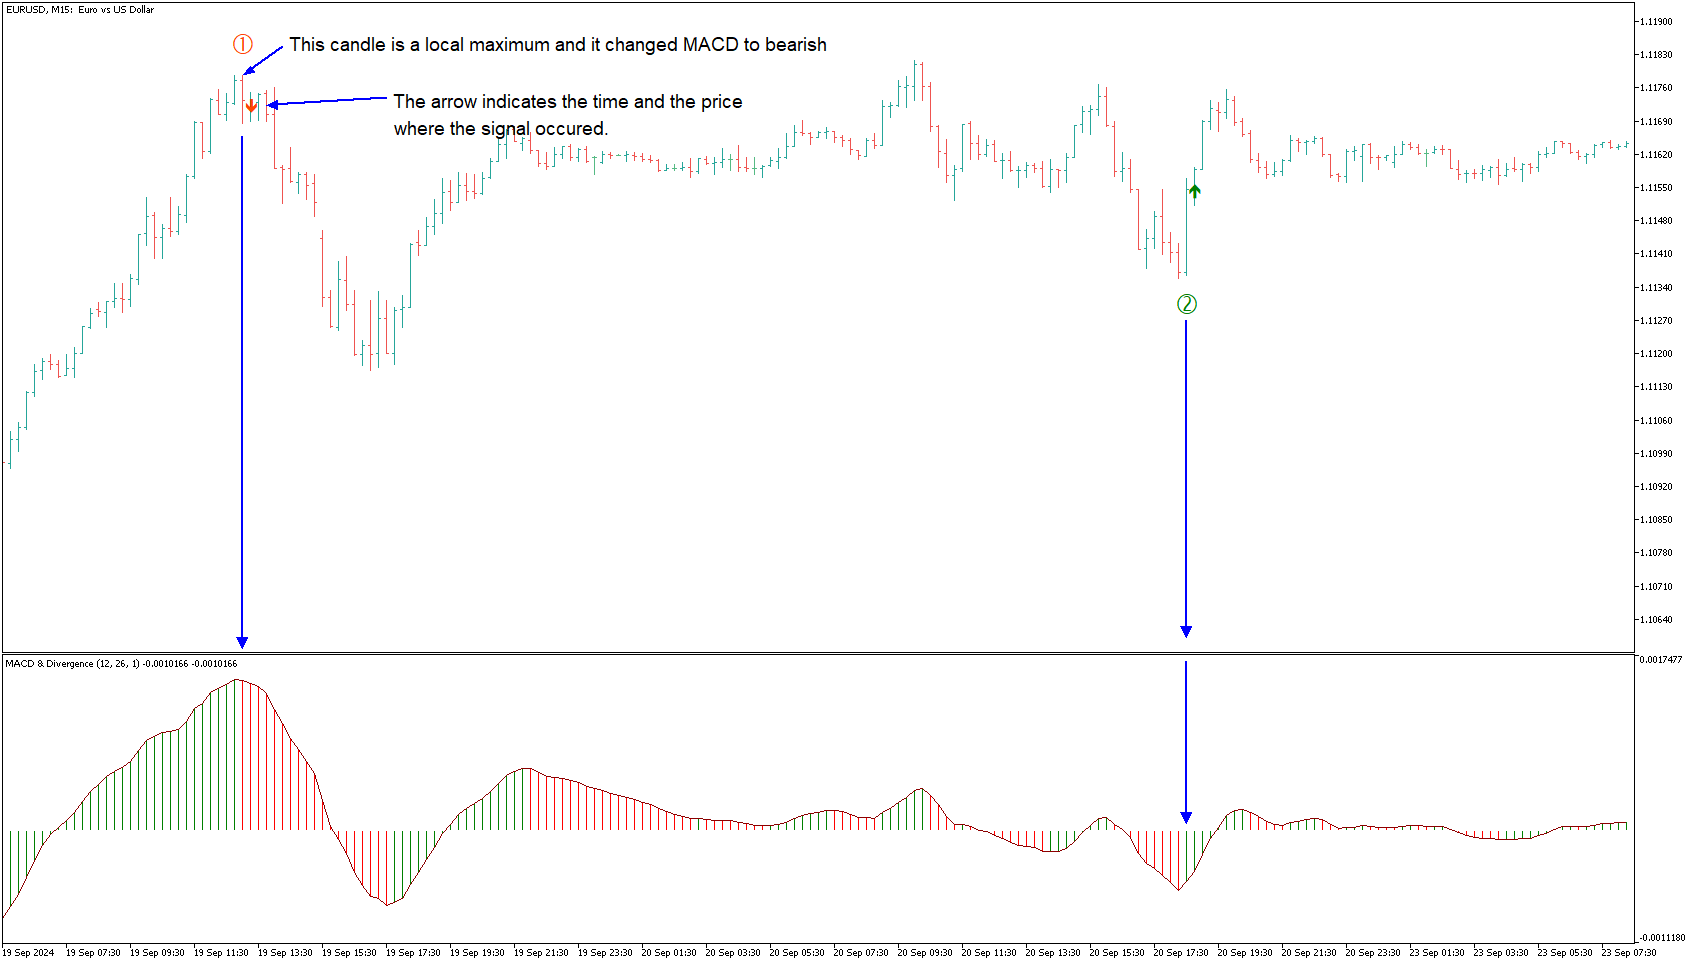
첫 번째 빨간 캔들 (First Red Candle): 캔들이 지역적 최고점을 형성하고 MACD 히스토그램이 하락 방향으로 전환될 때 "First Red"로 표시됩니다. 차트 기호: 캔들 위의 빨간색 아래 화살표.
-
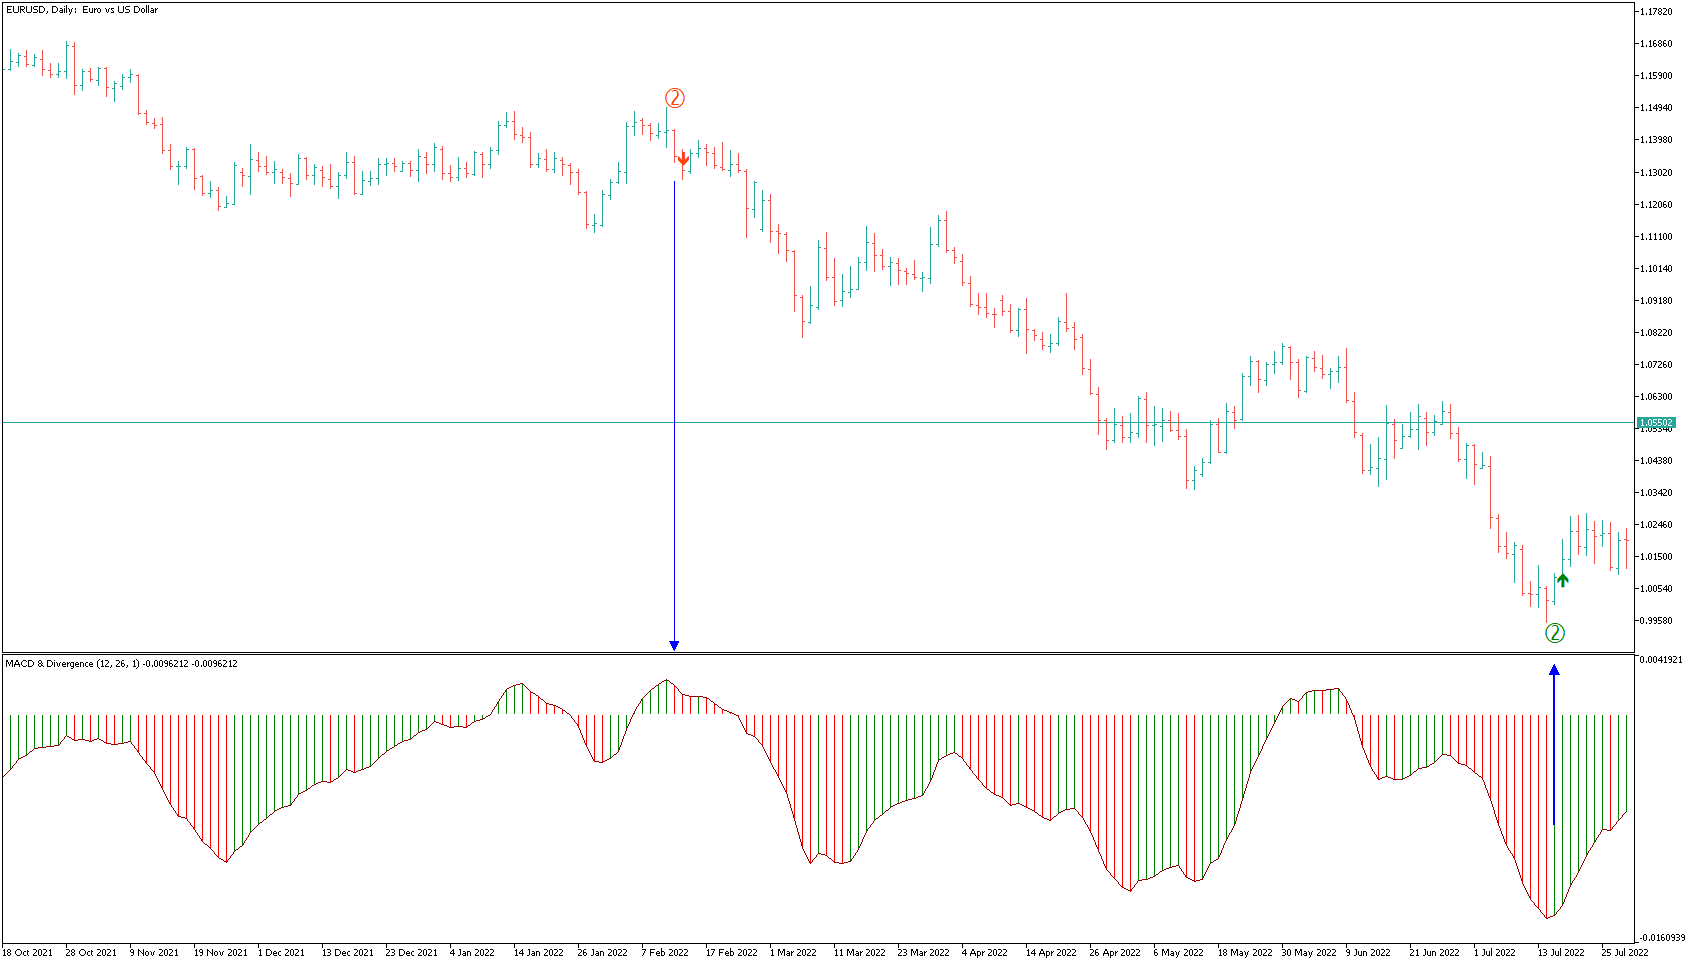
두 번째 빨간 캔들 (Second Red Candle): "First Red" 이후의 두 번째 하락 캔들로, 방향 전환을 확인합니다. 차트 기호: 캔들 위의 빨간 숫자 "2".
-
첫 번째 녹색 캔들 (First Green Candle): 캔들이 지역적 최저점을 형성하고 MACD 히스토그램이 상승 방향으로 전환될 때 "First Green"으로 표시됩니다. 차트 기호: 캔들 아래의 녹색 위 화살표.
-
두 번째 녹색 캔들 (Second Green Candle): "First Green" 이후의 두 번째 상승 캔들로, 방향 전환을 확인합니다. 차트 기호: 캔들 아래의 녹색 숫자 "2".
지표 특징:
- 차트에서 캔들을 시각적으로 표시합니다.
- MACD 오실레이터와 통합하여 모멘텀 변화의 정확한 식별이 가능합니다.
- 사용자가 설정할 수 있는 색상과 기호로 쉽게 해석할 수 있습니다.
목적: 이 지표는 동적 전환점과 정밀한 시장 진입 신호를 찾는 트레이더를 위해 설계되었으며, 표준 캔들 차트와 Range Bar 차트에서 효과적으로 사용할 수 있습니다.