The First Red MT4
- Indicadores
- Versão: 1.0
- Ativações: 5
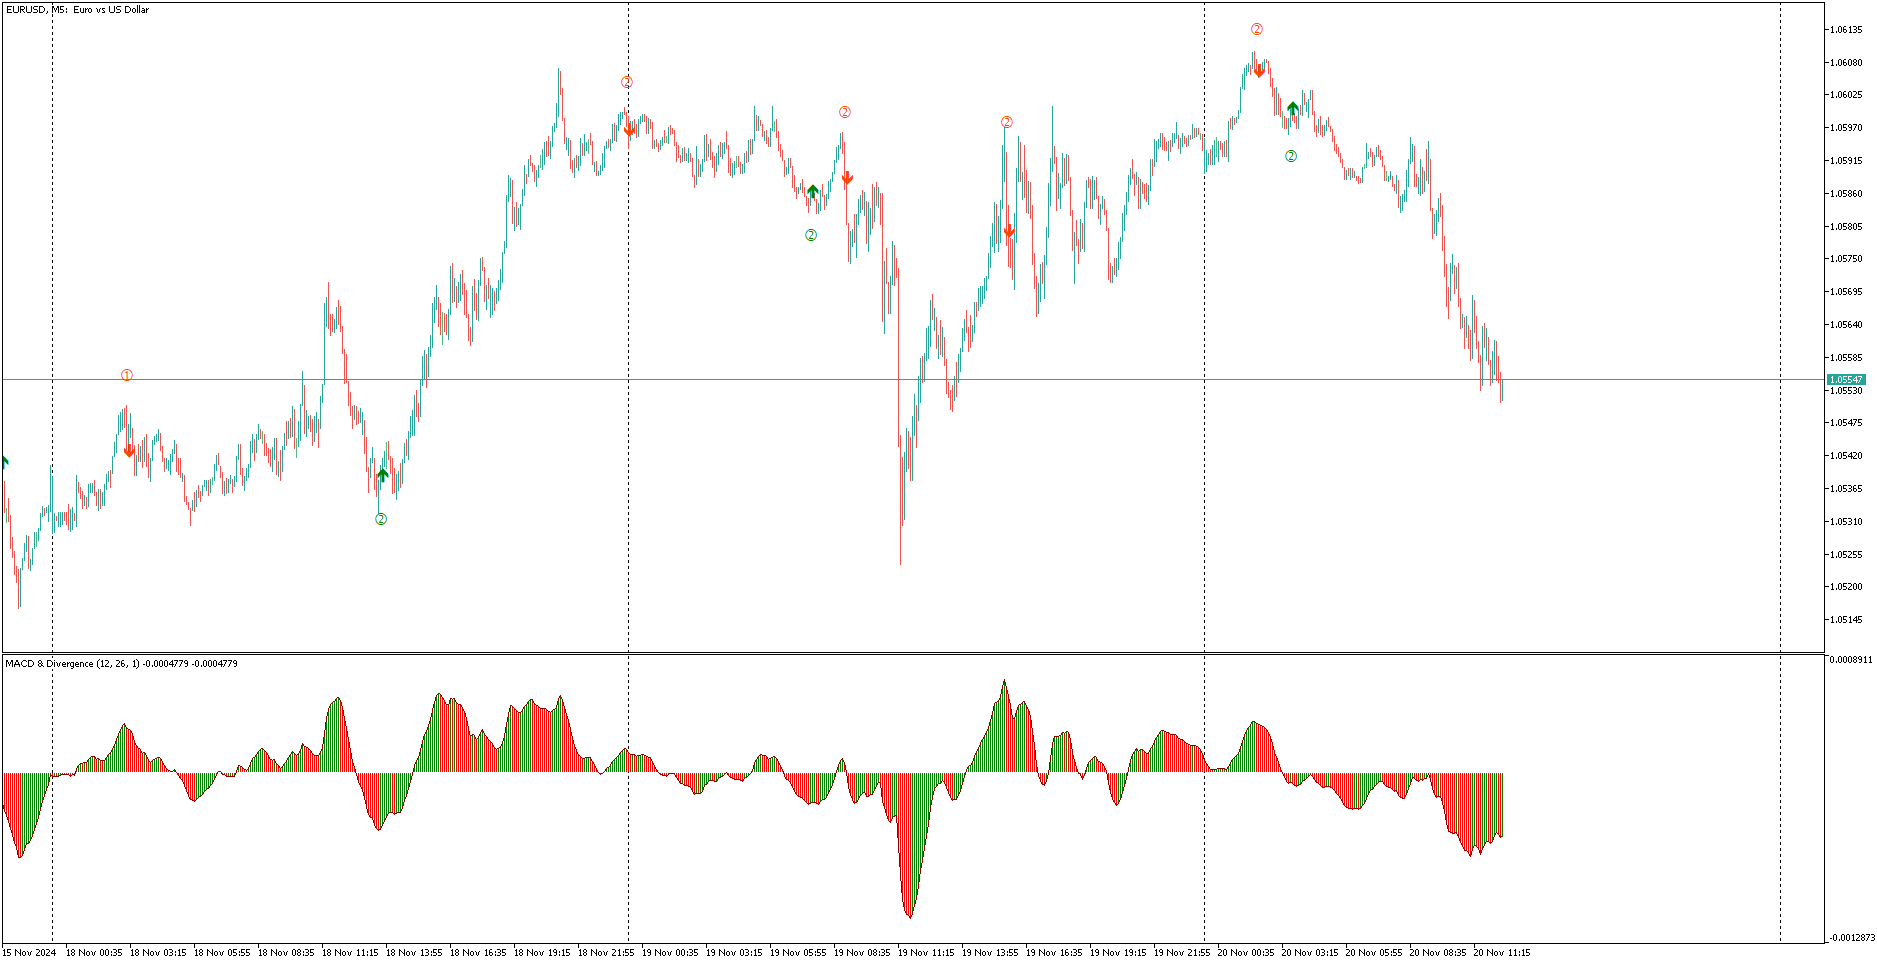
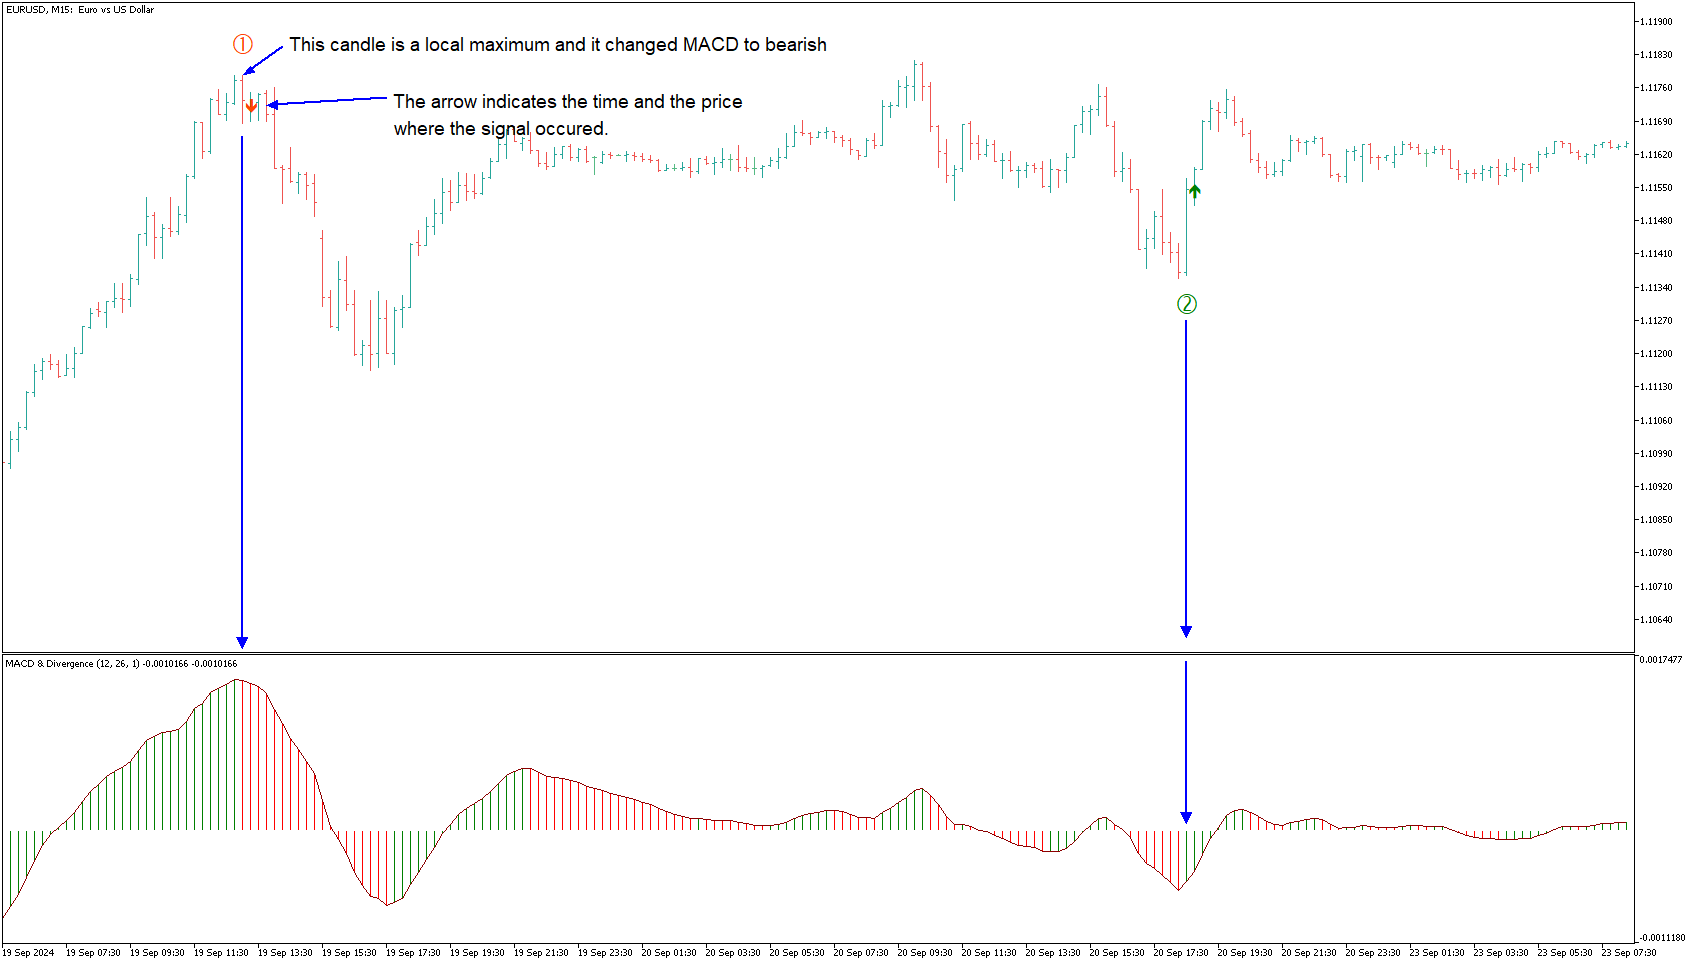
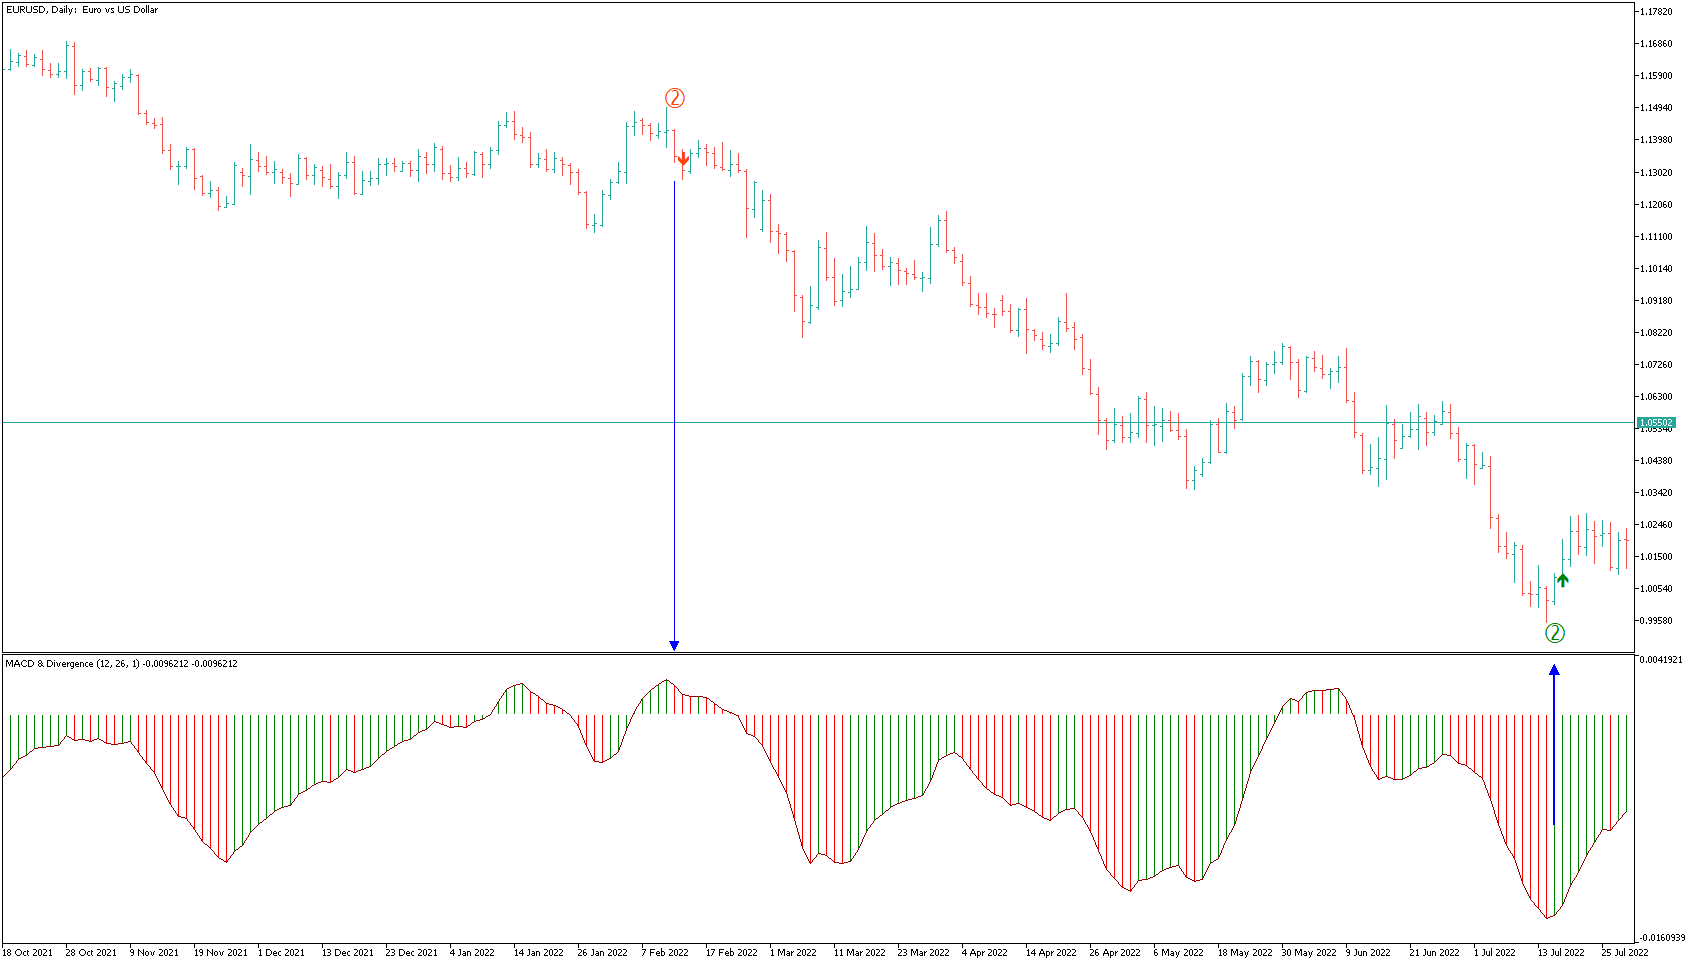
O indicador "The First Red", baseado na estratégia criada por Dariusz Dargo, foi desenvolvido para identificar e marcar velas no gráfico que atendem às condições da estratégia "The First Red" e suas extensões, como "Second Red", "First Green" e "Second Green". A estratégia é centrada na análise de extremos locais e nos sinais do oscilador MACD.
-
Primeira vela vermelha (First Red Candle): Uma vela é marcada como "First Red" quando atinge um máximo local e o histograma MACD muda de direção para baixista. Símbolo no gráfico: uma seta vermelha apontando para baixo acima da vela.
-
Segunda vela vermelha (Second Red Candle): A segunda vela de baixa após a "First Red", confirmando a mudança de direção. Símbolo no gráfico: o número "2" em vermelho acima da vela.
-
Primeira vela verde (First Green Candle): Uma vela é marcada como "First Green" quando atinge um mínimo local e o histograma MACD muda de direção para altista. Símbolo no gráfico: uma seta verde apontando para cima abaixo da vela.
-
Segunda vela verde (Second Green Candle): A segunda vela de alta após a "First Green", confirmando a mudança de direção. Símbolo no gráfico: o número "2" em verde abaixo da vela.
Características do indicador:
- Marcação visual de velas diretamente no gráfico.
- Integração com o oscilador MACD para identificação precisa de mudanças de momentum.
- Cores e símbolos personalizáveis para facilitar a interpretação.
Objetivo: O indicador é projetado para traders que buscam pontos de reversão dinâmicos e sinais precisos de entrada no mercado, podendo ser usado de forma eficaz em gráficos de velas padrão e gráficos de Range Bar.