Tabajara Ogro

4.77

Setup Tabajara was created by a Brazilian trader known as  "The OGRO of Wall Street" .

The idea of this setup is to indicate to the trader the current trend of prices and  the type of operation should be looked for in the graph.

Operation

  • It does this through the relation of the closing price position and the  of 20 periods, by painting the candles in 4 possible colors :
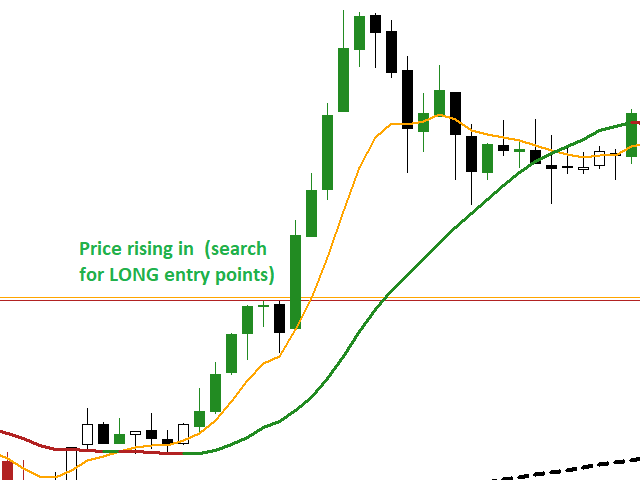
    • Green -> Price rising in upward trend (Search entry points for PURCHASE)
    • Black -> Price correcting in Bullish Trend (Search entry points for purchase)
    • Red -> Price falling in Downtrend (Search entry points for Sale)
    • White -> Price correcting in Downtrend (Search entry points of Sale)

  • In addition, I also put the following indicators in the script:
    • Exponential Average of 8 periods: To identify short-term price movements
    • Arithmetic Average of 50 periods: To identify medium-term price movements
    • Exponential Average of 80 periods: To identify medium-term price movements
    • Arithmetic Average of 200 periods: To identify long-term price movements


If you still have questions, please contact me by direct message: https://www.mql5.com/en/users/robsjunqueira/


İncelemeler 18
antoniossergio
29
antoniossergio 2025.03.13 20:39 
 

Excelente

Irusel
704
Irusel 2024.10.29 21:21 
 

Отлично

goldenjumper
47
goldenjumper 2022.11.17 12:14 
 

Ferramenta excelente! Estou testando junto com MACD e estou tendo resultados positivos. Sinto falta só dos alarmes, acho que seria a "cereja do bolo". Trabalho em homeoffice e tenho um monitor ao meu lado dedicado para acompanhar o trading, então, um alarme tocando quando os candles ficarem vermelhos (sell) ou verdes (buy) com mensagens em popup na tela iriam ajudar muito. Roberto, conseguiria implementar isso? Abraços e parabéns!

Önerilen ürünler
Chart Control MT5
Danrlei Hornke
5 (1)
O Chart Control é um indicador que permite de forma rapida e pratica alterar o timeframe e ativo do grafico, possibilitando que voce possa fazer todas as suas analises em apenas um grafico sem precisar abrir vários, além disso voce pode escolher o entre os temas claro e escuro para o qual melhor se adapta a sua preferencia. MT4:  https://www.mql5.com/pt/market/product/112155  
FREE
Setup Tabajara, "The OGRO of Wall Street" olarak bilinen Brezilyalı bir tüccar tarafından oluşturuldu. Bu kurulumun fikri, tüccara fiyatların mevcut eğilimini ve grafikte aranması gereken işlem türünü belirtmektir. Operasyon Bunu, mumları ve VWAP'yi saat 10:40'a kadar ve sonrasında 20 periyodun aritmetik ortalaması ile mumları 4 olası renkte boyayarak konumlandırarak yapar: Yeşil -> Yükselen trendde yükselen fiyat (SATIN ALMA için giriş noktalarını arayın) Siyah -> Boğa Trendinde fiyat düzelt
FREE
# SSL ST Strategy MT5 Indicator - Turkish Version SSL ST Strategy MT5 Göstergesi, tüccarların ticaret grafiğinde alış ve satış sinyallerini açıkça tanımlamalarına yardımcı olmak için tasarlanmış bir teknik analiz aracıdır. Çizgiler ve oklar gibi görsel göstergeler, ayrıca ses, açılır pencere ve anında bildirimleri sunarak, ticaret fırsatı ortaya çıktığında tüccarları zamanında uyarır. ## Ana Avantajlar - Renkli çizgiler (SSL1 ve Baseline) ve alış sinyalleri (yeşil üçgen) ve satış sinyalleri
VolumeBasedColorsBars
Henrique Magalhaes Lopes
VolumeBasedColorsBars — Free Powerful Volume Analysis for All Traders Unlock the hidden story behind every price bar! VolumeBasedColorsBars is a professional-grade, 100% FREE indicator that colorizes your chart candles based on real, adaptive volume analysis. Instantly spot surges in market activity, identify exhaustion, and catch the moves that matter. This indicator gives you:    • Dynamic color-coded bars for instant volume context    • Adaptive thresholds based on historical, session-awar
FREE
Pivot Point Fibo RSJ, Fibonacci oranlarını kullanarak günün destek ve direnç çizgilerini izleyen bir göstergedir. Bu muhteşem gösterge, Fibonacci oranlarını kullanarak Pivot Point üzerinden 7 seviyeye kadar destek ve direnç oluşturur. Fiyatların, bir operasyonun olası giriş/çıkış noktalarını algılamanın mümkün olduğu bu destek ve direncin her bir düzeyine uyması harika. Özellikleri 7 seviyeye kadar destek ve 7 seviye direnç Seviyelerin renklerini ayrı ayrı ayarlayın Girişler Pivot Tipi Pivo
FREE
TilsonT3
Jonathan Pereira
5 (1)
Tillson's T3 moving average was introduced to the world of technical analysis in the article ''A Better Moving Average'', published in the American magazine Technical Analysis of Stock Commodities. Developed by Tim Tillson, analysts and traders of futures markets soon became fascinated with this technique that smoothes the price series while decreasing the lag (lag) typical of trend-following systems.
FREE
TendencyLine
Samuel De Souza Ferreira
TendencyLine Indicator - Market Trend Analysis (An exclusive indicator by PPF - Past Project Future) General Description TendencyLine is a technical indicator developed by PPF - Past Project Future to help traders identify the prevailing market trend. It overlays a trend line based on a user-selected moving average on the price chart and displays a colored histogram that signals the trend direction. Main Features Trend Identification: The indicator differentiates between bullish and bear
FREE
YKL DinDX
Ygor Keller Luccas
5 (2)
Dynamic Indicator --> YKL_DinDX Dynamic Indicator that creates a Band based on the distance from moving average specified by the user. The indicator considers the period entered by the user in order to calculate the average distance from moving average, creating an upper band and a lower band. This indicator is utilized by EA YKL_Scalper, version 2.0 or superior.
FREE
High Low Open Close
Alexandre Borela
4.98 (43)
Bu projeyi seviyorsanız, 5 yıldız incelemesi bırakın. Bu gösterge açık, yüksek, düşük ve belirtilen fiyatlar için çizer Dönem ve belirli bir zaman bölgesi için ayarlanabilir. Bunlar birçok kurumsal ve profesyonel tarafından görünen önemli seviyelerdir. tüccarlar ve daha fazla olabileceği yerleri bilmeniz için yararlı olabilir Aktif. Mevcut dönemler şunlardır: Önceki gün. Önceki Hafta. Önceki Ay. Previous Quarter. Önceki yıl. Veya: Mevcut gün. Hafta. Şimdi Ay. Şimdiki Mahallesi. Bugün yıl.
FREE
Provlepsis Göstergesine hoş geldiniz. "Provlepsis", MQL Piyasası için tasarlanmış son derece gelişmiş bir göstergedir. Aynı günün önceki çubuklarını analiz ederek, piyasanın potansiyel hareket aralığını doğru bir şekilde hesaplar ve gelecekteki fiyat dalgalanmaları hakkında değerli bilgiler sunar. Geleneksel ATR göstergesinin aksine, "Provlepsis" zaman faktörünü dikkate alarak farklı piyasa koşullarına uyum sağlayan daha güçlü bir araçtır. Gece saatlerinde gösterge daha dar bir aralık tahmin ede
FREE
KT DMA is a modified and advanced version of the classic Displaced Moving Averages with buy/sell crossover alerts and a Multi-Timeframe scanner that shows DMA's direction across each real-time time frame. A Displaced Moving Average is a simple moving average that moves ahead or backward in a time frame (either short-term or long-term). It also allows you to predict price movement more accurately. Features Depicts the trend direction using the alignment of three moving averages. Buy/Sell signals
ZigZag SMC MT5
Kallebe Lins De Oliveira Santos
The ZigZag SMC/SMT Indicator for MT5 is the ideal tool for traders who want to accurately identify tops and bottoms based on the advanced concepts of Smart Money Concepts (SMC) and Smart Money Trap (SMT). Main Benefits: Automatic identification of strategic tops and bottoms. Based on concepts used by institutional traders. Ideal for analyzing liquidity, market structure and manipulation. Simple to use: just add it to the chart and track the critical points. ️ Free Version: This ve
FREE
Topos e Fundos Historicos
Valter Cezar Costa
4.5 (8)
TOPOS INDICATOR AND HISTORIC BACKGROUNDS   The Indicator of historical tops and backgrounds is based on the monthly chart where sharks hide so it was developed to facilitate the identification of these regions. The available features are the Incoming Triggers alerts and notifications that are sent to the mobile phone.     Parameters 1-) Tops and Bottoms: You can change the color of the lines and the period in years and the filter range between the top and bottom and the median and consider th
FREE
Rejection Zones
Paulo Henrique Faquineli Garcia
Este poderoso indicador analisa o gráfico e mostra zonas de Rejeição de Preços! Isto é, locais onde o preço foi, mas não foi aceito pelo mercado! A visualização desta zona de Rejeição, facilita o entendimento do trader na tomada de decisões de onde operar e como operar! O indicador é composto por 4 linhas, sendo classificadas em 2 grupos: Linhas Vermelha e Amarela: Denotam os extremos onde o preço conseguiu chegar, mas não foi aceito! Linhas Laranja e Azul: A partir delas, denotam o Início da z
FREE
Multiple Timeframe MACD indicator. This indicator was built for making multiple timeframe analysis possible in MT5 using MACD Indicator. MACD Indicator traditionally shows two lines and one histogram. MACD Line(Yellow) is calculated by subtracting 12period EMA(fast) from 26period EMA (slow). Signal Line(Blue) is created by a 9period EMA from MACD Line. Histogram is just the difference between MACD and Signal lines. Histogram is colored based on the difference between its value and the previous h
DMC Trend
Deibson Carvalho
Indicator that uses ATR and standard deviation to calculate the current trend. It has the top and bottom line. The top line is shown when it is high, and the bottom line when it is low. The indicator does not draw a trend line or show the trend for the day, or for a certain period. It has the function of indicating the current trend, and may indicate a reversal. use it with caution and at your own risk.
FREE
Pro Support Resistance MT5
Suvashish Halder
4.9 (63)
This is the best Support and Resistance Indicator on the market, and it shows both confirmed Support and Resistance as well as Retests. Support & Resistance: Support marks where buying demand halts price declines, acting as a safety net. Resistance caps price surges, driven by selling pressure. Traders leverage these levels to predict reversals, plan entries, exits, and manage risks, making them trading's fundamental guideposts. Join To Learn Market Depth -   https://www.mql5.com/en/channels/su
FREE
A useful dashboard that shows the RSI values for multiple symbols and Time-frames. It can be easily hidden/displayed with a simple click on the X top left of the dashboard. You can input upper and lower RSI values and the colours can be set to show when above/below these values. The default values are 70 and 30. You can choose whether the dashboard is displayed on the right or left of the chart. If you want to have 2 dashboards on the same chart you must input a different name for each. The sca
FREE
Watermark Centralized
Ronnie Ferreira Silva
3.67 (3)
Watermark Centralized Adds a watermark centered with the asset name and chosen period. It is possible to override the font type, font size, font color and separator character. The watermark is positioned behind the candles, not disturbing the visualization. It has automatic re-centering if the window is resized. Hope this indicator helps you, good trading ;)
FREE
This EA finds Fair Value Liquidity (FVL) on the chart, tracks when they get mitigated , and then looks for an inversion signal (price “fails” through the zone). When that inversion happens, it places a trade in the opposite direction of the original Liquidity gap (an Inverse FVG approach). It also lets you control when it trades using market sessions , and it can auto-close positions at New York open (all positions or profitable-only). Key advantages Clear, rule-based entries (no guessing): trad
FREE
Graphic Alignment Context
Ricardo Alexandre Laurentino
The Graphic Alignment Context (GAC) Technical Indicator measures the vertical difference of the simple average price of a financial instrument in the context of three different timeframes determined by a defined number of bars or candles (periods) to determine the strength of the buy or sell trend. sale. Ascending average prices indicate Buying strength (1), Descending average prices indicate Selling strength (-1) and any scenario different from the previous two conditions indicates Neutrality
FREE
Caicai L&S Yield Histogram Important Notice: This indicator is an integral tool of the automated EA Caicai Long and Short Pair Trading . This indicator visually displays the percentage deviation (Yield %) of a pair's current spread relative to its own historical mean. It is an excellent tool for quickly visualizing the gross financial potential of a market distortion in Long & Short operations. Main Features: Percentage Visualization: Understand the size of the distortion in palpable percentage
FREE
Descrição Este Expert Advisor (EA) implementa uma estratégia baseada na divergência de preços entre o mini dólar (WDO$N) e o dólar cheio (DOL$N). Ele monitora, segundos antes da abertura do mercado ou ao longo do dia (conforme o modo escolhido), possíveis discrepâncias entre esses dois ativos e efetua ordens no mini dólar, apostando na convergência futura. Principais Recursos Divergência Mínima Configurável: A estratégia utiliza um parâmetro de divergência mínima de 10 pontos, ajustável de acor
FREE
VFI Quantum
Nikita Berdnikov
5 (1)
Introducing VFI (Volume Flow Indicator) – a trading indicator that analyzes the relationship between volume and price movement to identify key trading opportunities. The indicator displays the strength and direction of volume flow, providing clear signals about potential entry and exit points. Signals are formed based on zero line crossovers, crossovers between the VFI line and its exponential moving average (EMA), and when the indicator exits overbought and oversold zones. Attention! This stra
FREE
Trend Everest
Eduardo Da Costa Custodio Santos
Trend Everest MT5 göstergesi, karar vermeye yardımcı olan bir trend takip göstergesidir. Yardımcı olan ATR'nin ve ortalama gövdenin hesaplanmasına dayanır. Önemli bir konu, Trend Everest MT5 adayının yeniden boyamamasıdır, böylece daha fazla güvenle geriye dönük test yapabilirsiniz. Yeşil Yüksek Trend olduğunda Kırmızı düşüş trendi olduğunda. Piyasa fraktal olduğundan değil, bu nedenle grafik süresi ne kadar uzun olursa, iddialılık derecesi o kadar yüksek olur.
Marca Dagua
Erison Francisco De Sales
3 (1)
Adiciona marca d'água com nome do ativo em negociação. Pode ser ajustado definindo tamanho da fonte e coloração do texto. Testado com vários ativos do mercado B3 e Forex  Adione ao gráfico e configure de acordo com a necessidade. Caso tenha problemas sinta-se a-vontade para nos avisar e providenciaremos a correção logo que possível. ______________________________
FREE
SMC Workflow Auto EA
Choawana Malaikitsanachalee
English – Product Description (V1.42) SMC Workflow Auto EA — SR / OB / FVG with BOS–CHOCH Confirmation Smart-Money-Concepts Expert Advisor that trades only when a clean SMC setup appears: Order-Block retest after Break of Structure (BOS / CHOCH) confirmation, with optional SR and Fair Value Gap (FVG) confluence. The EA uses pending limit orders, fixed SL/TP or RR-based exits, step-lock trailing and strict risk-controls designed to pass broker validation. What it does Detects swing structure usi
FREE
Price Momentum
Flavio Javier Jarabeck
4.92 (12)
Value Chart indicator presents the Price evolution in a new form. This indicator, Price Momentum , was developed taking all the calculations presented in the book " Dynamic Trading Indicators " by Mark W. Helweg and David Stendahl (2002). The technique involves de-trended Prices from a user-defined Period of analysis and the addition of a Volatility index correction. The result is an Oscillator with 3 zones: Fair Price Value, Overbought/Oversold and Extremely Overbought/Oversold zones. Adding th
FREE
Solar Prediction – Indicator for Market Price Analysis Solar Prediction is a tool designed to analyze market price movements. The indicator processes market dynamics and helps identify potential entry and exit points. Market data analysis without additional indicators Flexible application – works on different timeframes Ease of use – suitable for both beginners and experienced traders Adaptability to market conditions – tracks price movement changes Solar Prediction is a solution
Pivot Points Indicator – a fast, reliable, and fully customizable pivot detection for MetaTrader 5. This indicator uses MetaTrader’s native iHighest and iLowest functions to identify pivot highs and lows by scanning for the highest and lowest prices within a user-defined window of bars. A pivot is confirmed only when the current bar is the absolute maximum or minimum within the selected range, ensuring accurate and timely signals based on robust built-in logic. Key Features No Repainting : Onc
FREE
Bu ürünün alıcıları ayrıca şunları da satın alıyor
SuperScalp Pro
Van Minh Nguyen
5 (9)
SuperScalp Pro – Gelişmiş Çoklu Filtreli Scalping Gösterge Sistemi SuperScalp Pro, klasik Supertrend ile çok sayıda akıllı onay filtresini birleştiren gelişmiş bir scalping gösterge sistemidir. Gösterge M1’den H4’e kadar tüm zaman dilimlerinde verimli çalışır ve özellikle XAUUSD, BTCUSD ve ana Forex pariteleri için uygundur. Bağımsız bir sistem olarak kullanılabilir veya mevcut ticaret stratejilerine esnek şekilde entegre edilebilir. Gösterge, hız ve yavaş EMA’lar, trend belirleyen üç EMA, EMA e
Bu indikatörü satın alırsanız, Profesyonel Trade Manager’ımı  + EA ÜCRETSİZ olarak alacaksınız. Öncelikle, bu Ticaret Sistemi'nin Non-Repainting, Non-Redrawing ve Non-Lagging Göstergesi olduğunu vurgulamak önemlidir, bu da hem manuel hem de robot ticareti için ideal hale getirir. Online kurs, kılavuz ve ön ayarları indir. "Smart Trend Trading System MT5", yeni ve deneyimli tüccarlar için özelleştirilmiş kapsamlı bir ticaret çözümüdür. 10'dan fazla premium göstergeyi birleştiriyor ve 7'den fazla
Entry In The Zone and SMC Multi Timeframe is a real-time market analysis tool developed based on Smart Money Concepts (SMC). It is designed to analyze market structure, price direction, reversal points, and key zones across multiple timeframes in a systematic way. The system displays Points of Interest (POI) and real-time No Repaint signals, with instant alerts when price reaches key zones or when signals occur within those zones. It functions as both an Indicator and a Signal System (2-in-1), c
Divergence Bomber
Ihor Otkydach
4.89 (83)
Bu göstergeyi satın alan herkese aşağıdaki ekstra içerikler ücretsiz olarak sunulmaktadır: Her işlemi otomatik olarak yöneten, Stop Loss ve Take Profit seviyelerini ayarlayan ve işlemleri strateji kurallarına göre kapatan özel yardımcı araç: "Bomber Utility" Göstergenin farklı varlıklar üzerinde kullanılmasına yönelik ayar dosyaları (set dosyaları) Bomber Utility için 3 farklı modda kullanım sunan ayar dosyaları: "Minimum Risk", "Dengeli Risk" ve "Bekle-Gör Stratejisi" Bu ticaret stratejisini hı
FX Trend MT5 NG
Daniel Stein
5 (4)
FX Trend NG: Yeni Nesil Çoklu Piyasa Trend Zekâsı Genel Bakış FX Trend NG , çoklu zaman dilimlerinde çalışan profesyonel bir trend analiz ve piyasa izleme aracıdır. Piyasanın yapısını saniyeler içinde anlamanızı sağlar. Birden fazla grafik arasında geçiş yapmak yerine, hangi enstrümanların trendde olduğunu, momentumun nerede zayıfladığını ve hangi zaman dilimlerinin uyumlu olduğunu anında görebilirsiniz. Lansman Teklifi – FX Trend NG sadece $30 (6 Ay) veya $80 Ömür Boyu Lisans ile edinin. Zate
ARICoins
Temirlan Kdyrkhan
ARICoin is a powerful trading companion designed to generate high-probability entry signals with dynamic TP/SL/DP levels based on volatility. Built-in performance tracking shows win/loss stats, PP1/PP2 hits, and success rates all updated live. Key Features: Buy/Sell signals with adaptive volatility bands Real-time TP/SL/DP levels based on ATR Built-in MA Filter with optional ATR/StdDev volatility Performance stats panel (Success, Profit/Loss, PP1/PP2) Alerts via popup, sound, push, or email Cust
Grabber System MT5
Ihor Otkydach
4.82 (22)
Size mükemmel bir teknik gösterge olan Grabber’ı tanıtıyorum. Bu araç, kullanıma hazır bir “her şey dahil” işlem stratejisi olarak çalışır. Tek bir yazılım kodu içinde güçlü piyasa teknik analiz araçları, işlem sinyalleri (oklar), uyarı işlevleri ve push bildirimleri entegre edilmiştir. Bu göstergeyi satın alan herkes aşağıdaki hediyeleri ücretsiz olarak alır: Açık emirleri otomatik yönetmek için Grabber Yardımcı Aracı Kurulum, yapılandırma ve nasıl işlem yapılacağını adım adım anlatan video kıl
Trend Screener Pro MT5
STE S.S.COMPANY
4.84 (101)
Trend Göstergesi, Trend Alım Satım ve Filtreleme için Çığır Açan Benzersiz Çözüm, Tüm Önemli Trend Özellikleriyle Tek Bir Araç İçinde Yerleştirildi! Forex, emtialar, kripto para birimleri, endeksler ve hisse senetleri gibi tüm sembollerde/araçlarda kullanılabilen %100 yeniden boyamayan çoklu zaman çerçevesi ve Çoklu para birimi göstergesidir. Trend Screener, grafikte noktalarla ok trend sinyalleri sağlayan etkili bir trend trend göstergesidir. Trend analizörü göstergesinde bulunan özellikler: 1.
Gold Entry Sniper
Tahir Mehmood
5 (5)
Gold Entry Sniper – Altın Scalping & Swing Trading için Profesyonel Çoklu Zaman Çerçeveli ATR Paneli Gold Entry Sniper , XAUUSD ve diğer enstrümanlar için doğru al/sat sinyalleri veren, ATR Trailing Stop mantığı ve çoklu zaman çerçevesi analizi ile geliştirilmiş gelişmiş bir MetaTrader 5 göstergesidir. Temel Özellikler ve Avantajlar Çoklu Zaman Çerçevesi Analizi – M1, M5, M15 trendlerini tek panelde gösterir. ATR Tabanlı Trailing Stop – Volatiliteye göre dinamik olarak ayarlanır. Profesyonel Gra
Power Candles – Tüm Piyasalar İçin Güce Dayalı Giriş Sinyalleri Power Candles , Stein Investments’ın kanıtlanmış güç analizini doğrudan fiyat grafiğinize taşır. Sadece fiyata tepki vermek yerine, her mum gerçek piyasa gücüne göre renklendirilir. Bu sayede momentum birikimleri, güç hızlanmaları ve net trend geçişleri anında görülebilir. Tüm Piyasalar İçin Tek Mantık Power Candles tüm işlem sembollerinde otomatik olarak çalışır. Gösterge, mevcut sembolün Forex mi yoksa Forex dışı bir piyasa mı old
AriX
Temirlan Kdyrkhan
1 (4)
AriX Indicator for MT5 A powerful trend-following and signal-evaluation tool AriX is a custom MT5 indicator that combines Moving Averages and ATR-based risk/reward logic to generate clear buy/sell signals. It visualizes dynamic SL/TP levels, evaluates past trade outcomes, and displays win/loss statistics in a clean on-chart panel. Key features include: Buy/Sell signals based on MA crossovers ATR-based SL/TP1/TP2/TP3 levels with visual lines and labels Signal outcome tracking with real-time stat
Quantum TrendPulse
Bogdan Ion Puscasu
5 (22)
SuperTrend   ,   RSI   ve   Stochastic'in   gücünü tek bir kapsamlı göstergede birleştirerek işlem potansiyelinizi en üst düzeye çıkaran nihai işlem aracı olan   Quantum TrendPulse'u   tanıtıyoruz. Hassasiyet ve verimlilik arayan yatırımcılar için tasarlanan bu gösterge, piyasa trendlerini, momentum değişimlerini ve en uygun giriş ve çıkış noktalarını güvenle belirlemenize yardımcı olur. Temel Özellikler: SuperTrend Entegrasyonu:   Güncel piyasa trendlerini kolayca takip edin ve karlılık dalgası
Atomic Analyst MT5
Issam Kassas
4.03 (30)
Öncelikle belirtmek gerekir ki bu Ticaret Göstergesi Yeniden Çizim Yapmaz, Gecikmez ve Gecikme Göstermez, bu da hem manuel hem de robot ticareti için ideal hale getirir. Kullanıcı kılavuzu: ayarlar, girişler ve strateji. Atom Analisti, Piyasada Daha İyi Bir Avantaj Bulmak İçin Fiyatın Gücünü ve Momentumunu Kullanan PA Fiyat Hareketi Göstergesidir. Gürültüleri ve Yanlış Sinyalleri Kaldırmaya ve Ticaret Potansiyelini Artırmaya Yardımcı Olan Gelişmiş Filtrelerle Donatılmıştır. Birden fazla katmanl
Game Changer è un indicatore di tendenza rivoluzionario, progettato per essere utilizzato su qualsiasi strumento finanziario, per trasformare il tuo MetaTrader in un potente analizzatore di trend. Funziona su qualsiasi intervallo temporale e aiuta a identificare i trend, segnala potenziali inversioni, funge da meccanismo di trailing stop e fornisce avvisi in tempo reale per risposte tempestive del mercato. Che tu sia un professionista esperto o un principiante in cerca di un vantaggio, questo st
Tanıtım       Quantum Breakout PRO   , Breakout Bölgeleri ile ticaret yapma şeklinizi değiştiren çığır açan MQL5 Göstergesi! 13 yılı aşkın ticaret tecrübesine sahip deneyimli tüccarlardan oluşan bir ekip tarafından geliştirilmiştir.       Kuantum Breakout PRO       yenilikçi ve dinamik koparma bölgesi stratejisiyle ticaret yolculuğunuzu yeni zirvelere taşımak için tasarlanmıştır. Kuantum Breakout Göstergesi, size 5 kar hedefi bölgesi ile kırılma bölgelerinde sinyal okları ve kırılma kutusuna da
Smart Stop Indicator – Stop-loss düzeylerini doğrudan grafikte akıllı ve hassas şekilde belirleyin Genel Bakış Smart Stop Indicator, stop-loss seviyesini tahmin ederek veya sezgilere güvenerek değil, net ve sistematik bir şekilde belirlemek isteyen traderlar için özel olarak geliştirilmiştir. Bu araç, klasik price-action mantığını (yükselen tepeler, düşen dipler) modern breakout algılama ile birleştirerek bir sonraki mantıklı stop seviyesini belirler. Trendlerde, yatay piyasalarda veya hızlı k
RFI levels PRO MT5
Roman Podpora
3.67 (3)
Bu gösterge, fiyat dönüş noktalarını ve fiyat geri dönüş bölgelerini doğru bir şekilde gösterir.       Başlıca oyuncular   . Yeni trendlerin nerede oluştuğunu görüyorsunuz ve her işlem üzerinde kontrolü elinizde tutarak, azami hassasiyetle kararlar alıyorsunuz. TREND LINES PRO   göstergesiyle birlikte kullanıldığında maksimum potansiyelini ortaya koyar.  VERSION MT4 Göstergenin gösterdiği şey: Yeni bir trendin başlangıcında aktivasyonla birlikte tersine dönüş yapıları ve tersine dönüş seviyeler
Order Block Pro (MQL5) – Sürüm 1.0 Yazar: KOUAME N'DA LEMISSA Platform: MetaTrader 5 Açıklama: Order Block Pro , grafiğinizdeki boğa ve ayı emir bloklarını (Order Blocks) otomatik olarak tespit eden gelişmiş bir göstergedir. Konsolidasyon mumlarını ve ardından gelen güçlü impuls mumlarını analiz ederek, fiyatın hızlanabileceği kritik bölgeleri belirler. Bu gösterge, şunları yapmak isteyen traderlar için idealdir: Kesin giriş ve çıkış noktalarını belirlemek Dinamik destek ve direnç bölgelerini t
TREND ÇİZGİLERİ PRO       Piyasanın gerçek yön değiştirdiği noktayı anlamaya yardımcı olur. Gösterge, gerçek trend dönüşlerini ve büyük oyuncuların piyasaya yeniden girdiği noktaları gösterir. Anlıyorsun   BOS hatları   Daha yüksek zaman dilimlerindeki trend değişiklikleri ve önemli seviyeler, karmaşık ayarlar veya gereksiz gürültü olmadan gösterilir. Sinyaller yeniden çizilmez ve çubuk kapandıktan sonra grafikte kalır. MT4 SÜRÜMÜ   -   RFI LEVELS PRO   göstergesiyle   birlikte kullanıldığında m
Top indicator for MT5   providing accurate signals to enter a trade without repainting! It can be applied to any financial assets:   forex, cryptocurrencies, metals, stocks, indices .  Watch  the video  (6:22) with an example of processing only one signal that paid off the indicator! MT4 version is here It will provide pretty accurate trading signals and tell you when it's best to open a trade and close it. Most traders improve their trading results during the first trading week with the help of
ARIPoint
Temirlan Kdyrkhan
ARIPoint is a powerful trading companion designed to generate high-probability entry signals with dynamic TP/SL/DP levels based on volatility. Built-in performance tracking shows win/loss stats, PP1/PP2 hits, and success rates all updated live. Key Features: Buy/Sell signals with adaptive volatility bands Real-time TP/SL/DP levels based on ATR Built-in MA Filter with optional ATR/StdDev volatility Performance stats panel (Success, Profit/Loss, PP1/PP2) Alerts via popup, sound, push, or email Cu
FX Power MT5 NG
Daniel Stein
5 (31)
FX Power: Daha Akıllı Ticaret Kararları için Para Birimlerinin Gücünü Analiz Edin Genel Bakış FX Power , her piyasa koşulunda başlıca para birimlerinin ve altının gerçek gücünü anlamak için vazgeçilmez bir araçtır. Güçlü para birimlerini alıp zayıf olanları satarak, FX Power ticaret kararlarınızı basitleştirir ve yüksek olasılıklı fırsatları ortaya çıkarır. İster trendlere sadık kalın ister Delta'nın aşırı değerlerini kullanarak tersine dönüşleri öngörün, bu araç ticaret tarzınıza mükemmel bir
Market Flow Pro
Gabriele Sabatino
4 (1)
Market Flow Pro Market Flow Pro is an intelligent trading advisor for the MetaTrader 5 platform, designed for automatic trading on financial markets using algorithmic analysis and strict risk management. -Key features: - Fully automatic trading 24/5 - Adaptive trend and momentum entry algorithm -  Built-in risk management - Flexible lot settings (fixed/auto-calculation) - Support for major currency pairs and indices - Optimised for operation on various timeframes  How it works Market
Easy SMC Trading
Israr Hussain Shah
4 (1)
Otomatik Risk/Ödül ve Yapı Kırılması (BOS) Tarayıcılı Yapı Trendi Sürüm: 1.0 Genel Bakış Otomatik Risk/Ödül ile Yapı Trendi, Fiyat Hareketine ve Piyasa Yapısına dayanan yatırımcılar için tasarlanmış kapsamlı bir işlem sistemidir. Yüksek olasılıklı işlem kurulumları oluşturmak için düzeltilmiş bir trend filtresini, Swing Noktası tespiti ve Yapı Kırılması (BOS) sinyalleriyle birleştirir. Bu aracın öne çıkan özelliği Otomatik Risk Yönetimidir. Geçerli bir Yapı Kırılması tespit edildiğinde, göste
Azimuth Pro
Ottaviano De Cicco
5 (4)
LAUNCH PROMO Azimuth Pro price is initially set at 299$ for the first 100 buyers. Final price will be 499$ . THE DIFFERENCE BETWEEN RETAIL AND INSTITUTIONAL ENTRIES ISN'T THE INDICATOR — IT'S THE LOCATION. Most traders enter at arbitrary price levels, chasing momentum or reacting to lagging signals. Institutions wait for price to reach structured levels where supply and demand actually shift. Azimuth Pro maps these levels automatically: swing-anchored VWAP, multi-timeframe structure lines, an
Stratos Pali mt5
Michela Russo
4.5 (8)
Stratos Pali Indicator is a revolutionary tool designed to enhance your trading strategy by accurately identifying market trends. This sophisticated indicator uses a unique algorithm to generate a complete histogram, which records when the trend is Long or Short. When a trend reversal occurs, an arrow appears, indicating the new direction of the trend. Important Information Revealed Leave a review and contact me via mql5 message to receive My Top 5 set files for Stratos Pali at no cost ! Down
FX Dynamic MT5
Daniel Stein
5 (5)
FX Dynamic: Özelleştirilebilir ATR Analiziyle Volatilite ve Trendleri Takip Edin Genel Bakış FX Dynamic , ortalama gerçek aralık (ATR) hesaplamalarını kullanarak günlük ve gün içi volatilite hakkında rakipsiz bilgiler sağlayan güçlü bir araçtır. 80%, 100%, 130% gibi net volatilite eşikleri ayarlayarak, piyasa olağan hareketlerinin ötesine geçtiğinde hızlı şekilde uyarı alabilir ve potansiyel kazanç fırsatlarını süratle tespit edebilirsiniz. FX Dynamic , brokerınızın zaman dilimine uyum sağlaya
Market Structure Order Block Dashboard MT5 , MT5 için bir indikatördür . Piyasa yapısı ve ICT / Smart Money Concepts yaklaşımına odaklanır: HH/HL/LH/LL , BOS , ChoCH , ayrıca Order Blocks , Fair Value Gaps (FVG) , likidite (EQH/EQL, sweeps), seanslar / Kill Zones ve entegre Volume Profile ile kompakt bir confluence dashboard sunar. Önemli: Bu bir analiz aracıdır . İşlem açmaz (EA değildir). Alıcı Bonusu Satın aldıktan sonra mağazamdan seçerek 2 bonus indikatör ücretsiz alabilirsiniz. Bonusları
Trend Forecaster
Alexey Minkov
5 (7)
The Trend Forecaster indicator utilizes a unique proprietary algorithm to determine entry points for a breakout trading strategy. The indicator identifies price clusters, analyzes price movement near levels, and provides a signal when the price breaks through a level. The Trend Forecaster indicator is suitable for all financial assets, including currencies (Forex), metals, stocks, indices, and cryptocurrencies. You can also adjust the indicator to work on any time frames, although it is recommen
FX Levels MT5
Daniel Stein
5 (13)
FX Levels: Tüm Piyasalar İçin Son Derece Hassas Destek ve Direnç Hızlı Bakış Döviz kurları, endeksler, hisseler veya emtialar gibi herhangi bir piyasada güvenilir destek ve direnç seviyeleri belirlemek mi istiyorsunuz? FX Levels geleneksel “Lighthouse” yöntemini ileri düzey bir dinamik yaklaşımla birleştirerek neredeyse evrensel bir doğruluk sağlar. Gerçek broker deneyimimize ve otomatik günlük güncellemeler ile gerçek zamanlı güncellemelerin birleşimine dayalı olarak, FX Levels size dönüş nok
Yazarın diğer ürünleri
Candle Timer Countdown displays the remaining time before the current bar closes and a new bar forms. It can be used for time management. MT4 version here! Feature Highlights Tracks server time not local time Configurable Text Color and Font Size Optional Visualization of the Symbol Daily Variation Optimized to reduce CPU usage Input Parameters Show Daily Variation: true/false Text Font Size Text Color If you still have questions, please contact me by direct message:  https://www.mql5.com/en/u
FREE
MACD Gün İçi Trend, 1960'larda Gerald Appel tarafından oluşturulan orijinal MACD'nin uyarlanmasıyla geliştirilen bir Göstergedir. Yıllarca süren ticaret boyunca, MACD'nin parametrelerini Fibonacci oranlarıyla değiştirerek, trend hareketlerinin sürekliliğini daha iyi bir şekilde sunduğumuz ve bir fiyat trendinin başlangıcını ve sonunu daha verimli bir şekilde tespit etmeyi mümkün kıldığımız gözlemlendi. Fiyat trendlerini tespit etmedeki verimliliği sayesinde, aynı zamanda tepe ve dip farklarını
FREE
Candle Timer Countdown displays the remaining time before the current bar closes and a new bar forms. It can be used for time management. MT5 version here! Feature Highlights Tracks server time not local time Configurable Text Color and Font Size Optional Visualization of the Symbol Daily Variation Optimized to reduce CPU usage Input Parameters Show Daily Variation: true/false Text Font Size Text Color If you still have questions, please contact me by direct message:  https://www.mql5.com/en/u
FREE
Setup Tabajara, "The OGRO of Wall Street" olarak bilinen Brezilyalı bir tüccar tarafından oluşturuldu. Bu kurulumun fikri, tüccara fiyatların mevcut eğilimini ve grafikte aranması gereken işlem türünü belirtmektir. Operasyon Bunu, mumları ve VWAP'yi saat 10:40'a kadar ve sonrasında 20 periyodun aritmetik ortalaması ile mumları 4 olası renkte boyayarak konumlandırarak yapar: Yeşil -> Yükselen trendde yükselen fiyat (SATIN ALMA için giriş noktalarını arayın) Siyah -> Boğa Trendinde fiyat düzelt
FREE
Pivot Point Fibo RSJ, Fibonacci oranlarını kullanarak günün destek ve direnç çizgilerini izleyen bir göstergedir. Bu muhteşem gösterge, Fibonacci oranlarını kullanarak Pivot Point üzerinden 7 seviyeye kadar destek ve direnç oluşturur. Fiyatların, bir operasyonun olası giriş/çıkış noktalarını algılamanın mümkün olduğu bu destek ve direncin her bir düzeyine uyması harika. Özellikleri 7 seviyeye kadar destek ve 7 seviye direnç Seviyelerin renklerini ayrı ayrı ayarlayın Girişler Pivot Tipi Pivo
FREE
Candle Counter is an indicator that prints the number of candles from the first candle of the day . The first candle of the day will be the number 1 and each new candle will be increased by 1 in this count. Input Parameters Choose from even, odd or all Distance from candle to Print the number Text Font Size Text Font Color If you still have questions, please contact me by direct message:  https://www.mql5.com/en/users/robsjunqueira/
FREE
VWAP Fibo Bands RSJ is an indicator that traces the lines of the daily VWAP and from it creates bands using Fibonacci proportions. This spectacular indicator creates 10 band levels through the selected VWAP period using Fibonacci ratios. It is fantastic how the prices respect each level of the bands, where it is possible to realize that almost every time the price closes above / below a level of the bands he will seek the next one. If close above will seek to reach the level above and if close
FREE
MACD Gün İçi Trend PRO, 1960'larda Gerald Appel tarafından oluşturulan orijinal MACD'nin uyarlanmasıyla geliştirilen bir Göstergedir. Yıllarca süren ticaret sayesinde, MACD'nin parametrelerini Fibonacci oranlarıyla değiştirerek, trend hareketlerinin sürekliliğinin daha iyi bir sunumunu sağladığımız ve bir fiyat trendinin başlangıcını ve sonunu daha verimli bir şekilde tespit etmeyi mümkün kıldığımız gözlemlendi. Fiyat trendlerini tespit etmedeki etkinliği sayesinde, üst ve dip farklarını çok
MACD Gün İçi Trend, 1960'larda Gerald Appel tarafından oluşturulan orijinal MACD'nin uyarlanmasıyla geliştirilen bir Göstergedir. Yıllarca süren ticaret boyunca, MACD'nin parametrelerini Fibonacci oranlarıyla değiştirerek, trend hareketlerinin sürekliliğini daha iyi bir şekilde sunduğumuz ve bir fiyat trendinin başlangıcını ve sonunu daha verimli bir şekilde tespit etmeyi mümkün kıldığımız gözlemlendi. Fiyat trendlerini tespit etmedeki verimliliği sayesinde, aynı zamanda tepe ve dip farklarını
FREE
Pivot Point Fibo RSJ, Fibonacci oranlarını kullanarak günün destek ve direnç çizgilerini izleyen bir göstergedir. Bu muhteşem gösterge, Fibonacci oranlarını kullanarak Pivot Point üzerinden 7 seviyeye kadar destek ve direnç oluşturur. Fiyatların, bir operasyonun olası giriş/çıkış noktalarını algılamanın mümkün olduğu bu destek ve direncin her bir düzeyine uyması harika. Özellikleri 7 seviyeye kadar destek ve 7 seviye direnç Seviyelerin renklerini ayrı ayrı ayarlayın Girişler Pivot Tipi Pivo
FREE
Weis Waves RSJ
JETINVEST
4.56 (9)
The Weis Waves RSJ Indicator sums up volumes in each wave. This is how we receive a bar chart of cumulative volumes of alternating waves. Namely the cumulative volume makes the Weis wave charts unique. It allows comparing the relation of the wave sequence characteristics, such as correspondence of the applied force (expressed in the volume) and received result (the price progress). If you still have questions, please contact me by direct message:  https://www.mql5.com/en/users/robsjunqueira/
FREE
This indicator calculates the difference between the SELL aggression and the BUY aggression that occurred in each Candle, plotting the balance of each one graphically. Note: This indicator DOES NOT WORK for Brokers and/or Markets WITHOUT the type of aggression (BUY or SELL). Be sure to try our   Professional   version with configurable features and alerts:   Delta Agression Volume PRO Settings Aggression by volume (Real Volume) or by number of trades (Tick Volume) Start of the Aggression Delta
FREE
Vwap RSJ
JETINVEST
4.8 (10)
VWAP RSJ is an indicator that plots the Hourly, Daily, Weekly and Monthly  VWAP Lines. Large institutional buyers and   mutual funds   use the VWAP ratio to help move into or out of stocks with as small of a market impact as possible. Therefore, when possible, institutions will try to buy below the VWAP, or sell above it. This way their actions push the price back toward the average, instead of away from it. Based on this information I developed this indicator that combines 4 types of VWAP Tim
FREE
This simple indicator paints with a darker color on the volume bar when the quantity traded is above the average of select number of periods of the volume itself, highlighting the moments when there was a large volume of deals above the average. It is also possible to use a configuration of four colors where the color tone shows a candle volume strength. The indicator defaults to the simple average of 20 periods, but it is possible to change to other types of averages and periods. If you like t
FREE
This indicator sums up the difference between the sells aggression and the buys aggression that occurred in each Candle, graphically plotting the waves of accumulation of the aggression volumes.   Through these waves an exponential average is calculated that indicates the direction of the business flow. Note: This indicator DOES NOT WORK for Brokers and/or Markets WITHOUT the type of aggression (BUY or SELL).   Be sure to try our Professional version with configurable features and alerts:  Agre
FREE
Funcionamento: O Painel  Netting Panel RSJ  funciona com   qualquer ativo   e em   qualquer tempo gráfico . Ele funciona em contas do tipo " Netting " e " Hedge ", mas gerencia apenas uma posição por ativo, por isso o nome   Netting.   Se ele for executado em contas do tipo " Hedge ", ele fará o gerenciamento e proteção   apenas da posição mais antiga , ou seja, da primeira posição que foi aberta por ele. Em contas " Netting " quando os botões " SELL " ou " BUY " forem pressionados,   ocorrerá
FREE
This simple indicator paints with a darker color on the volume bar when the quantity traded is above the average of select number of periods of the volume itself, highlighting the moments when there was a large volume of deals above the average. It is also possible to use a configuration of four colors where the color tone shows a candle volume strength. The indicator defaults to the simple average of 20 periods, but it is possible to change to other types of averages and periods. If you like t
FREE
MACD Gün İçi Trend PRO, 1960'larda Gerald Appel tarafından oluşturulan orijinal MACD'nin uyarlanmasıyla geliştirilen bir Göstergedir. Yıllarca süren ticaret sayesinde, MACD'nin parametrelerini Fibonacci oranlarıyla değiştirerek, trend hareketlerinin sürekliliğinin daha iyi bir sunumunu sağladığımız ve bir fiyat trendinin başlangıcını ve sonunu daha verimli bir şekilde tespit etmeyi mümkün kıldığımız gözlemlendi. Fiyat trendlerini tespit etmedeki etkinliği sayesinde, üst ve dip farklarını çok
RENKO PRICE ACTION ATR is an "Expert Advisor" developed through the construction of the Renko Chart where each BRICK has the size calculated through the ATR of the period selected by the user. Renko charts are designed to filter out minor price movements, thus making it easier for traders to focus on important trends. Due to its efficiency in detecting price trends, it is also possible to clearly identify supports and resistances as well as top and bottom divergences, thus making better use of t
The indicator Supply Demand RSJ PRO calculates and plots the "Supply" and "Demand" zones on the graph, identifying the type of Zone (Weak, Strong, Verified, Proven) and in case of retests of the Zone it shows how many times it was retested. "Supply" Zones are the price zones where more supply than demand has occurred, driving prices down. "Demand" Zones are the price zones where more demand than supply has occurred, pushing prices up. Be sure to try our professional version with configurable fe
Aggression Wave PRO is an indicator developed to monitor the divergence, strength, and continuity of the aggression volume of sell and buy negotiations.  The  Agrression Wave PRO   has features that allow you to view beyond the accumulated delta volume of the day. Note: This indicator DOES NOT WORK for Brokers and/or Markets WITHOUT the type of aggression (BUY or SELL). Cryptocurrencies and Forex do not provide this type of information, that is, it does not work with it. Operation It is possib
Delta Aggression Volume PRO is an indicator developed to monitor the strength and continuity of the aggression volume of sell and buy negotiations. Note: This indicator DOES NOT WORK for Brokers and/or Markets WITHOUT the type of aggression (BUY or SELL). Cryptocurrencies and Forex do not provide this type of data, that is, it does not work with them. O Delta Agrression Volume PRO has features that allow you to view beyond the delta volume of the day. Operation Multi symbols  (those who provid
The indicator Supply Demand RSJ PRO calculates and plots the "Supply" and "Demand" zones on the graph, identifying the type of Zone (Weak, Strong, Verified, Proven) and in case of retests of the Zone it shows how many times it was retested. "Supply" Zones are the price zones where more supply than demand has occurred, driving prices down. "Demand" Zones are the price zones where more demand than supply has occurred, pushing prices up. Classification of zones Weak: Price region which, if re-test
Trend WDO B3, MT5 platformu için oluşturulmuş ve BREZİLYA'da B3'te MINI DOLAR INDEX (WDO) ile çalışmak üzere optimize edilmiş profesyonel bir ticaret sistemidir. Sistem, yapılan hesaplamalara göre her zaman diliminde ağırlıklar uygulayarak fiyat trendini belirlemek için birkaç zaman diliminde (1M, 5M, 15M, 30M, H1, H4, D1) Bulanık Mantık kullanır. Trendi belirledikten sonra, sistem ortalama oynaklığa göre bir STOP emri (AL veya SATIŞ) konumlandırır ve pozisyon açıldığında, EA, her zaman karı m
Trend WIN B3, MT5 platformu için oluşturulmuş ve BREZİLYA'da B3'te MINI FUTURE INDEX (WIN) ile çalışmak üzere optimize edilmiş profesyonel bir ticaret sistemidir. Sistem, yapılan hesaplamalara göre her zaman diliminde ağırlıklar uygulayarak fiyat trendini belirlemek için birkaç zaman diliminde (1M, 5M, 15M, 30M, H1, H4, D1) Bulanık Mantık kullanır. Trendi belirledikten sonra, sistem ortalama oynaklığa göre bir STOP emri (AL veya SATIŞ) konumlandırır ve pozisyon açıldığında, EA, her zaman karı
EA, ne zaman ticaret yapılacağına karar vermek için oynaklık, yayılma, sıklık ve zamanlamayı kullanır. EA, Pozisyonları açmak için Limit Emirleri yöntemini kullanır. Bu durumda, Kayma, girişlerin yürütülmesinde en fazla olumlu olacaktır. EA, sistemin odak noktası sermayenizi korurken para kazanmak olduğundan, Takip Edilen Kâr Al mantığını kullanır. Çoğu ticaret, bir keskin nişancı vesikalığı gibi, hızlı bir şekilde kapatılır. Ana Özellikler martingal kullanmaz ızgara kullanmaz Optimize edilmiş
EA, ne zaman ticaret yapılacağına karar vermek için oynaklık, yayılma, sıklık ve zamanlamayı kullanır. EA, Pozisyonları açmak için Limit Emirleri yöntemini kullanır. Bu durumda, Kayma, girişlerin yürütülmesinde en fazla olumlu olacaktır. EA, sistemin odak noktası sermayenizi korurken para kazanmak olduğundan, Takip Edilen Kâr Al mantığını kullanır. Çoğu ticaret, bir keskin nişancı vesikalığı gibi, hızlı bir şekilde kapatılır. Ana Özellikler martingal kullanmaz ızgara kullanmaz Optimize edilmi
Filtrele:
Luiz
16
Luiz 2026.03.03 11:42 
 

Muito bom

JETINVEST
366335
Geliştiriciden yanıt Roberto Sant Ana Junqueira 2026.03.04 17:53
Obrigado pelo review
antoniossergio
29
antoniossergio 2025.03.13 20:39 
 

Excelente

JETINVEST
366335
Geliştiriciden yanıt Roberto Sant Ana Junqueira 2025.03.14 10:33
Obrigado pelo review
Irusel
704
Irusel 2024.10.29 21:21 
 

Отлично

Jocimar Lopes
5075
Jocimar Lopes 2023.08.09 02:16 
 

It is working smoothly here. Very useful. Thank you for sharing!

JETINVEST
366335
Geliştiriciden yanıt Roberto Sant Ana Junqueira 2023.08.09 11:54
tks....enjoy
goldenjumper
47
goldenjumper 2022.11.17 12:14 
 

Ferramenta excelente! Estou testando junto com MACD e estou tendo resultados positivos. Sinto falta só dos alarmes, acho que seria a "cereja do bolo". Trabalho em homeoffice e tenho um monitor ao meu lado dedicado para acompanhar o trading, então, um alarme tocando quando os candles ficarem vermelhos (sell) ou verdes (buy) com mensagens em popup na tela iriam ajudar muito. Roberto, conseguiria implementar isso? Abraços e parabéns!

JETINVEST
366335
Geliştiriciden yanıt Roberto Sant Ana Junqueira 2022.11.17 13:18
obrigado pelo review e por suas sugestões, mas os produtos gratuitos estão limitados com as funcionalidades publicadas.
Carlos_Maia
65
Carlos_Maia 2022.09.11 17:35 
 

Achei o indicador razoável, porém as 04 médias deixam a tela muito poluída.

JETINVEST
366335
Geliştiriciden yanıt Roberto Sant Ana Junqueira 2022.09.11 17:46
É só você desabilitar as médias que não quer ver.....e de nada por ter disponibilizado gratuitamente
trillas
22
trillas 2022.08.13 17:52 
 

Estoy usando ahora mismo muy buena👌🏻👌🏻

JETINVEST
366335
Geliştiriciden yanıt Roberto Sant Ana Junqueira 2022.08.13 18:15
Obrigado. Você esqueceu de classificar com as estrelas
silva123
64
silva123 2022.08.04 00:54 
 

Ótimo.recomendo.

JETINVEST
366335
Geliştiriciden yanıt Roberto Sant Ana Junqueira 2022.08.04 00:59
Obrigado. Da uma olhada em todos os nossos indicadores
MetaMINDfx33
24
MetaMINDfx33 2022.07.24 05:37 
 

Kullanıcı incelemeye herhangi bir yorum bırakmadı

JETINVEST
366335
Geliştiriciden yanıt Roberto Sant Ana Junqueira 2022.07.24 14:41
Enjoy
DDDD7777777PPPP
104
DDDD7777777PPPP 2022.05.22 12:44 
 

Muito Bom!

JETINVEST
366335
Geliştiriciden yanıt Roberto Sant Ana Junqueira 2022.07.24 14:41
Obrigado
sanobalano
99
sanobalano 2022.04.28 10:42 
 

Very happy, Thank you

JETINVEST
366335
Geliştiriciden yanıt Roberto Sant Ana Junqueira 2022.07.24 14:41
Enjoy
xlxAxlx
1493
xlxAxlx 2022.04.16 11:58 
 

Thanks,,,

JETINVEST
366335
Geliştiriciden yanıt Roberto Sant Ana Junqueira 2022.07.24 14:40
Enjoy
Pavel048
310
Pavel048 2021.11.23 05:57 
 

Говно.

marcospauloamaral
14
marcospauloamaral 2021.11.12 17:05 
 

Excelente!

Valtenir Maxuel Medeiros
40
Valtenir Maxuel Medeiros 2021.09.12 12:36 
 

Excelente!!! Parabéns!!!

JETINVEST
366335
Geliştiriciden yanıt Roberto Sant Ana Junqueira 2021.09.12 15:05
Obrigado
Fabio_Novaes
175
Fabio_Novaes 2021.06.30 21:43 
 

Kullanıcı incelemeye herhangi bir yorum bırakmadı

JETINVEST
366335
Geliştiriciden yanıt Roberto Sant Ana Junqueira 2021.06.30 23:10
tks
Zé Roberto
667
Zé Roberto 2021.04.06 23:04 
 

MUITO BOM

JETINVEST
366335
Geliştiriciden yanıt Roberto Sant Ana Junqueira 2021.06.30 16:04
Tks for your review.
Marilise Ravaglio Da Cunha Junqueira
386
 

Kullanıcı incelemeye herhangi bir yorum bırakmadı

JETINVEST
366335
Geliştiriciden yanıt Roberto Sant Ana Junqueira 2021.06.30 16:04
Tks for your review.
İncelemeye yanıt