
MQL5 细则手册:在单一窗口中监控多个时间表
简介
选择建仓方向时,同时显示的带有多个时间表的价格图表可能会非常有用。MetaTrader 5 客户端提供 21 个时间表用于分析。您可以利用能置于现有图表上的特殊图表对象,并在相应位置设置交易品种、时间表及其他属性。您可以添加任何数量的该类图表对象,但如果通过手工完成,将会非常不便且费时。而且,并不是所有图表属性都可进行人工设置。
我们可通过本文对此类图形对象进行深入了解。为方便说明,我们将使用控件(按钮)创建指标,以便同时在子窗口中建立多个图表对象。此外,图表对象将准确置于子窗口中,并随主图表或终端窗口的大小调整自动进行校正。
除添加图表对象的按钮外,还有用以启动/禁用部分图表属性的按钮,包括只能通过编程方式进行修改的按钮。
开发
您可通过插入菜单->对象->图形对象->图表手动添加图表对象。例如,以下为带H4和D1时间表的对象在 1 小时图表上的显示:
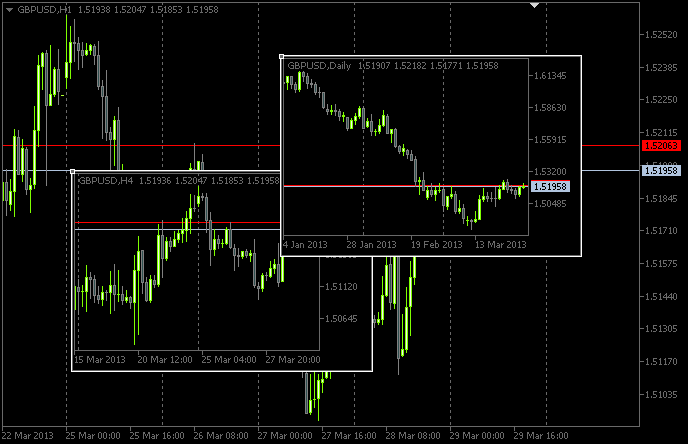
图 1. 图表对象:
修改对象参数,您仅可控制有限数量的属性:
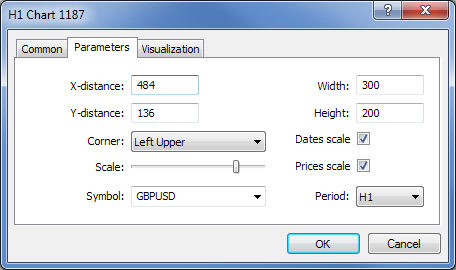
图 2. 图表对象属性
然而,如买价和卖价价位、图表右侧的缩进、交易价位等参数仅在相应编程的情况下显示。
因此,我们开始开发指标。比如,我们称之为ChartObjects (文章暂定标题)。使用 MQL5 向导,在 MetaEditor 中创建指标模板。选择自定义指标程序的事件处理程序时,选择以下屏幕截图中显示的程序:
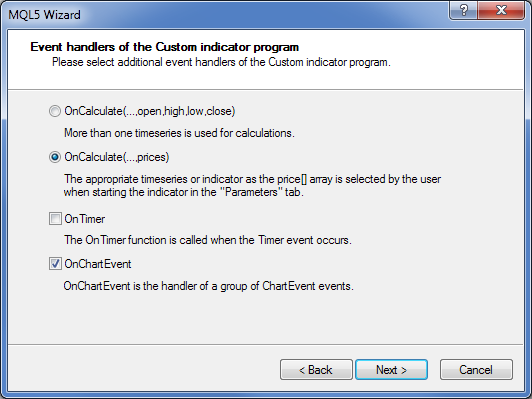
图 3. 指标的事件处理程序
在 MetaEditor 中打开时,模板源代码将呈现如下结果:
//+------------------------------------------------------------------+
//|                                                 ChartObjects.mq5 |
//|                        Copyright 2013, MetaQuotes Software Corp. |
//|                                              http://www.mql5.com |
//+------------------------------------------------------------------+
#property copyright "Copyright 2013, MetaQuotes Software Corp."
#property link      "http://www.mql5.com"
#property version   "1.00"
#property indicator_chart_window
//+------------------------------------------------------------------+
//| Custom indicator initialization function                         |
//+------------------------------------------------------------------+
int OnInit()
  {
//--- indicator buffers mapping

//---
   return(INIT_SUCCEEDED);
  }
//+------------------------------------------------------------------+
//| Custom indicator iteration function                              |
//+------------------------------------------------------------------+
int OnCalculate(const int rates_total,
                const int prev_calculated,
                const int begin,
                const double &price[])
  {
//---

//--- return value of prev_calculated for next call
   return(rates_total);
  }
//+------------------------------------------------------------------+
//| TradeTransaction function                                        |
//+------------------------------------------------------------------+
void OnTradeTransaction(const MqlTradeTransaction& trans,
                        const MqlTradeRequest& request,
                        const MqlTradeResult& result)
  {
//---

  }
//+------------------------------------------------------------------+
//| ChartEvent function                                              |
//+------------------------------------------------------------------+
void OnChartEvent(const int id,
                  const long &lparam,
                  const double &dparam,
                  const string &sparam)
  {
//---

  }
//+------------------------------------------------------------------+
在该实施中,我们基本不需要OnCalculate()功能,但是没有它则不能编译指标。此外,我们需要一项主要功能 - OnDeinit()。它将监视图表中的程序删除。模板初级处理后,我们得到以下源代码:
//+------------------------------------------------------------------+
//|                                                 ChartObjects.mq5 |
//|                        Copyright 2013, MetaQuotes Software Corp. |
//|                                              http://www.mql5.com |
//+------------------------------------------------------------------+
#property copyright "Copyright 2013, MetaQuotes Software Corp."
#property link      "http://www.mql5.com"
#property version   "1.00"
//---
#property indicator_chart_window // Indicator is in the main window
#property indicator_plots 0      // Zero plotting series
//+------------------------------------------------------------------+
//| Custom indicator initialization function                         |
//+------------------------------------------------------------------+
int OnInit()
  {
//--- Set the short name for the indicator
   IndicatorSetString(INDICATOR_SHORTNAME,"TimeFramesPanel");
//--- Initialization completed successfully
   return(INIT_SUCCEEDED);
  }
//+------------------------------------------------------------------+
//| Indicator deinitialization                                       |
//+------------------------------------------------------------------+
void OnDeinit(const int reason)
  {
//--- If the indicator has been deleted from the chart
   if(reason==REASON_REMOVE)
     {
     }
  }
//+------------------------------------------------------------------+
//| Custom indicator iteration function                              |
//+------------------------------------------------------------------+
int OnCalculate(const int rates_total,
                const int prev_calculated,
                const int begin,
                const double &price[])
  {
//---

//--- return value of prev_calculated for next call
   return(rates_total);
  }
//+------------------------------------------------------------------+
//| ChartEvent function                                              |
//+------------------------------------------------------------------+
void OnChartEvent(const int id,
                  const long &lparam,
                  const double &dparam,
                  const string &sparam)
  {
//---

  }
//+------------------------------------------------------------------+
现在,我们需要创建用于储存(子窗口)图表对象的指标。从根本而言,其为虚拟指标。我们称其为 SubWindow。其代码如下:
//+------------------------------------------------------------------+
//|                                                    SubWindow.mq5 |
//|                        Copyright 2013, MetaQuotes Software Corp. |
//|                                              http://www.mql5.com |
//+------------------------------------------------------------------+
#property copyright "Copyright 2013, MetaQuotes Software Corp."
#property link      "http://www.mql5.com"
#property version   "1.00"
//---
#property indicator_chart_window // Indicator is in the subwindow
#property indicator_plots 0      // Zero plotting series
//+------------------------------------------------------------------+
//| Custom indicator initialization function                         |
//+------------------------------------------------------------------+
int OnInit()
  {
//--- Set the short name for the indicator
   IndicatorSetString(INDICATOR_SHORTNAME,"SubWindow");
//--- Initialization completed successfully
   return(INIT_SUCCEEDED);
  }
//+------------------------------------------------------------------+
//| Custom indicator iteration function                              |
//+------------------------------------------------------------------+
int OnCalculate(const int rates_total,
                const int prev_calculated,
                const int begin,
                const double &price[])
  {
//---

//--- return value of prev_calculated for next call
   return(rates_total);
  }
//+------------------------------------------------------------------+
编译后,SubWindow.ex5 指标将作为资源存储在 ChartObjects.ex5 内。所以程序开发人员最终仅能为终端用户提供一个文件而非两个。
之前已经在名为 “MQL5 细则手册:MetaTrader 5 交易事件中的声音通知”的文章中描述过,资源文件可包含在使用 #resource 指令的程序中。在 ChartObjects 程序开始处,我们需要添加以下代码字符串:
//--- Include indicator resource
#resource "\\Indicators\\SubWindow.ex5"
之后,使用 #define 指令设置数组尺寸,将数组归类为控件:
//--- Number of time frame buttons
#define TIMEFRAME_BUTTONS 21
//--- Number of buttons for chart object properties
#define PROPERTY_BUTTONS 5
照常在程序开始处声明全局变量:
//--- Location of the SubWindow indicator in the resource
string subwindow_path         ="::Indicators\\SubWindow.ex5";
int    subwindow_number       =-1;               // Subwindow number
int    subwindow_handle       =INVALID_HANDLE;   // SubWindow indicator handle
string subwindow_shortname    ="SubWindow";      // Short name of the indicator
//---
int    chart_width            =0;                // Chart width
int    chart_height           =0;                // Chart height
int    chart_scale            =0;                // Chart scale
//---
color  cOffButtonFont         =clrWhite;         // Unclicked button text color
color  cOffButtonBackground   =clrDarkSlateGray; // Unclicked button background color
color  cOffButtonBorder       =clrLightGray;     // Unclicked button border color
//---
color  cOnButtonFont          =clrGold;          // Clicked button text color
color  cOnButtonBackground    =C'28,47,47';      // Clicked button background color
color  cOnButtonBorder        =clrLightGray;     // Clicked button border color
之后,为时间表按钮声明数组:
//--- Array of object names for time frame buttons
string timeframe_button_names[TIMEFRAME_BUTTONS]=
  {
   "button_M1","button_M2","button_M3","button_M4","button_M5","button_M6","button_M10",
   "button_M12","button_M15","button_M20","button_M30","button_H1","button_H2","button_H3",
   "button_H4","button_H6","button_H8","button_H12","button_D1","button_W1","button_MN"
  };
//--- Array of text displayed on time frame buttons
string timeframe_button_texts[TIMEFRAME_BUTTONS]=
  {
   "M1","M2","M3","M4","M5","M6","M10",
   "M12","M15","M20","M30","H1","H2","H3",
   "H4","H6","H8","H12","D1","W1","MN"
  };
//--- Array of time frame button states
bool timeframe_button_states[TIMEFRAME_BUTTONS]={false};
控制图表对象属性的按钮数组:
//--- Array of object names for buttons of chart properties
string property_button_names[PROPERTY_BUTTONS]=
  {
   "property_button_date","property_button_price",
   "property_button_ohlc","property_button_askbid",
   "property_button_trade_levels"
  };
//--- Array of text displayed on buttons of chart properties
string property_button_texts[PROPERTY_BUTTONS]=
  {
   "Date","Price","OHLC","Ask / Bid","Trade Levels"
  };
//--- Array of states for buttons of chart properties
bool property_button_states[PROPERTY_BUTTONS]={false};

//--- Array of sizes for buttons of chart properties
int property_button_widths[PROPERTY_BUTTONS]=
  {
   66,68,66,100,101
  };
最后,得到图表对象名称数组:
//--- Array of chart object names
string chart_object_names[TIMEFRAME_BUTTONS]=
  {
   "chart_object_m1","chart_object_m2","chart_object_m3","chart_object_m4","chart_object_m5","chart_object_m6","chart_object_m10",
   "chart_object_m12","chart_object_m15","chart_object_m20","chart_object_m30","chart_object_h1","chart_object_h2","chart_object_h3",
   "chart_object_h4","chart_object_h6","chart_object_h8","chart_object_h12","chart_object_d1","chart_object_w1","chart_object_mn"
  };
在开始处理需要与图形对象进行互动的函数前,让我们先编写创建图表对象的函数。在程序中,我们需要两种图形对象:OBJ_BUTTON 和 OBJ_CHART。
将通过 CreateButton() 函数创建按钮:
//+------------------------------------------------------------------+
//| Creating the Button object                                       |
//+------------------------------------------------------------------+
void CreateButton(long              chart_id,         // chart id
                  int               window_number,    // window number
                  string            name,             // object name
                  string            text,             // displayed name
                  ENUM_ANCHOR_POINT anchor,           // anchor point
                  ENUM_BASE_CORNER  corner,           // chart corner
                  string            font_name,        // font
                  int               font_size,        // font size
                  color             font_color,       // font color
                  color             background_color, // background color
                  color             border_color,     // border color
                  int               x_size,           // width
                  int               y_size,           // height
                  int               x_distance,       // X-coordinate
                  int               y_distance,       // Y-coordinate
                  long              z_order)          // Z-order
  {
//--- If the object has been created successfully
   if(ObjectCreate(chart_id,name,OBJ_BUTTON,window_number,0,0))
     {
      // set its properties
      ObjectSetString(chart_id,name,OBJPROP_TEXT,text);                  // setting name
      ObjectSetString(chart_id,name,OBJPROP_FONT,font_name);             // setting font
      ObjectSetInteger(chart_id,name,OBJPROP_COLOR,font_color);          // setting font color
      ObjectSetInteger(chart_id,name,OBJPROP_BGCOLOR,background_color);  // setting background color
      ObjectSetInteger(chart_id,name,OBJPROP_BORDER_COLOR,border_color); // setting border color
      ObjectSetInteger(chart_id,name,OBJPROP_ANCHOR,anchor);             // setting anchor point
      ObjectSetInteger(chart_id,name,OBJPROP_CORNER,corner);             // setting chart corner
      ObjectSetInteger(chart_id,name,OBJPROP_FONTSIZE,font_size);        // setting font size
      ObjectSetInteger(chart_id,name,OBJPROP_XSIZE,x_size);              // setting width
      ObjectSetInteger(chart_id,name,OBJPROP_YSIZE,y_size);              // setting height
      ObjectSetInteger(chart_id,name,OBJPROP_XDISTANCE,x_distance);      // setting X-coordinate
      ObjectSetInteger(chart_id,name,OBJPROP_YDISTANCE,y_distance);      // setting Y-coordinate
      ObjectSetInteger(chart_id,name,OBJPROP_SELECTABLE,false);          // object is not available for selection
      ObjectSetInteger(chart_id,name,OBJPROP_STATE,false);               // button state (clicked/unclicked)
      ObjectSetInteger(chart_id,name,OBJPROP_ZORDER,z_order);            // Z-order for getting the click event
      ObjectSetString(chart_id,name,OBJPROP_TOOLTIP,"\n");               // no tooltip
     }
  }
相应地,将使用 CreateChartInSubwindow() 函数在子窗口中创建图表:
//+------------------------------------------------------------------+
//| Creating a chart object in a subwindow                           |
//+------------------------------------------------------------------+
void CreateChartInSubwindow(int             window_number,  // subwindow number
                            int             x_distance,     // X-coordinate
                            int             y_distance,     // Y-coordinate
                            int             x_size,         // width
                            int             y_size,         // height
                            string          name,           // object name
                            string          symbol,         // symbol
                            ENUM_TIMEFRAMES timeframe,      // time frame
                            int             subchart_scale, // bar scale
                            bool            show_dates,     // show date scale
                            bool            show_prices,    // show price scale
                            bool            show_ohlc,      // show OHLC prices
                            bool            show_ask_bid,   // show ask/bid levels
                            bool            show_levels,    // show trade levels
                            string          tooltip)        // tooltip
  {
//--- If the object has been created successfully
   if(ObjectCreate(0,name,OBJ_CHART,window_number,0,0))
     {
      //--- Set the properties of the chart object
      ObjectSetInteger(0,name,OBJPROP_CORNER,CORNER_LEFT_UPPER);   // chart corner
      ObjectSetInteger(0,name,OBJPROP_XDISTANCE,x_distance);       // X-coordinate
      ObjectSetInteger(0,name,OBJPROP_YDISTANCE,y_distance);       // Y-coordinate
      ObjectSetInteger(0,name,OBJPROP_XSIZE,x_size);               // width
      ObjectSetInteger(0,name,OBJPROP_YSIZE,y_size);               // height
      ObjectSetInteger(0,name,OBJPROP_CHART_SCALE,subchart_scale); // bar scale
      ObjectSetInteger(0,name,OBJPROP_DATE_SCALE,show_dates);      // date scale
      ObjectSetInteger(0,name,OBJPROP_PRICE_SCALE,show_prices);    // price scale
      ObjectSetString(0,name,OBJPROP_SYMBOL,symbol);               // symbol
      ObjectSetInteger(0,name,OBJPROP_PERIOD,timeframe);           // time frame
      ObjectSetString(0,name,OBJPROP_TOOLTIP,tooltip);             // tooltip
      ObjectSetInteger(0,name,OBJPROP_BACK,false);                 // object in the foreground
      ObjectSetInteger(0,name,OBJPROP_SELECTABLE,false);           // object is not available for selection
      ObjectSetInteger(0,name,OBJPROP_COLOR,clrWhite);             // white color
      //--- Get the chart object identifier
      long subchart_id=ObjectGetInteger(0,name,OBJPROP_CHART_ID);
      //--- Set the special properties of the chart object
      ChartSetInteger(subchart_id,CHART_SHOW_OHLC,show_ohlc);           // OHLC
      ChartSetInteger(subchart_id,CHART_SHOW_TRADE_LEVELS,show_levels); // trade levels
      ChartSetInteger(subchart_id,CHART_SHOW_BID_LINE,show_ask_bid);    // bid level
      ChartSetInteger(subchart_id,CHART_SHOW_ASK_LINE,show_ask_bid);    // ask level
      ChartSetInteger(subchart_id,CHART_COLOR_LAST,clrLimeGreen);       // color of the level of the last executed deal
      ChartSetInteger(subchart_id,CHART_COLOR_STOP_LEVEL,clrRed);       // color of Stop order levels
      //--- Refresh the chart object
      ChartRedraw(subchart_id);
     }
  }
在以上代码中,首先为图表对象设置标准图表属性。获得图表对象标识符后,设置了特殊属性。图表对象标识符传递给 ChartRedraw() 函数,以该函数刷新图表对象也非常重要。
让我们给以下两种函数的控件设置进行分类:AddTimeframeButtons() 和 AddPropertyButtons():
//+------------------------------------------------------------------+
//| Adding time frame buttons                                        |
//+------------------------------------------------------------------+
void AddTimeframeButtons()
  {
   int x_dist =1;   // Indent from the left side of the chart
   int y_dist =125; // Indent from the bottom of the chart
   int x_size =28;  // Button width
   int y_size =20;  // Button height
//---
   for(int i=0; i<TIMEFRAME_BUTTONS; i++)
     {
      //--- If 7 buttons have already been added to the same row, set the coordinates for the next row
      if(i%7==0)
        {
         x_dist=1;
         y_dist-=21;
        }
      //--- Add a time frame button
      CreateButton(0,0,timeframe_button_names[i],timeframe_button_texts[i],
                   ANCHOR_LEFT_LOWER,CORNER_LEFT_LOWER,"Arial",8,
                   cOffButtonFont,cOffButtonBackground,cOffButtonBorder,
                   x_size,y_size,x_dist,y_dist,3);
      //--- Set the X-coordinate for the next button
      x_dist+=x_size+1;
     }
  }
//+------------------------------------------------------------------+
//| Adding buttons of chart properties                               |
//+------------------------------------------------------------------+
void AddPropertyButtons()
  {
   int x_dist =1;  // Indent from the left side of the chart
   int y_dist =41; // Indent from the bottom of the chart
   int x_size =66; // Button width
   int y_size =20; // Button height
//---
   for(int i=0; i<PROPERTY_BUTTONS; i++)
     {
      //--- If the first three buttons have already been added, set the coordinates for the next row
      if(i==3)
        {
         x_dist=1;
         y_dist-=21;
        }
      //--- Add a button
      CreateButton(0,0,property_button_names[i],property_button_texts[i],
                   ANCHOR_LEFT_LOWER,CORNER_LEFT_LOWER,"Arial",8,
                   cOffButtonFont,cOffButtonBackground,cOffButtonBorder,
                   property_button_widths[i],y_size,x_dist,y_dist,3);
      //--- Set the X-coordinate for the next button
      x_dist+=property_button_widths[i]+1;
     }
  }
从图表中删除指标时,也同样应删除程序创建的对象。为此,我们需要以下辅助函数:
//+------------------------------------------------------------------+
//| Deleting the panel with time frame buttons                       |
//+------------------------------------------------------------------+
void DeleteTimeframeButtons()
  {
   for(int i=0; i<TIMEFRAME_BUTTONS; i++)
      DeleteObjectByName(timeframe_button_names[i]);
  }
//+------------------------------------------------------------------+
//| Deleting the panel with buttons of chart properties              |
//+------------------------------------------------------------------+
void DeletePropertyButtons()
  {
   for(int i=0; i<PROPERTY_BUTTONS; i++)
      DeleteObjectByName(property_button_names[i]);
  }
//+------------------------------------------------------------------+
//| Deleting objects by name                                         |
//+------------------------------------------------------------------+
void DeleteObjectByName(string object_name)
  {
//--- If such object exists
   if(ObjectFind(ChartID(),object_name)>=0)
     {
      //--- Delete it or print the relevant error message
      if(!ObjectDelete(ChartID(),object_name))
         Print("Error ("+IntegerToString(GetLastError())+") when deleting the object!");
     }
  }
现在,为确保加载指标时图表上已设置面板,以及从图表中删除指标时所有面板对象已删除,我们需要对 OnInit() 和 OnDeinit() 处理函数添加以下代码字符串。
//+------------------------------------------------------------------+
//| Custom indicator initialization function                         |
//+------------------------------------------------------------------+
int OnInit()
  {
//--- Add the panel with time frame buttons to the chart
   AddTimeframeButtons();
//--- Add the panel with buttons of chart properties to the chart
   AddPropertyButtons();
//--- Redraw the chart
   ChartRedraw();
//--- Initialization completed successfully
   return(INIT_SUCCEEDED);
  }
//+------------------------------------------------------------------+
//| Indicator deinitialization                                       |
//+------------------------------------------------------------------+
void OnDeinit(const int reason)
  {
//--- If the indicator has been deleted from the chart
   if(reason==REASON_REMOVE)
     {
      //--- Delete buttons
      DeleteTimeframeButtons();
      DeletePropertyButtons();
      //--- Redraw the chart
      ChartRedraw();
     }
  }
如果现在编译指标并将其附加到图表,我们可以看到如下屏幕截图中的面板:
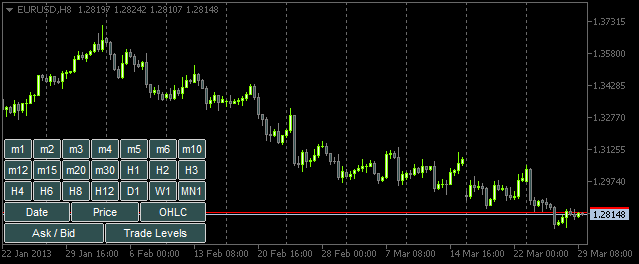
图 4. 带按钮的面板
现在一切就绪,可以开始创建用户和面板互动的函数了。实质上,它们都将从 OnChartEvent() 主函数中调用。在本文中,我们考虑将在该函数中处理的两个事件:
- CHARTEVENT_OBJECT_CLICK - 点击图形对象事件。
- CHARTEVENT_CHART_CHANGE - 调整图表大小或使用属性对话窗口修改图表属性事件。
让我们从 CHARTEVENT_OBJECT_CLICK 事件开始。我们将要编写的 ChartEventObjectClick() 函数将从 OnChartEvent() 函数获得所有自变量(对其他事件将创建类似函数):
//+------------------------------------------------------------------+
//| Event of the click on a graphical object                         |
//+------------------------------------------------------------------+
bool ChartEventObjectClick(int id,
                           long lparam,
                           double dparam,
                           string sparam)
  {
//--- Click on a graphical object
   if(id==CHARTEVENT_OBJECT_CLICK)
     {
      //--- If a time frame button has been clicked, set/delete 'SubWindow' and a chart object
      if(ToggleSubwindowAndChartObject(sparam))
         return(true);
      //--- If a button of chart properties has been clicked, set/delete the property in chart objects
      if(ToggleChartObjectProperty(sparam))
         return(true);
     }
//---
   return(false);
  }
ChartEventObjectClick()函数代码简单。使用标识符确定面板按钮点击事件。实施逻辑分为两个方向:处理点击时间表按钮事件或点击图表属性按钮事件。包含左击对象名称的sparam字符串参数传递给相应的 ToggleSubwindowAndChartObject() 和 ToggleChartObjectProperty() 函数。
让我们看一下此等函数的源代码。从 ToggleSubwindowAndChartObject() 开始:
//+------------------------------------------------------------------+
//| Setting/deleting SubWindow and a chart object                    |
//+------------------------------------------------------------------+
bool ToggleSubwindowAndChartObject(string clicked_object_name)
  {
//--- Make sure that the click was on the time frame button object
   if(CheckClickOnTimeframeButton(clicked_object_name))
     {
      //--- Check if the SubWindow exists
      subwindow_number=ChartWindowFind(0,subwindow_shortname);
      //--- If the SubWindow does not exist, set it
      if(subwindow_number<0)
        {
         //--- If the SubWindow is set
         if(AddSubwindow())
           {
            //--- Add chart objects to it
            AddChartObjectsToSubwindow(clicked_object_name);
            return(true);
           }
        }
      //--- If the SubWindow exists
      if(subwindow_number>0)
        {
         //--- Add chart objects to it
         AddChartObjectsToSubwindow(clicked_object_name);
         return(true);
        }
     }
//---
   return(false);
  }
根据以上代码的注释,您应该很容易理解实施逻辑。高亮字符串提供部分自定义函数,其代码如下所示。
如果被点击按钮与时间表面板相关联,则 CheckClickOnTimeframeButton() 函数返回 true:
//+------------------------------------------------------------------+
//| Checking if a time frame button has been clicked                 |
//+------------------------------------------------------------------+
bool CheckClickOnTimeframeButton(string clicked_object_name)
  {
//--- Iterate over all time frame buttons and check the names
   for(int i=0; i<TIMEFRAME_BUTTONS; i++)
     {
      //--- Report the match
      if(clicked_object_name==timeframe_button_names[i])
         return(true);
     }
//---
   return(false);
  }
如果确认点击了时间表按钮,之后便可检查子窗口当前是否已添加至主图表。如果没有,则使用 AddSubwindow() 函数设置:
//+------------------------------------------------------------------+
//| Adding a subwindow for chart objects                             |
//+------------------------------------------------------------------+
bool AddSubwindow()
  {
//--- Get the "SubWindow" indicator handle
   subwindow_handle=iCustom(_Symbol,_Period,subwindow_path);
//--- If the handle has been obtained
   if(subwindow_handle!=INVALID_HANDLE)
     {
      //--- Determine the number of windows in the chart for the subwindow number
      subwindow_number=(int)ChartGetInteger(0,CHART_WINDOWS_TOTAL);
      //--- Add the SubWindow to the chart
      if(!ChartIndicatorAdd(0,subwindow_number,subwindow_handle))
         Print("Failed to add the SUBWINDOW indicator ! ");
      //--- The subwindow exists
      else
         return(true);
     }
//--- There is no subwindow
   return(false);
  }
然后使用 AddChartObjectsToSubwindow() 函数添加图表对象至已创建的子窗口:
//+------------------------------------------------------------------+
//| Adding chart objects to the subwindow                            |
//+------------------------------------------------------------------+
void AddChartObjectsToSubwindow(string clicked_object_name)
  {
   ENUM_TIMEFRAMES tf                 =WRONG_VALUE; // Time frame
   string          object_name        ="";          // Object name
   string          object_text        ="";          // Object text
   int             x_distance         =0;           // X-coordinate
   int             total_charts       =0;           // Total chart objects
   int             chart_object_width =0;           // Chart object width
//--- Get the bar scale and SubWindow height/width
   chart_scale=(int)ChartGetInteger(0,CHART_SCALE);
   chart_width=(int)ChartGetInteger(0,CHART_WIDTH_IN_PIXELS,subwindow_number);
   chart_height=(int)ChartGetInteger(0,CHART_HEIGHT_IN_PIXELS,subwindow_number);
//--- Get the number of chart objects in the SUBWINDOW
   total_charts=ObjectsTotal(0,subwindow_number,OBJ_CHART);
//--- If there are no chart objects
   if(total_charts==0)
     {
      //--- Check if a time frame button has been clicked
      if(CheckClickOnTimeframeButton(clicked_object_name))
        {
         //--- Initialize the array of time frame buttons
         InitializeTimeframeButtonStates();
         //--- Get the time frame button text for the chart object tooltip
         object_text=ObjectGetString(0,clicked_object_name,OBJPROP_TEXT);
         //--- Get the time frame for the chart object
         tf=StringToTimeframe(object_text);
         //--- Set the chart object
         CreateChartInSubwindow(subwindow_number,0,0,chart_width,chart_height,
                                "chart_object_"+object_text,_Symbol,tf,chart_scale,
                                property_button_states[0],property_button_states[1],
                                property_button_states[2],property_button_states[3],
                                property_button_states[4],object_text);
         //--- Refresh the chart and exit
         ChartRedraw();
         return;
        }
     }
//--- If chart objects already exist in the SubWindow
   if(total_charts>0)
     {
      //--- Get the number of clicked time frame buttons and initialize the array of states
      int pressed_buttons_count=InitializeTimeframeButtonStates();
      //--- If there are no clicked buttons, delete the SubWindow
      if(pressed_buttons_count==0)
         DeleteSubwindow();
      //--- If the clicked buttons exist
      else
        {
         //--- Delete all chart objects from the subwindow
         ObjectsDeleteAll(0,subwindow_number,OBJ_CHART);
         //--- Get the width for chart objects
         chart_object_width=chart_width/pressed_buttons_count;
         //--- Iterate over all buttons in a loop
         for(int i=0; i<TIMEFRAME_BUTTONS; i++)
           {
            //--- If the button is clicked
            if(timeframe_button_states[i])
              {
               //--- Get the time frame button text for the chart object tooltip
               object_text=ObjectGetString(0,timeframe_button_names[i],OBJPROP_TEXT);
               //--- Get the time frame for the chart object
               tf=StringToTimeframe(object_text);
               //--- Set the chart object
               CreateChartInSubwindow(subwindow_number,x_distance,0,chart_object_width,chart_height,
                                      chart_object_names[i],_Symbol,tf,chart_scale,
                                      property_button_states[0],property_button_states[1],
                                      property_button_states[2],property_button_states[3],
                                      property_button_states[4],object_text);
               //--- Determine the X-coordinate for the next chart object
               x_distance+=chart_object_width;
              }
           }
        }
     }
//--- Refresh the chart
   ChartRedraw();
  }
上述代码中的详细注释会帮助您掌握函数操作。高亮显示之前未曾遇到过的自定义函数。
InitializeTimeframeButtonStates() 函数返回点击的时间表按钮数并初始化状态相应数组。同时根据按钮状态设置颜色:
//+------------------------------------------------------------------+
//| Initializing array of time frame button states and               |
//| returning the number of clicked buttons                          |
//+------------------------------------------------------------------+
int InitializeTimeframeButtonStates()
  {
//--- Counter of the clicked time frame buttons
   int pressed_buttons_count=0;
//--- Iterate over all time frame buttons and count the clicked ones
   for(int i=0; i<TIMEFRAME_BUTTONS; i++)
     {
      //--- If the button is clicked
      if(ObjectGetInteger(0,timeframe_button_names[i],OBJPROP_STATE))
        {
         //--- Indicate it in the current index of the array
         timeframe_button_states[i]=true;
         //--- Set clicked button colors
         ObjectSetInteger(0,timeframe_button_names[i],OBJPROP_COLOR,cOnButtonFont);
         ObjectSetInteger(0,timeframe_button_names[i],OBJPROP_BGCOLOR,cOnButtonBackground);
         //--- Increase the counter by one
         pressed_buttons_count++;
        }
      else
        {
         //--- Set unclicked button colors
         ObjectSetInteger(0,timeframe_button_names[i],OBJPROP_COLOR,cOffButtonFont);
         ObjectSetInteger(0,timeframe_button_names[i],OBJPROP_BGCOLOR,cOffButtonBackground);
         //--- Indicate that the button is unclicked
         timeframe_button_states[i]=false;
        }
     }
//--- Return the number of clicked buttons
   return(pressed_buttons_count);
  }
DeleteSubwindow() 函数非常简单:检查图表子窗口是否存在,并将其删除:
//+------------------------------------------------------------------+
//| Deleting subwindow for chart objects                             |
//+------------------------------------------------------------------+
void DeleteSubwindow()
  {
//--- If the SubWindow exists
   if((subwindow_number=ChartWindowFind(0,subwindow_shortname))>0)
     {
      //--- Delete it
      if(!ChartIndicatorDelete(0,subwindow_number,subwindow_shortname))
         Print("Failed to delete the "+subwindow_shortname+" indicator!");
     }
  }
现在我们来研究图表对象的属性。换言之,我们回到 ChartEventObjectClick() 函数,并研究 ToggleChartObjectProperty() 函数。点击对象的名称也传递给它。
//+------------------------------------------------------------------+
//| Setting/deleting chart object property                           |
//| depending on the clicked button state                            |
//+------------------------------------------------------------------+
bool ToggleChartObjectProperty(string clicked_object_name)
  {

//--- If the "Date" button is clicked
   if(clicked_object_name=="property_button_date")
     {
      //--- If the button is clicked
      if(SetButtonColor(clicked_object_name))
         ShowDate(true);
      //--- If the button is unclicked
      else
         ShowDate(false);
      //--- Refresh the chart and exit
      ChartRedraw();
      return(true);
     }
//--- If the "Price" button is clicked
   if(clicked_object_name=="property_button_price")
     {
      //--- If the button is clicked
      if(SetButtonColor(clicked_object_name))
         ShowPrice(true);
      //--- If the button is unclicked
      else
         ShowPrice(false);
      //--- Refresh the chart and exit
      ChartRedraw();
      return(true);
     }
//--- If the "OHLC" button is clicked
   if(clicked_object_name=="property_button_ohlc")
     {
      //--- If the button is clicked
      if(SetButtonColor(clicked_object_name))
         ShowOHLC(true);
      //--- If the button is unclicked
      else
         ShowOHLC(false);
      //--- Refresh the chart and exit
      ChartRedraw();
      return(true);
     }
//--- If the "Ask/Bid" button is clicked
   if(clicked_object_name=="property_button_askbid")
     {
      //--- If the button is clicked
      if(SetButtonColor(clicked_object_name))
         ShowAskBid(true);
      //--- If the button is unclicked
      else
         ShowAskBid(false);
      //--- Refresh the chart and exit
      ChartRedraw();
      return(true);
     }
//--- If the "Trade Levels" button is clicked
   if(clicked_object_name=="property_button_trade_levels")
     {
      //--- If the button is clicked
      if(SetButtonColor(clicked_object_name))
         ShowTradeLevels(true);
      //--- If the button is unclicked
      else
         ShowTradeLevels(false);
      //--- Refresh the chart and exit
      ChartRedraw();
      return(true);
     }
//--- No matches
   return(false);
  }
在上述代码中,对比与图表属性相关的对象名称,点击对象的名称是连续的。如果匹配,则检查是否在 SetButtonColor() 函数中点击了按钮,并设置相关按钮颜色。
//+------------------------------------------------------------------+
//| Setting color of button elements depending on the state          |
//+------------------------------------------------------------------+
bool SetButtonColor(string clicked_object_name)
  {
//--- If the button is clicked
   if(ObjectGetInteger(0,clicked_object_name,OBJPROP_STATE))
     {
      //--- Set clicked button colors
      ObjectSetInteger(0,clicked_object_name,OBJPROP_COLOR,cOnButtonFont);
      ObjectSetInteger(0,clicked_object_name,OBJPROP_BGCOLOR,cOnButtonBackground);
      return(true);
     }
//--- If the button is unclicked
   if(!ObjectGetInteger(0,clicked_object_name,OBJPROP_STATE))
     {
      //--- Set unclicked button colors
      ObjectSetInteger(0,clicked_object_name,OBJPROP_COLOR,cOffButtonFont);
      ObjectSetInteger(0,clicked_object_name,OBJPROP_BGCOLOR,cOffButtonBackground);
      return(false);
     }
//---
   return(false);
  }
SetButtonColor() 函数返回按钮状态。根据该属性,程序通知相关函数必须在子窗口的所有图表对象中启用或禁用该函数的某一属性。为每一属性单独编写了函数。相应函数代码如下:
//+------------------------------------------------------------------+
//| Enabling/disabling dates for all chart objects                   |
//+------------------------------------------------------------------+
void ShowDate(bool state)
  {
   int    total_charts =0;  // Number of objects
   string chart_name  =""; // Chart object name
//--- Check if the SubWindow exists
//    If it exists, then
   if((subwindow_number=ChartWindowFind(0,subwindow_shortname))>0)
     {
      //--- Get the number of chart objects
      total_charts=ObjectsTotal(0,subwindow_number,OBJ_CHART);
      //--- Iterate over all chart objects in a loop
      for(int i=0; i<total_charts; i++)
        {
         //--- Get the chart object name
         chart_name=ObjectName(0,i,subwindow_number,OBJ_CHART);
         //--- Set the property
         ObjectSetInteger(0,chart_name,OBJPROP_DATE_SCALE,state);
        }
      //--- Set the button state to the relevant index
      if(state)
         property_button_states[0]=true;
      else
         property_button_states[0]=false;
      //--- Refresh the chart
      ChartRedraw();
     }
  }
//+------------------------------------------------------------------+
//| Enabling/disabling prices for all chart objects                  |
//+------------------------------------------------------------------+
void ShowPrice(bool state)
  {
   int    total_charts =0;  // Number of objects
   string chart_name  =""; // Chart object name
//--- Check if the SubWindow exists
//    If it exists, then
   if((subwindow_number=ChartWindowFind(0,subwindow_shortname))>0)
     {
      //--- Get the number of chart objects
      total_charts=ObjectsTotal(0,subwindow_number,OBJ_CHART);
      //--- Iterate over all chart objects in a loop
      for(int i=0; i<total_charts; i++)
        {
         //--- Get the chart object name
         chart_name=ObjectName(0,i,subwindow_number,OBJ_CHART);
         //--- Set the property
         ObjectSetInteger(0,chart_name,OBJPROP_PRICE_SCALE,state);
        }
      //--- Set the button state to the relevant index
      if(state)
         property_button_states[1]=true;
      else
         property_button_states[1]=false;
      //--- Refresh the chart
      ChartRedraw();
     }
  }
//+------------------------------------------------------------------+
//| Enabling/disabling OHLC for all chart objects                    |
//+------------------------------------------------------------------+
void ShowOHLC(bool state)
  {
   int    total_charts =0;  // Number of objects
   long   subchart_id =0;  // Chart object identifier
   string chart_name  =""; // Chart object name
//--- Check if the SubWindow exists
//    If it exists, then
   if((subwindow_number=ChartWindowFind(0,subwindow_shortname))>0)
     {
      //--- Get the number of chart objects
      total_charts=ObjectsTotal(0,subwindow_number,OBJ_CHART);
      //--- Iterate over all chart objects in a loop
      for(int i=0; i<total_charts; i++)
        {
         //--- Get the chart object name
         chart_name=ObjectName(0,i,subwindow_number,OBJ_CHART);
         //--- Get the chart object identifier
         subchart_id=ObjectGetInteger(0,chart_name,OBJPROP_CHART_ID);
         //--- Set the property
         ChartSetInteger(subchart_id,CHART_SHOW_OHLC,state);
         //--- Refresh the chart object
         ChartRedraw(subchart_id);
        }
      //--- Set the button state to the relevant index
      if(state)
         property_button_states[2]=true;
      else
         property_button_states[2]=false;
      //--- Refresh the chart
      ChartRedraw();
     }
  }
//+------------------------------------------------------------------+
//| Enabling/disabling Ask/Bid levels for all chart objects          |
//+------------------------------------------------------------------+
void ShowAskBid(bool state)
  {
   int    total_charts =0;  // Number of objects
   long   subchart_id =0;  // Chart object identifier
   string chart_name  =""; // Chart object name
//--- Check if the SubWindow exists
//    If it exists, then
   if((subwindow_number=ChartWindowFind(0,subwindow_shortname))>0)
     {
      //--- Get the number of chart objects
      total_charts=ObjectsTotal(0,subwindow_number,OBJ_CHART);
      //--- Iterate over all chart objects in a loop
      for(int i=0; i<total_charts; i++)
        {
         //--- Get the chart object name
         chart_name=ObjectName(0,i,subwindow_number,OBJ_CHART);
         //--- Get the chart object identifier
         subchart_id=ObjectGetInteger(0,chart_name,OBJPROP_CHART_ID);
         //--- Set the properties
         ChartSetInteger(subchart_id,CHART_SHOW_ASK_LINE,state);
         ChartSetInteger(subchart_id,CHART_SHOW_BID_LINE,state);
         //--- Refresh the chart object
         ChartRedraw(subchart_id);
        }
      //--- Set the button state to the relevant index
      if(state)
         property_button_states[3]=true;
      else
         property_button_states[3]=false;
      //--- Refresh the chart
      ChartRedraw();
     }
  }
//+------------------------------------------------------------------+
//| Enabling/disabling trade levels for all chart objects            |
//+------------------------------------------------------------------+
void ShowTradeLevels(bool state)
  {
   int    total_charts =0;  // Number of objects
   long   subchart_id =0;  // Chart object identifier
   string chart_name  =""; // Chart object name
//--- Check if the SubWindow exists
//    If it exists, then
   if((subwindow_number=ChartWindowFind(0,subwindow_shortname))>0)
     {
      //--- Get the number of chart objects
      total_charts=ObjectsTotal(0,subwindow_number,OBJ_CHART);
      //--- Iterate over all chart objects in a loop
      for(int i=0; i<total_charts; i++)
        {
         //--- Get the chart object name
         chart_name=ObjectName(0,i,subwindow_number,OBJ_CHART);
         //--- Get the chart object identifier
         subchart_id=ObjectGetInteger(0,chart_name,OBJPROP_CHART_ID);
         //--- Set the property
         ChartSetInteger(subchart_id,CHART_SHOW_TRADE_LEVELS,state);
         //--- Refresh the chart object
         ChartRedraw(subchart_id);
        }
      //--- Set the button state to the relevant index
      if(state)
         property_button_states[4]=true;
      else
         property_button_states[4]=false;
      //--- Refresh the chart
      ChartRedraw();
     }
  }
现在,与面板进行交互的所有函数准备就绪。我们仅需将一个代码字符串添加至 OnChartEvent() 主函数:
//+------------------------------------------------------------------+
//| ChartEvent function                                              |
//+------------------------------------------------------------------+
void OnChartEvent(const int id,
                  const long &lparam,
                  const double &dparam,
                  const string &sparam)
  {
//--- The CHARTEVENT_OBJECT_CLICK event
   if(ChartEventObjectClick(id,lparam,dparam,sparam))
      return;

  }
如果编译了指标,并正在图表中运行,则点击相应时间表按钮时,图表对象将被添加至子窗口。此外,如果点击任意属性按钮,则将能在图表对象中看到相应变化:
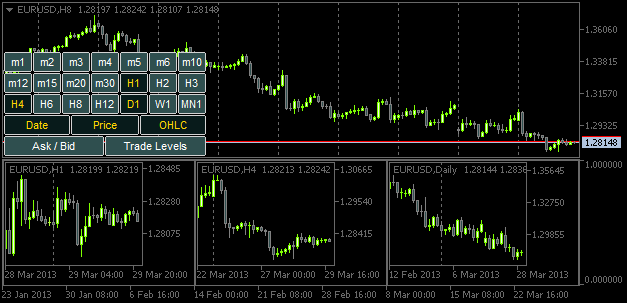
图 5. 为图表对象添加指定属性
然而,如果调整图表窗口或子窗口大小,图表对象大小不会进行相应调整。因此,是时候研究 CHARTEVENT_CHART_CHANGE 事件了。
正如创建追踪“点击图形对象”事件的 ChartEventObjectClick() 函数,现在让我们来编写 ChartEventChartChange() 函数:
//+------------------------------------------------------------------+
//| Event of modifying the chart properties                          |
//+------------------------------------------------------------------+
bool ChartEventChartChange(int id,
                           long lparam,
                           double dparam,
                           string sparam)
  {
//--- Chart has been resized or the chart properties have been modified
   if(id==CHARTEVENT_CHART_CHANGE)
     {
      //--- If the SubWindow has been deleted (or does not exist), while the time frame buttons are clicked,
      //    release all the buttons (reset)
      if(OnSubwindowDelete())
         return(true);
      //--- Save the height and width values of the main chart and SubWindow, if it exists
      GetSubwindowWidthAndHeight();
      //--- Adjust the sizes of chart objects
      AdjustChartObjectsSizes();
      //--- Refresh the chart and exit
      ChartRedraw();
      return(true);
     }
//---
   return(false);
  }
如果程序确认主图表大小或属性已修改,则首先使用 OnSubwindowDelete() 函数检查子窗口是否删除。如无法找到子窗口,则重新设置面板。
//+------------------------------------------------------------------+
//| Response to Subwindow deletion                                   |
//+------------------------------------------------------------------+
bool OnSubwindowDelete()
  {
//--- if there is no SubWindow
   if(ChartWindowFind(0,subwindow_shortname)<1)
     {
      //--- Reset the panel with time frame buttons
      AddTimeframeButtons();
      ChartRedraw();
      return(true);
     }
//--- SubWindow exists
   return(false);
  }
如果子窗口在原位,则子窗口的宽度值和高度值在 GetSubwindowWidthAndHeight() 函数中被指定为全局变量。
//+------------------------------------------------------------------+
//| Saving the SubWindow height and width values                     |
//+------------------------------------------------------------------+
void GetSubwindowWidthAndHeight()
  {
//--- Check if there is a subwindow named SubWindow
   if((subwindow_number=ChartWindowFind(0,subwindow_shortname))>0)
     {
      // Get the subwindow height and width
      chart_height=(int)ChartGetInteger(0,CHART_HEIGHT_IN_PIXELS,subwindow_number);
      chart_width=(int)ChartGetInteger(0,CHART_WIDTH_IN_PIXELS,subwindow_number);
     }
  }
最后,在 AdjustChartObjectsSizes() 函数中调整图表对象的大小。
//+------------------------------------------------------------------+
//| Adjusting width of chart objects when modifying the window width |
//+------------------------------------------------------------------+
void AdjustChartObjectsSizes()
  {
   int             x_distance         =0;           // X-coordinate
   int             total_objects      =0;           // Number of chart objects
   int             chart_object_width =0;           // Chart object width
   string          object_name        ="";          // Object name
   ENUM_TIMEFRAMES TF                 =WRONG_VALUE; // Time frame
//--- Get the SubWindow number
   if((subwindow_number=ChartWindowFind(0,subwindow_shortname))>0)
     {
      //--- Get the total number of chart objects
      total_objects=ObjectsTotal(0,subwindow_number,OBJ_CHART);
      //--- If there are no objects, delete the subwindow and exit
      if(total_objects==0)
        {
         DeleteSubwindow();
         return;
        }
      //--- Get the width for chart objects
      chart_object_width=chart_width/total_objects;
      //--- Iterate over all chart objects in a loop
      for(int i=total_objects-1; i>=0; i--)
        {
         //--- Get the name
         object_name=ObjectName(0,i,subwindow_number,OBJ_CHART);
         //--- Set the chart object width and height
         ObjectSetInteger(0,object_name,OBJPROP_YSIZE,chart_height);
         ObjectSetInteger(0,object_name,OBJPROP_XSIZE,chart_object_width);
         //--- Set the chart object position
         ObjectSetInteger(0,object_name,OBJPROP_YDISTANCE,0);
         ObjectSetInteger(0,object_name,OBJPROP_XDISTANCE,x_distance);
         //--- Set the new X-coordinate for the next chart object
         x_distance+=chart_object_width;
        }
     }
  }
为追踪修改主图表大小和属性事件,应将以下字符串添加至 OnChartEvent() 函数:
编译指标并将其附加至图表后,您会发现每次主窗口调整大小时,图表对象都会根据子窗口的大小进行调整。
总结
本文到此结束。作为课外作业,尝试实现某些功能,如修改主图表中的符号时,对图表对象中的符号进行调整。您可能还想将图表对象中的时间表从低到高依次排序(从左至右)。在上述指标版本中,该可能性尚未实现。
在现成应用 TF PANEL 的说明中,您可以找到该等功能实现的视频演示。本文随附源代码文件,可进行下载。
本文由MetaQuotes Ltd译自俄文
原文地址: https://www.mql5.com/ru/articles/749
注意: MetaQuotes Ltd.将保留所有关于这些材料的权利。全部或部分复制或者转载这些材料将被禁止。
本文由网站的一位用户撰写,反映了他们的个人观点。MetaQuotes Ltd 不对所提供信息的准确性负责,也不对因使用所述解决方案、策略或建议而产生的任何后果负责。
 扩展 MQL5 标准库和重用代码
文章MQL5 Recipes - Monitoring Multiple Timeframes in One Window 已发布:
作者:Anatoli Kazharski
,请问是否可以添加第二时间框架的显示,例如 10 秒、30 秒?
非常方便的指标。 ,请问是否可以添加第二时间框架的显示,例如 10 秒、30 秒?
你好,阿纳托利、
谢谢你写了这么好的文章!我只是想知道关于子窗口指标的问题...我注意到您把它设置在图表窗口上,而不是单独的窗口上......这是个错误吗?