
MQL5 Coobook: 단일 창에서 여러 시간 프레임 모니터링
소개
포지션을 여는 방향을 선택할 때 여러 시간대가 동시에 표시되는 가격 차트가 매우 유용할 수 있습니다. MetaTrader 5 클라이언트 터미널은 분석을 위한 21개의 시간 프레임을 제공합니다. 기존 차트에 배치하고 기호, 시간 프레임 및 기타 속성을 바로 설정할 수 있는 특수 차트 개체를 활용할 수 있습니다. 이러한 차트 개체를 원하는 수만큼 추가할 수 있지만 수동으로 수행하면 상당히 불편하고 시간이 많이 걸립니다. 또한 모든 차트 속성을 수동 모드로 설정할 수 있는 것은 아닙니다.
이 글에서는 이러한 그래픽 개체에 대해 자세히 살펴보겠습니다. 설명을 위해 하위 창에 여러 차트 개체를 동시에 설정할 수 있는 컨트롤(버튼)이 있는 지표를 만듭니다. 또한 차트 개체는 하위 창에 정확하게 맞고 기본 차트 또는 터미널 창의 크기가 조정될 때 자동으로 조정됩니다.
차트 개체를 추가하는 버튼 외에도 프로그래밍 방식으로만 수정할 수 있는 차트 속성을 포함하여 일부 차트 속성을 활성화/비활성화하는 버튼도 있습니다.
개발
삽입 메뉴->개체->그래픽 개체->차트를 사용하여 차트 개체를 수동으로 추가할 수 있습니다. 예를 들어, H4 및 D1 시간 프레임이 있는 개체가 1시간 차트에 표시되는 방식은 다음과 같습니다.
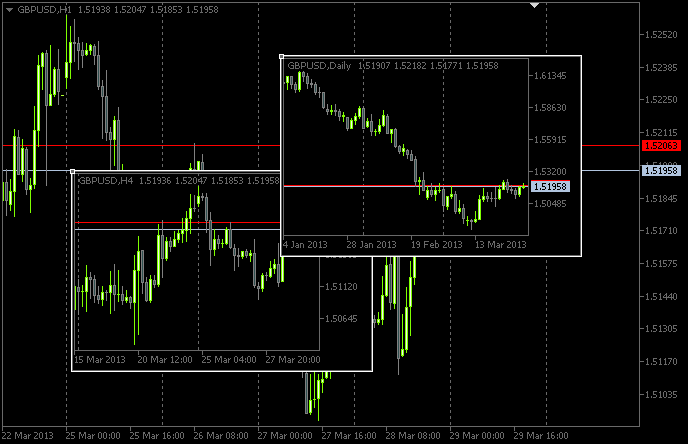
그림 1. 차트 개체
개체 매개변수를 수정하면 제한된 속성 집합만 관리할 수 있습니다.
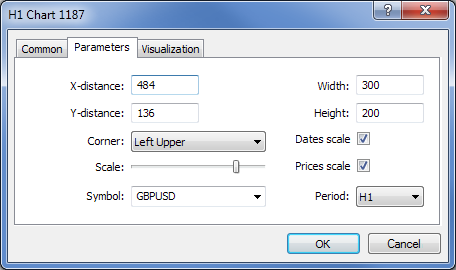
그림 2. 차트 개체 속성
그러나 매도 및 입찰가 가격 수준, 오른쪽 차트 가장자리에서 들여쓰기, 거래 수준 등과 같은 매개변수는 적절하게 프로그래밍된 경우에만 표시될 수 있습니다.
그래서 지표 개발을 시작합니다. ChartObjects (글의 작업 제목)라는 이름을 지정했다고 가정해 보겠습니다. MQL5 마법사를 사용하여 MetaEditor에서 지표에 대한 템플릿을 생성합니다. 사용자 지정 지표 프로그램의 이벤트 핸들러를 선택할 때 아래 스크린샷과 같이 선택하십시오.
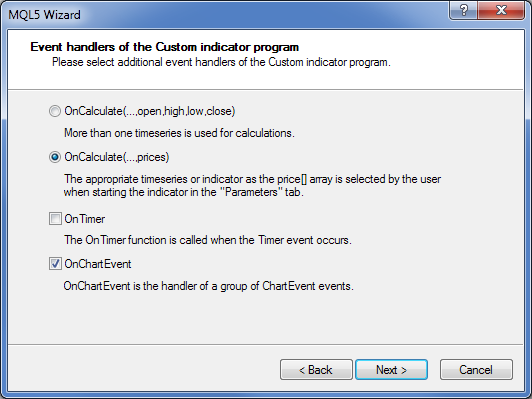
그림 3. 지표의 이벤트 핸들러
MetaEditor에서 열었을 때 템플릿 소스 코드는 결과적으로 다음과 같이 보일 것입니다:
//+------------------------------------------------------------------+
//|                                                 ChartObjects.mq5 |
//|                        Copyright 2013, MetaQuotes Software Corp. |
//|                                              http://www.mql5.com |
//+------------------------------------------------------------------+
#property copyright "Copyright 2013, MetaQuotes Software Corp."
#property link      "http://www.mql5.com"
#property version   "1.00"
#property indicator_chart_window
//+------------------------------------------------------------------+
//| Custom indicator initialization function                         |
//+------------------------------------------------------------------+
int OnInit()
  {
//--- indicator buffers mapping

//---
   return(INIT_SUCCEEDED);
  }
//+------------------------------------------------------------------+
//| Custom indicator iteration function                              |
//+------------------------------------------------------------------+
int OnCalculate(const int rates_total,
                const int prev_calculated,
                const int begin,
                const double &price[])
  {
//---

//--- return value of prev_calculated for next call
   return(rates_total);
  }
//+------------------------------------------------------------------+
//| TradeTransaction function                                        |
//+------------------------------------------------------------------+
void OnTradeTransaction(const MqlTradeTransaction& trans,
                        const MqlTradeRequest& request,
                        const MqlTradeResult& result)
  {
//---

  }
//+------------------------------------------------------------------+
//| ChartEvent function                                              |
//+------------------------------------------------------------------+
void OnChartEvent(const int id,
                  const long &lparam,
                  const double &dparam,
                  const string &sparam)
  {
//---

  }
//+------------------------------------------------------------------+
이 구현에서는 기본적으로 OnCalculate() 함수가 필요하지 않지만 이 함수 없이 지표를 컴파일하는 것은 불가능합니다. 또한 주요 기능 중 하나인 OnDeinit()이 필요합니다. 차트에서 프로그램 삭제를 모니터링합니다. 템플릿의 기본 처리 후 다음 소스 코드가 있습니다.
//+------------------------------------------------------------------+
//|                                                 ChartObjects.mq5 |
//|                        Copyright 2013, MetaQuotes Software Corp. |
//|                                              http://www.mql5.com |
//+------------------------------------------------------------------+
#property copyright "Copyright 2013, MetaQuotes Software Corp."
#property link      "http://www.mql5.com"
#property version   "1.00"
//---
#property indicator_chart_window // Indicator is in the main window
#property indicator_plots 0      // Zero plotting series
//+------------------------------------------------------------------+
//| Custom indicator initialization function                         |
//+------------------------------------------------------------------+
int OnInit()
  {
//--- Set the short name for the indicator
   IndicatorSetString(INDICATOR_SHORTNAME,"TimeFramesPanel");
//--- Initialization completed successfully
   return(INIT_SUCCEEDED);
  }
//+------------------------------------------------------------------+
//| Indicator deinitialization                                       |
//+------------------------------------------------------------------+
void OnDeinit(const int reason)
  {
//--- If the indicator has been deleted from the chart
   if(reason==REASON_REMOVE)
     {
     }
  }
//+------------------------------------------------------------------+
//| Custom indicator iteration function                              |
//+------------------------------------------------------------------+
int OnCalculate(const int rates_total,
                const int prev_calculated,
                const int begin,
                const double &price[])
  {
//---

//--- return value of prev_calculated for next call
   return(rates_total);
  }
//+------------------------------------------------------------------+
//| ChartEvent function                                              |
//+------------------------------------------------------------------+
void OnChartEvent(const int id,
                  const long &lparam,
                  const double &dparam,
                  const string &sparam)
  {
//---

  }
//+------------------------------------------------------------------+
이제 차트 개체의 저장소(하위 창)로 사용할 지표를 만들어야 합니다. 기본적으로 더미 지표가 됩니다. 이름을 SubWindow로 지정하겠습니다. 해당 코드는 다음과 같습니다.
//+------------------------------------------------------------------+
//|                                                    SubWindow.mq5 |
//|                        Copyright 2013, MetaQuotes Software Corp. |
//|                                              http://www.mql5.com |
//+------------------------------------------------------------------+
#property copyright "Copyright 2013, MetaQuotes Software Corp."
#property link      "http://www.mql5.com"
#property version   "1.00"
//---
#property indicator_chart_window // Indicator is in the subwindow
#property indicator_plots 0      // Zero plotting series
//+------------------------------------------------------------------+
//| Custom indicator initialization function                         |
//+------------------------------------------------------------------+
int OnInit()
  {
//--- Set the short name for the indicator
   IndicatorSetString(INDICATOR_SHORTNAME,"SubWindow");
//--- Initialization completed successfully
   return(INIT_SUCCEEDED);
  }
//+------------------------------------------------------------------+
//| Custom indicator iteration function                              |
//+------------------------------------------------------------------+
int OnCalculate(const int rates_total,
                const int prev_calculated,
                const int begin,
                const double &price[])
  {
//---

//--- return value of prev_calculated for next call
   return(rates_total);
  }
//+------------------------------------------------------------------+
SubWindow.ex5 지표는 컴파일 후 ChartObjects.ex5 내에 리소스로 저장됩니다. 따라서 프로그램 개발자는 궁극적으로 최종 사용자에게 두 개가 아닌 한 개의 파일만 제공할 수 있습니다.
"MQL5 Cookbook: MetaTrader 5 Trade Events에 대한 소리 알림"이라는 제목의 이전 글에서 이미 설명했듯이 리소스 파일은 #resource 지시문을 사용하여 프로그램에 포함될 수 있습니다. ChartObjects 프로그램 시작 부분에 다음 코드 문자열을 추가해야 합니다.
//--- Include indicator resource
#resource "\\Indicators\\SubWindow.ex5"
그런 다음 #define 지시문을 사용하여 컨트롤에 귀속될 배열의 크기를 설정합니다.
//--- Number of time frame buttons
#define TIMEFRAME_BUTTONS 21
//--- Number of buttons for chart object properties
#define PROPERTY_BUTTONS 5
그리고 평소와 같이 프로그램의 맨 처음에 전역 변수를 선언합니다.
//--- Location of the SubWindow indicator in the resource
string subwindow_path         ="::Indicators\\SubWindow.ex5";
int    subwindow_number       =-1;               // Subwindow number
int    subwindow_handle       =INVALID_HANDLE;   // SubWindow indicator handle
string subwindow_shortname    ="SubWindow";      // Short name of the indicator
//---
int    chart_width            =0;                // Chart width
int    chart_height           =0;                // Chart height
int    chart_scale            =0;                // Chart scale
//---
color  cOffButtonFont         =clrWhite;         // Unclicked button text color
color  cOffButtonBackground   =clrDarkSlateGray; // Unclicked button background color
color  cOffButtonBorder       =clrLightGray;     // Unclicked button border color
//---
color  cOnButtonFont          =clrGold;          // Clicked button text color
color  cOnButtonBackground    =C'28,47,47';      // Clicked button background color
color  cOnButtonBorder        =clrLightGray;     // Clicked button border color
그 다음에는 시간 프레임 버튼에 대한 배열을 선언합니다.
//--- Array of object names for time frame buttons
string timeframe_button_names[TIMEFRAME_BUTTONS]=
  {
   "button_M1","button_M2","button_M3","button_M4","button_M5","button_M6","button_M10",
   "button_M12","button_M15","button_M20","button_M30","button_H1","button_H2","button_H3",
   "button_H4","button_H6","button_H8","button_H12","button_D1","button_W1","button_MN"
  };
//--- Array of text displayed on time frame buttons
string timeframe_button_texts[TIMEFRAME_BUTTONS]=
  {
   "M1","M2","M3","M4","M5","M6","M10",
   "M12","M15","M20","M30","H1","H2","H3",
   "H4","H6","H8","H12","D1","W1","MN"
  };
//--- Array of time frame button states
bool timeframe_button_states[TIMEFRAME_BUTTONS]={false};
차트 개체 속성을 제어하는 버튼 배열:
//--- Array of object names for buttons of chart properties
string property_button_names[PROPERTY_BUTTONS]=
  {
   "property_button_date","property_button_price",
   "property_button_ohlc","property_button_askbid",
   "property_button_trade_levels"
  };
//--- Array of text displayed on buttons of chart properties
string property_button_texts[PROPERTY_BUTTONS]=
  {
   "Date","Price","OHLC","Ask / Bid","Trade Levels"
  };
//--- Array of states for buttons of chart properties
bool property_button_states[PROPERTY_BUTTONS]={false};

//--- Array of sizes for buttons of chart properties
int property_button_widths[PROPERTY_BUTTONS]=
  {
   66,68,66,100,101
  };
마지막으로 차트 개체 이름 배열이 있습니다.
//--- Array of chart object names
string chart_object_names[TIMEFRAME_BUTTONS]=
  {
   "chart_object_m1","chart_object_m2","chart_object_m3","chart_object_m4","chart_object_m5","chart_object_m6","chart_object_m10",
   "chart_object_m12","chart_object_m15","chart_object_m20","chart_object_m30","chart_object_h1","chart_object_h2","chart_object_h3",
   "chart_object_h4","chart_object_h6","chart_object_h8","chart_object_h12","chart_object_d1","chart_object_w1","chart_object_mn"
  };
그래픽 개체와의 상호작용과 관련된 기능을 진행하기 전에 먼저 해당 개체를 생성하는 함수를 차트에 작성해 보겠습니다. 우리 프로그램에는 두 가지 유형의 그래픽 개체가 필요합니다: OBJ_BUTTON 및 OBJ_CHART.
버튼은 CreateButton() 함수에 의해 생성됩니다.
//+------------------------------------------------------------------+
//| Creating the Button object                                       |
//+------------------------------------------------------------------+
void CreateButton(long              chart_id,         // chart id
                  int               window_number,    // window number
                  string            name,             // object name
                  string            text,             // displayed name
                  ENUM_ANCHOR_POINT anchor,           // anchor point
                  ENUM_BASE_CORNER  corner,           // chart corner
                  string            font_name,        // font
                  int               font_size,        // font size
                  color             font_color,       // font color
                  color             background_color, // background color
                  color             border_color,     // border color
                  int               x_size,           // width
                  int               y_size,           // height
                  int               x_distance,       // X-coordinate
                  int               y_distance,       // Y-coordinate
                  long              z_order)          // Z-order
  {
//--- If the object has been created successfully
   if(ObjectCreate(chart_id,name,OBJ_BUTTON,window_number,0,0))
     {
      // set its properties
      ObjectSetString(chart_id,name,OBJPROP_TEXT,text);                  // setting name
      ObjectSetString(chart_id,name,OBJPROP_FONT,font_name);             // setting font
      ObjectSetInteger(chart_id,name,OBJPROP_COLOR,font_color);          // setting font color
      ObjectSetInteger(chart_id,name,OBJPROP_BGCOLOR,background_color);  // setting background color
      ObjectSetInteger(chart_id,name,OBJPROP_BORDER_COLOR,border_color); // setting border color
      ObjectSetInteger(chart_id,name,OBJPROP_ANCHOR,anchor);             // setting anchor point
      ObjectSetInteger(chart_id,name,OBJPROP_CORNER,corner);             // setting chart corner
      ObjectSetInteger(chart_id,name,OBJPROP_FONTSIZE,font_size);        // setting font size
      ObjectSetInteger(chart_id,name,OBJPROP_XSIZE,x_size);              // setting width
      ObjectSetInteger(chart_id,name,OBJPROP_YSIZE,y_size);              // setting height
      ObjectSetInteger(chart_id,name,OBJPROP_XDISTANCE,x_distance);      // setting X-coordinate
      ObjectSetInteger(chart_id,name,OBJPROP_YDISTANCE,y_distance);      // setting Y-coordinate
      ObjectSetInteger(chart_id,name,OBJPROP_SELECTABLE,false);          // object is not available for selection
      ObjectSetInteger(chart_id,name,OBJPROP_STATE,false);               // button state (clicked/unclicked)
      ObjectSetInteger(chart_id,name,OBJPROP_ZORDER,z_order);            // Z-order for getting the click event
      ObjectSetString(chart_id,name,OBJPROP_TOOLTIP,"\n");               // no tooltip
     }
  }
따라서 하위 창에서 차트 생성은 CreateChartInSubwindow() 함수에 의해 수행됩니다.
//+------------------------------------------------------------------+
//| Creating a chart object in a subwindow                           |
//+------------------------------------------------------------------+
void CreateChartInSubwindow(int             window_number,  // subwindow number
                            int             x_distance,     // X-coordinate
                            int             y_distance,     // Y-coordinate
                            int             x_size,         // width
                            int             y_size,         // height
                            string          name,           // object name
                            string          symbol,         // symbol
                            ENUM_TIMEFRAMES timeframe,      // time frame
                            int             subchart_scale, // bar scale
                            bool            show_dates,     // show date scale
                            bool            show_prices,    // show price scale
                            bool            show_ohlc,      // show OHLC prices
                            bool            show_ask_bid,   // show ask/bid levels
                            bool            show_levels,    // show trade levels
                            string          tooltip)        // tooltip
  {
//--- If the object has been created successfully
   if(ObjectCreate(0,name,OBJ_CHART,window_number,0,0))
     {
      //--- Set the properties of the chart object
      ObjectSetInteger(0,name,OBJPROP_CORNER,CORNER_LEFT_UPPER);   // chart corner
      ObjectSetInteger(0,name,OBJPROP_XDISTANCE,x_distance);       // X-coordinate
      ObjectSetInteger(0,name,OBJPROP_YDISTANCE,y_distance);       // Y-coordinate
      ObjectSetInteger(0,name,OBJPROP_XSIZE,x_size);               // width
      ObjectSetInteger(0,name,OBJPROP_YSIZE,y_size);               // height
      ObjectSetInteger(0,name,OBJPROP_CHART_SCALE,subchart_scale); // bar scale
      ObjectSetInteger(0,name,OBJPROP_DATE_SCALE,show_dates);      // date scale
      ObjectSetInteger(0,name,OBJPROP_PRICE_SCALE,show_prices);    // price scale
      ObjectSetString(0,name,OBJPROP_SYMBOL,symbol);               // symbol
      ObjectSetInteger(0,name,OBJPROP_PERIOD,timeframe);           // time frame
      ObjectSetString(0,name,OBJPROP_TOOLTIP,tooltip);             // tooltip
      ObjectSetInteger(0,name,OBJPROP_BACK,false);                 // object in the foreground
      ObjectSetInteger(0,name,OBJPROP_SELECTABLE,false);           // object is not available for selection
      ObjectSetInteger(0,name,OBJPROP_COLOR,clrWhite);             // white color
      //--- Get the chart object identifier
      long subchart_id=ObjectGetInteger(0,name,OBJPROP_CHART_ID);
      //--- Set the special properties of the chart object
      ChartSetInteger(subchart_id,CHART_SHOW_OHLC,show_ohlc);           // OHLC
      ChartSetInteger(subchart_id,CHART_SHOW_TRADE_LEVELS,show_levels); // trade levels
      ChartSetInteger(subchart_id,CHART_SHOW_BID_LINE,show_ask_bid);    // bid level
      ChartSetInteger(subchart_id,CHART_SHOW_ASK_LINE,show_ask_bid);    // ask level
      ChartSetInteger(subchart_id,CHART_COLOR_LAST,clrLimeGreen);       // color of the level of the last executed deal
      ChartSetInteger(subchart_id,CHART_COLOR_STOP_LEVEL,clrRed);       // color of Stop order levels
      //--- Refresh the chart object
      ChartRedraw(subchart_id);
     }
  }
위의 코드에서는 먼저 차트 개체에 대한 표준 차트 속성을 설정합니다. 차트 개체 식별자를 가져온 후 특수 속성이 설정됩니다. 차트 개체 식별자가 전달되는 ChartRedraw() 함수를 사용하여 차트 개체를 새로 고치는 것도 중요합니다.
컨트롤 설정을 AddTimeframeButtons() 및 AddPropertyButtons()의 두 함수로 나누어 보겠습니다.
//+------------------------------------------------------------------+
//| Adding time frame buttons                                        |
//+------------------------------------------------------------------+
void AddTimeframeButtons()
  {
   int x_dist =1;   // Indent from the left side of the chart
   int y_dist =125; // Indent from the bottom of the chart
   int x_size =28;  // Button width
   int y_size =20;  // Button height
//---
   for(int i=0; i<TIMEFRAME_BUTTONS; i++)
     {
      //--- If 7 buttons have already been added to the same row, set the coordinates for the next row
      if(i%7==0)
        {
         x_dist=1;
         y_dist-=21;
        }
      //--- Add a time frame button
      CreateButton(0,0,timeframe_button_names[i],timeframe_button_texts[i],
                   ANCHOR_LEFT_LOWER,CORNER_LEFT_LOWER,"Arial",8,
                   cOffButtonFont,cOffButtonBackground,cOffButtonBorder,
                   x_size,y_size,x_dist,y_dist,3);
      //--- Set the X-coordinate for the next button
      x_dist+=x_size+1;
     }
  }
//+------------------------------------------------------------------+
//| Adding buttons of chart properties                               |
//+------------------------------------------------------------------+
void AddPropertyButtons()
  {
   int x_dist =1;  // Indent from the left side of the chart
   int y_dist =41; // Indent from the bottom of the chart
   int x_size =66; // Button width
   int y_size =20; // Button height
//---
   for(int i=0; i<PROPERTY_BUTTONS; i++)
     {
      //--- If the first three buttons have already been added, set the coordinates for the next row
      if(i==3)
        {
         x_dist=1;
         y_dist-=21;
        }
      //--- Add a button
      CreateButton(0,0,property_button_names[i],property_button_texts[i],
                   ANCHOR_LEFT_LOWER,CORNER_LEFT_LOWER,"Arial",8,
                   cOffButtonFont,cOffButtonBackground,cOffButtonBorder,
                   property_button_widths[i],y_size,x_dist,y_dist,3);
      //--- Set the X-coordinate for the next button
      x_dist+=property_button_widths[i]+1;
     }
  }
차트에서 지표를 삭제할 때 프로그램에서 생성한 개체도 삭제해야 합니다. 이를 위해 다음과 같은 보조 기능이 필요합니다.
//+------------------------------------------------------------------+
//| Deleting the panel with time frame buttons                       |
//+------------------------------------------------------------------+
void DeleteTimeframeButtons()
  {
   for(int i=0; i<TIMEFRAME_BUTTONS; i++)
      DeleteObjectByName(timeframe_button_names[i]);
  }
//+------------------------------------------------------------------+
//| Deleting the panel with buttons of chart properties              |
//+------------------------------------------------------------------+
void DeletePropertyButtons()
  {
   for(int i=0; i<PROPERTY_BUTTONS; i++)
      DeleteObjectByName(property_button_names[i]);
  }
//+------------------------------------------------------------------+
//| Deleting objects by name                                         |
//+------------------------------------------------------------------+
void DeleteObjectByName(string object_name)
  {
//--- If such object exists
   if(ObjectFind(ChartID(),object_name)>=0)
     {
      //--- Delete it or print the relevant error message
      if(!ObjectDelete(ChartID(),object_name))
         Print("Error ("+IntegerToString(GetLastError())+") when deleting the object!");
     }
  }
이제 지표를 로드할 때 차트에 패널이 설정되고 차트에서 지표를 삭제할 때 모든 패널 개체가 삭제되도록 하려면 핸들러 함수 OnInit() 및 OnDeinit()에 다음 코드 문자열을 추가해야 합니다.
//+------------------------------------------------------------------+
//| Custom indicator initialization function                         |
//+------------------------------------------------------------------+
int OnInit()
  {
//--- Add the panel with time frame buttons to the chart
   AddTimeframeButtons();
//--- Add the panel with buttons of chart properties to the chart
   AddPropertyButtons();
//--- Redraw the chart
   ChartRedraw();
//--- Initialization completed successfully
   return(INIT_SUCCEEDED);
  }
//+------------------------------------------------------------------+
//| Indicator deinitialization                                       |
//+------------------------------------------------------------------+
void OnDeinit(const int reason)
  {
//--- If the indicator has been deleted from the chart
   if(reason==REASON_REMOVE)
     {
      //--- Delete buttons
      DeleteTimeframeButtons();
      DeletePropertyButtons();
      //--- Redraw the chart
      ChartRedraw();
     }
  }
지금 지표를 컴파일하여 차트에 첨부하면 아래 스크린샷과 같은 패널이 표시됩니다.
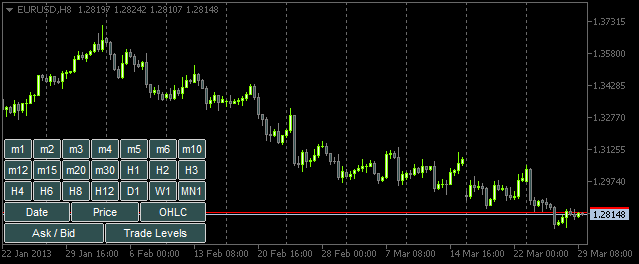
그림 4. 버튼이 있는 패널
이제 사용자와 패널 간의 상호 작용을 위한 기능을 만들 준비가 되었습니다. 실질적으로 이들 모두는 기본 OnChartEvent() 함수에서 호출됩니다. 이 글에서는 이 함수에서 처리될 두 가지 이벤트를 고려할 것입니다.
- CHARTEVENT_OBJECT_CLICK - 그래픽 개체를 클릭하는 이벤트입니다.
- CHARTEVENT_CHART_CHANGE - 차트의 크기를 조정하거나 속성 대화 상자 창을 사용하여 차트 속성을 수정하는 이벤트입니다.
CHARTEVENT_OBJECT_CLICK 이벤트부터 시작하겠습니다. 우리가 작성하려고 하는 ChartEventObjectClick() 함수는 OnChartEvent() 함수에서 모든 인수를 가져옵니다(다른 이벤트의 경우 유사한 함수를 만들 것입니다).
//+------------------------------------------------------------------+
//| Event of the click on a graphical object                         |
//+------------------------------------------------------------------+
bool ChartEventObjectClick(int id,
                           long lparam,
                           double dparam,
                           string sparam)
  {
//--- Click on a graphical object
   if(id==CHARTEVENT_OBJECT_CLICK)
     {
      //--- If a time frame button has been clicked, set/delete 'SubWindow' and a chart object
      if(ToggleSubwindowAndChartObject(sparam))
         return(true);
      //--- If a button of chart properties has been clicked, set/delete the property in chart objects
      if(ToggleChartObjectProperty(sparam))
         return(true);
     }
//---
   return(false);
  }
ChartEventObjectClick() 함수 코드는 간단합니다. 패널 버튼 클릭 이벤트는 식별자를 사용하여 결정됩니다. 그런 다음 구현 로직은 시간 프레임 버튼을 클릭하는 이벤트와 차트 속성의 버튼을 클릭하는 이벤트의 두 가지 방향으로 나뉩니다. 왼쪽 클릭한 개체의 이름을 포함하는 sparam 문자열 매개변수는 해당 ToggleSubwindowAndChartObject() 및 ToggleChartObjectProperty() 함수에 전달됩니다.
이 함수들의 소스 코드를 살펴봅시다. ToggleSubwindowAndChartObject()부터 시작하겠습니다.
//+------------------------------------------------------------------+
//| Setting/deleting SubWindow and a chart object                    |
//+------------------------------------------------------------------+
bool ToggleSubwindowAndChartObject(string clicked_object_name)
  {
//--- Make sure that the click was on the time frame button object
   if(CheckClickOnTimeframeButton(clicked_object_name))
     {
      //--- Check if the SubWindow exists
      subwindow_number=ChartWindowFind(0,subwindow_shortname);
      //--- If the SubWindow does not exist, set it
      if(subwindow_number<0)
        {
         //--- If the SubWindow is set
         if(AddSubwindow())
           {
            //--- Add chart objects to it
            AddChartObjectsToSubwindow(clicked_object_name);
            return(true);
           }
        }
      //--- If the SubWindow exists
      if(subwindow_number>0)
        {
         //--- Add chart objects to it
         AddChartObjectsToSubwindow(clicked_object_name);
         return(true);
        }
     }
//---
   return(false);
  }
위의 코드에 제공된 주석을 사용하여 구현 로직을 쉽게 이해할 수 있어야 합니다. 강조 표시된 문자열에는 아래에서 추가로 코드를 찾을 수 있는 몇 가지 사용자 정의 기능이 있습니다.
CheckClickOnTimeframeButton() 함수는 클릭한 버튼이 시간 프레임 패널과 연결된 경우 true를 반환합니다.
//+------------------------------------------------------------------+
//| Checking if a time frame button has been clicked                 |
//+------------------------------------------------------------------+
bool CheckClickOnTimeframeButton(string clicked_object_name)
  {
//--- Iterate over all time frame buttons and check the names
   for(int i=0; i<TIMEFRAME_BUTTONS; i++)
     {
      //--- Report the match
      if(clicked_object_name==timeframe_button_names[i])
         return(true);
     }
//---
   return(false);
  }
기간 버튼 클릭이 확인되면 현재 메인 차트에 SubWindow가 추가되었는지 확인합니다. 그렇지 않은 경우 AddSubwindow() 함수를 사용하여 설정됩니다.
//+------------------------------------------------------------------+
//| Adding a subwindow for chart objects                             |
//+------------------------------------------------------------------+
bool AddSubwindow()
  {
//--- Get the "SubWindow" indicator handle
   subwindow_handle=iCustom(_Symbol,_Period,subwindow_path);
//--- If the handle has been obtained
   if(subwindow_handle!=INVALID_HANDLE)
     {
      //--- Determine the number of windows in the chart for the subwindow number
      subwindow_number=(int)ChartGetInteger(0,CHART_WINDOWS_TOTAL);
      //--- Add the SubWindow to the chart
      if(!ChartIndicatorAdd(0,subwindow_number,subwindow_handle))
         Print("Failed to add the SUBWINDOW indicator ! ");
      //--- The subwindow exists
      else
         return(true);
     }
//--- There is no subwindow
   return(false);
  }
그런 다음 AddChartObjectsToSubwindow() 함수를 사용하여 생성된 하위 창에 차트 개체를 추가합니다.
//+------------------------------------------------------------------+
//| Adding chart objects to the subwindow                            |
//+------------------------------------------------------------------+
void AddChartObjectsToSubwindow(string clicked_object_name)
  {
   ENUM_TIMEFRAMES tf                 =WRONG_VALUE; // Time frame
   string          object_name        ="";          // Object name
   string          object_text        ="";          // Object text
   int             x_distance         =0;           // X-coordinate
   int             total_charts       =0;           // Total chart objects
   int             chart_object_width =0;           // Chart object width
//--- Get the bar scale and SubWindow height/width
   chart_scale=(int)ChartGetInteger(0,CHART_SCALE);
   chart_width=(int)ChartGetInteger(0,CHART_WIDTH_IN_PIXELS,subwindow_number);
   chart_height=(int)ChartGetInteger(0,CHART_HEIGHT_IN_PIXELS,subwindow_number);
//--- Get the number of chart objects in the SUBWINDOW
   total_charts=ObjectsTotal(0,subwindow_number,OBJ_CHART);
//--- If there are no chart objects
   if(total_charts==0)
     {
      //--- Check if a time frame button has been clicked
      if(CheckClickOnTimeframeButton(clicked_object_name))
        {
         //--- Initialize the array of time frame buttons
         InitializeTimeframeButtonStates();
         //--- Get the time frame button text for the chart object tooltip
         object_text=ObjectGetString(0,clicked_object_name,OBJPROP_TEXT);
         //--- Get the time frame for the chart object
         tf=StringToTimeframe(object_text);
         //--- Set the chart object
         CreateChartInSubwindow(subwindow_number,0,0,chart_width,chart_height,
                                "chart_object_"+object_text,_Symbol,tf,chart_scale,
                                property_button_states[0],property_button_states[1],
                                property_button_states[2],property_button_states[3],
                                property_button_states[4],object_text);
         //--- Refresh the chart and exit
         ChartRedraw();
         return;
        }
     }
//--- If chart objects already exist in the SubWindow
   if(total_charts>0)
     {
      //--- Get the number of clicked time frame buttons and initialize the array of states
      int pressed_buttons_count=InitializeTimeframeButtonStates();
      //--- If there are no clicked buttons, delete the SubWindow
      if(pressed_buttons_count==0)
         DeleteSubwindow();
      //--- If the clicked buttons exist
      else
        {
         //--- Delete all chart objects from the subwindow
         ObjectsDeleteAll(0,subwindow_number,OBJ_CHART);
         //--- Get the width for chart objects
         chart_object_width=chart_width/pressed_buttons_count;
         //--- Iterate over all buttons in a loop
         for(int i=0; i<TIMEFRAME_BUTTONS; i++)
           {
            //--- If the button is clicked
            if(timeframe_button_states[i])
              {
               //--- Get the time frame button text for the chart object tooltip
               object_text=ObjectGetString(0,timeframe_button_names[i],OBJPROP_TEXT);
               //--- Get the time frame for the chart object
               tf=StringToTimeframe(object_text);
               //--- Set the chart object
               CreateChartInSubwindow(subwindow_number,x_distance,0,chart_object_width,chart_height,
                                      chart_object_names[i],_Symbol,tf,chart_scale,
                                      property_button_states[0],property_button_states[1],
                                      property_button_states[2],property_button_states[3],
                                      property_button_states[4],object_text);
               //--- Determine the X-coordinate for the next chart object
               x_distance+=chart_object_width;
              }
           }
        }
     }
//--- Refresh the chart
   ChartRedraw();
  }
위의 코드에 제공된 자세한 설명은 기능 작동을 이해하는 데 도움이 될 것입니다. 우리가 전에 만나지 못한 사용자 정의 기능이 강조 표시됩니다.
InitializeTimeframeButtonStates() 함수는 클릭한 시간 프레임 버튼의 수를 반환하고 해당 상태 배열을 초기화합니다. 또한 버튼 상태에 따라 색상을 설정합니다.
//+------------------------------------------------------------------+
//| Initializing array of time frame button states and               |
//| returning the number of clicked buttons                          |
//+------------------------------------------------------------------+
int InitializeTimeframeButtonStates()
  {
//--- Counter of the clicked time frame buttons
   int pressed_buttons_count=0;
//--- Iterate over all time frame buttons and count the clicked ones
   for(int i=0; i<TIMEFRAME_BUTTONS; i++)
     {
      //--- If the button is clicked
      if(ObjectGetInteger(0,timeframe_button_names[i],OBJPROP_STATE))
        {
         //--- Indicate it in the current index of the array
         timeframe_button_states[i]=true;
         //--- Set clicked button colors
         ObjectSetInteger(0,timeframe_button_names[i],OBJPROP_COLOR,cOnButtonFont);
         ObjectSetInteger(0,timeframe_button_names[i],OBJPROP_BGCOLOR,cOnButtonBackground);
         //--- Increase the counter by one
         pressed_buttons_count++;
        }
      else
        {
         //--- Set unclicked button colors
         ObjectSetInteger(0,timeframe_button_names[i],OBJPROP_COLOR,cOffButtonFont);
         ObjectSetInteger(0,timeframe_button_names[i],OBJPROP_BGCOLOR,cOffButtonBackground);
         //--- Indicate that the button is unclicked
         timeframe_button_states[i]=false;
        }
     }
//--- Return the number of clicked buttons
   return(pressed_buttons_count);
  }
DeleteSubwindow() 함수는 매우 간단합니다. 차트에 대한 하위 창의 존재를 확인하고 삭제합니다.
//+------------------------------------------------------------------+
//| Deleting subwindow for chart objects                             |
//+------------------------------------------------------------------+
void DeleteSubwindow()
  {
//--- If the SubWindow exists
   if((subwindow_number=ChartWindowFind(0,subwindow_shortname))>0)
     {
      //--- Delete it
      if(!ChartIndicatorDelete(0,subwindow_number,subwindow_shortname))
         Print("Failed to delete the "+subwindow_shortname+" indicator!");
     }
  }
이제 차트 개체의 속성을 살펴봐야 합니다. 즉, ChartEventObjectClick() 함수로 돌아가서 ToggleChartObjectProperty() 함수를 고려합니다. 클릭한 개체의 이름도 전달됩니다.
//+------------------------------------------------------------------+
//| Setting/deleting chart object property                           |
//| depending on the clicked button state                            |
//+------------------------------------------------------------------+
bool ToggleChartObjectProperty(string clicked_object_name)
  {

//--- If the "Date" button is clicked
   if(clicked_object_name=="property_button_date")
     {
      //--- If the button is clicked
      if(SetButtonColor(clicked_object_name))
         ShowDate(true);
      //--- If the button is unclicked
      else
         ShowDate(false);
      //--- Refresh the chart and exit
      ChartRedraw();
      return(true);
     }
//--- If the "Price" button is clicked
   if(clicked_object_name=="property_button_price")
     {
      //--- If the button is clicked
      if(SetButtonColor(clicked_object_name))
         ShowPrice(true);
      //--- If the button is unclicked
      else
         ShowPrice(false);
      //--- Refresh the chart and exit
      ChartRedraw();
      return(true);
     }
//--- If the "OHLC" button is clicked
   if(clicked_object_name=="property_button_ohlc")
     {
      //--- If the button is clicked
      if(SetButtonColor(clicked_object_name))
         ShowOHLC(true);
      //--- If the button is unclicked
      else
         ShowOHLC(false);
      //--- Refresh the chart and exit
      ChartRedraw();
      return(true);
     }
//--- If the "Ask/Bid" button is clicked
   if(clicked_object_name=="property_button_askbid")
     {
      //--- If the button is clicked
      if(SetButtonColor(clicked_object_name))
         ShowAskBid(true);
      //--- If the button is unclicked
      else
         ShowAskBid(false);
      //--- Refresh the chart and exit
      ChartRedraw();
      return(true);
     }
//--- If the "Trade Levels" button is clicked
   if(clicked_object_name=="property_button_trade_levels")
     {
      //--- If the button is clicked
      if(SetButtonColor(clicked_object_name))
         ShowTradeLevels(true);
      //--- If the button is unclicked
      else
         ShowTradeLevels(false);
      //--- Refresh the chart and exit
      ChartRedraw();
      return(true);
     }
//--- No matches
   return(false);
  }
위의 코드에서 차트 속성과 관련된 개체의 이름과 비교하여 클릭한 개체의 이름이 연속적으로 표시됩니다. 일치하는 항목이 있으면 SetButtonColor() 함수에서 버튼이 클릭되었는지 확인하고 해당 버튼 색상을 설정합니다.
//+------------------------------------------------------------------+
//| Setting color of button elements depending on the state          |
//+------------------------------------------------------------------+
bool SetButtonColor(string clicked_object_name)
  {
//--- If the button is clicked
   if(ObjectGetInteger(0,clicked_object_name,OBJPROP_STATE))
     {
      //--- Set clicked button colors
      ObjectSetInteger(0,clicked_object_name,OBJPROP_COLOR,cOnButtonFont);
      ObjectSetInteger(0,clicked_object_name,OBJPROP_BGCOLOR,cOnButtonBackground);
      return(true);
     }
//--- If the button is unclicked
   if(!ObjectGetInteger(0,clicked_object_name,OBJPROP_STATE))
     {
      //--- Set unclicked button colors
      ObjectSetInteger(0,clicked_object_name,OBJPROP_COLOR,cOffButtonFont);
      ObjectSetInteger(0,clicked_object_name,OBJPROP_BGCOLOR,cOffButtonBackground);
      return(false);
     }
//---
   return(false);
  }
SetButtonColor() 함수는 버튼 상태를 반환합니다. 이 속성에 따라 프로그램은 SubWindow의 모든 차트 개체에서 특정 속성을 활성화 또는 비활성화해야 함을 관련 기능에 알립니다. 각 속성에 대해 작성된 별도의 기능이 있습니다. 해당 기능 코드는 다음과 같습니다.
//+------------------------------------------------------------------+
//| Enabling/disabling dates for all chart objects                   |
//+------------------------------------------------------------------+
void ShowDate(bool state)
  {
   int    total_charts =0;  // Number of objects
   string chart_name  =""; // Chart object name
//--- Check if the SubWindow exists
//    If it exists, then
   if((subwindow_number=ChartWindowFind(0,subwindow_shortname))>0)
     {
      //--- Get the number of chart objects
      total_charts=ObjectsTotal(0,subwindow_number,OBJ_CHART);
      //--- Iterate over all chart objects in a loop
      for(int i=0; i<total_charts; i++)
        {
         //--- Get the chart object name
         chart_name=ObjectName(0,i,subwindow_number,OBJ_CHART);
         //--- Set the property
         ObjectSetInteger(0,chart_name,OBJPROP_DATE_SCALE,state);
        }
      //--- Set the button state to the relevant index
      if(state)
         property_button_states[0]=true;
      else
         property_button_states[0]=false;
      //--- Refresh the chart
      ChartRedraw();
     }
  }
//+------------------------------------------------------------------+
//| Enabling/disabling prices for all chart objects                  |
//+------------------------------------------------------------------+
void ShowPrice(bool state)
  {
   int    total_charts =0;  // Number of objects
   string chart_name  =""; // Chart object name
//--- Check if the SubWindow exists
//    If it exists, then
   if((subwindow_number=ChartWindowFind(0,subwindow_shortname))>0)
     {
      //--- Get the number of chart objects
      total_charts=ObjectsTotal(0,subwindow_number,OBJ_CHART);
      //--- Iterate over all chart objects in a loop
      for(int i=0; i<total_charts; i++)
        {
         //--- Get the chart object name
         chart_name=ObjectName(0,i,subwindow_number,OBJ_CHART);
         //--- Set the property
         ObjectSetInteger(0,chart_name,OBJPROP_PRICE_SCALE,state);
        }
      //--- Set the button state to the relevant index
      if(state)
         property_button_states[1]=true;
      else
         property_button_states[1]=false;
      //--- Refresh the chart
      ChartRedraw();
     }
  }
//+------------------------------------------------------------------+
//| Enabling/disabling OHLC for all chart objects                    |
//+------------------------------------------------------------------+
void ShowOHLC(bool state)
  {
   int    total_charts =0;  // Number of objects
   long   subchart_id =0;  // Chart object identifier
   string chart_name  =""; // Chart object name
//--- Check if the SubWindow exists
//    If it exists, then
   if((subwindow_number=ChartWindowFind(0,subwindow_shortname))>0)
     {
      //--- Get the number of chart objects
      total_charts=ObjectsTotal(0,subwindow_number,OBJ_CHART);
      //--- Iterate over all chart objects in a loop
      for(int i=0; i<total_charts; i++)
        {
         //--- Get the chart object name
         chart_name=ObjectName(0,i,subwindow_number,OBJ_CHART);
         //--- Get the chart object identifier
         subchart_id=ObjectGetInteger(0,chart_name,OBJPROP_CHART_ID);
         //--- Set the property
         ChartSetInteger(subchart_id,CHART_SHOW_OHLC,state);
         //--- Refresh the chart object
         ChartRedraw(subchart_id);
        }
      //--- Set the button state to the relevant index
      if(state)
         property_button_states[2]=true;
      else
         property_button_states[2]=false;
      //--- Refresh the chart
      ChartRedraw();
     }
  }
//+------------------------------------------------------------------+
//| Enabling/disabling Ask/Bid levels for all chart objects          |
//+------------------------------------------------------------------+
void ShowAskBid(bool state)
  {
   int    total_charts =0;  // Number of objects
   long   subchart_id =0;  // Chart object identifier
   string chart_name  =""; // Chart object name
//--- Check if the SubWindow exists
//    If it exists, then
   if((subwindow_number=ChartWindowFind(0,subwindow_shortname))>0)
     {
      //--- Get the number of chart objects
      total_charts=ObjectsTotal(0,subwindow_number,OBJ_CHART);
      //--- Iterate over all chart objects in a loop
      for(int i=0; i<total_charts; i++)
        {
         //--- Get the chart object name
         chart_name=ObjectName(0,i,subwindow_number,OBJ_CHART);
         //--- Get the chart object identifier
         subchart_id=ObjectGetInteger(0,chart_name,OBJPROP_CHART_ID);
         //--- Set the properties
         ChartSetInteger(subchart_id,CHART_SHOW_ASK_LINE,state);
         ChartSetInteger(subchart_id,CHART_SHOW_BID_LINE,state);
         //--- Refresh the chart object
         ChartRedraw(subchart_id);
        }
      //--- Set the button state to the relevant index
      if(state)
         property_button_states[3]=true;
      else
         property_button_states[3]=false;
      //--- Refresh the chart
      ChartRedraw();
     }
  }
//+------------------------------------------------------------------+
//| Enabling/disabling trade levels for all chart objects            |
//+------------------------------------------------------------------+
void ShowTradeLevels(bool state)
  {
   int    total_charts =0;  // Number of objects
   long   subchart_id =0;  // Chart object identifier
   string chart_name  =""; // Chart object name
//--- Check if the SubWindow exists
//    If it exists, then
   if((subwindow_number=ChartWindowFind(0,subwindow_shortname))>0)
     {
      //--- Get the number of chart objects
      total_charts=ObjectsTotal(0,subwindow_number,OBJ_CHART);
      //--- Iterate over all chart objects in a loop
      for(int i=0; i<total_charts; i++)
        {
         //--- Get the chart object name
         chart_name=ObjectName(0,i,subwindow_number,OBJ_CHART);
         //--- Get the chart object identifier
         subchart_id=ObjectGetInteger(0,chart_name,OBJPROP_CHART_ID);
         //--- Set the property
         ChartSetInteger(subchart_id,CHART_SHOW_TRADE_LEVELS,state);
         //--- Refresh the chart object
         ChartRedraw(subchart_id);
        }
      //--- Set the button state to the relevant index
      if(state)
         property_button_states[4]=true;
      else
         property_button_states[4]=false;
      //--- Refresh the chart
      ChartRedraw();
     }
  }
이제 모든 기능이 패널과 상호 작용할 준비가 되었습니다. 기본 OnChartEvent() 함수에 코드 문자열 하나만 추가하면 됩니다.
//+------------------------------------------------------------------+
//| ChartEvent function                                              |
//+------------------------------------------------------------------+
void OnChartEvent(const int id,
                  const long &lparam,
                  const double &dparam,
                  const string &sparam)
  {
//--- The CHARTEVENT_OBJECT_CLICK event
   if(ChartEventObjectClick(id,lparam,dparam,sparam))
      return;

  }
지표가 컴파일되어 차트에서 바로 실행되면 해당 시간대 버튼을 클릭하면 차트 개체가 하위 창에 추가됩니다. 또한 속성 버튼 중 하나를 클릭하면 차트 개체에서 해당 변경 사항을 볼 수 있습니다.
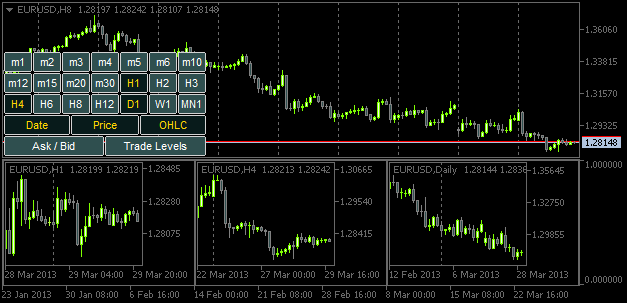
그림 5. 지정된 속성으로 차트 개체 추가
그러나 차트 창 또는 하위 창의 크기를 조정하면 차트 개체 크기가 그에 따라 조정되지 않습니다. 자, 이제 CHARTEVENT_CHART_CHANGE 이벤트를 살펴볼 시간입니다.
"그래픽 개체 클릭" 이벤트를 추적하기 위해 ChartEventObjectClick() 함수를 만든 것처럼 이제 ChartEventChartChange() 함수를 작성해보겠습니다.
//+------------------------------------------------------------------+
//| Event of modifying the chart properties                          |
//+------------------------------------------------------------------+
bool ChartEventChartChange(int id,
                           long lparam,
                           double dparam,
                           string sparam)
  {
//--- Chart has been resized or the chart properties have been modified
   if(id==CHARTEVENT_CHART_CHANGE)
     {
      //--- If the SubWindow has been deleted (or does not exist), while the time frame buttons are clicked,
      //    release all the buttons (reset)
      if(OnSubwindowDelete())
         return(true);
      //--- Save the height and width values of the main chart and SubWindow, if it exists
      GetSubwindowWidthAndHeight();
      //--- Adjust the sizes of chart objects
      AdjustChartObjectsSizes();
      //--- Refresh the chart and exit
      ChartRedraw();
      return(true);
     }
//---
   return(false);
  }
프로그램에서 기본 차트 크기 또는 속성이 수정되었음을 확인했다면 먼저 OnSubwindowDelete() 함수를 사용하여 SubWindow가 삭제되었는지 확인합니다. 하위 창을 찾을 수 없으면 패널이 재설정됩니다.
//+------------------------------------------------------------------+
//| Response to Subwindow deletion                                   |
//+------------------------------------------------------------------+
bool OnSubwindowDelete()
  {
//--- if there is no SubWindow
   if(ChartWindowFind(0,subwindow_shortname)<1)
     {
      //--- Reset the panel with time frame buttons
      AddTimeframeButtons();
      ChartRedraw();
      return(true);
     }
//--- SubWindow exists
   return(false);
  }
하위 창이 있어야 할 위치에 있으면 하위 창 너비와 높이 값이 GetSubwindowWidthAndHeight() 함수의 전역 변수에 할당됩니다.
//+------------------------------------------------------------------+
//| Saving the SubWindow height and width values                     |
//+------------------------------------------------------------------+
void GetSubwindowWidthAndHeight()
  {
//--- Check if there is a subwindow named SubWindow
   if((subwindow_number=ChartWindowFind(0,subwindow_shortname))>0)
     {
      // Get the subwindow height and width
      chart_height=(int)ChartGetInteger(0,CHART_HEIGHT_IN_PIXELS,subwindow_number);
      chart_width=(int)ChartGetInteger(0,CHART_WIDTH_IN_PIXELS,subwindow_number);
     }
  }
마지막으로 AdjustChartObjectsSizes() 함수에서 차트 개체의 크기를 조정합니다.
//+------------------------------------------------------------------+
//| Adjusting width of chart objects when modifying the window width |
//+------------------------------------------------------------------+
void AdjustChartObjectsSizes()
  {
   int             x_distance         =0;           // X-coordinate
   int             total_objects      =0;           // Number of chart objects
   int             chart_object_width =0;           // Chart object width
   string          object_name        ="";          // Object name
   ENUM_TIMEFRAMES TF                 =WRONG_VALUE; // Time frame
//--- Get the SubWindow number
   if((subwindow_number=ChartWindowFind(0,subwindow_shortname))>0)
     {
      //--- Get the total number of chart objects
      total_objects=ObjectsTotal(0,subwindow_number,OBJ_CHART);
      //--- If there are no objects, delete the subwindow and exit
      if(total_objects==0)
        {
         DeleteSubwindow();
         return;
        }
      //--- Get the width for chart objects
      chart_object_width=chart_width/total_objects;
      //--- Iterate over all chart objects in a loop
      for(int i=total_objects-1; i>=0; i--)
        {
         //--- Get the name
         object_name=ObjectName(0,i,subwindow_number,OBJ_CHART);
         //--- Set the chart object width and height
         ObjectSetInteger(0,object_name,OBJPROP_YSIZE,chart_height);
         ObjectSetInteger(0,object_name,OBJPROP_XSIZE,chart_object_width);
         //--- Set the chart object position
         ObjectSetInteger(0,object_name,OBJPROP_YDISTANCE,0);
         ObjectSetInteger(0,object_name,OBJPROP_XDISTANCE,x_distance);
         //--- Set the new X-coordinate for the next chart object
         x_distance+=chart_object_width;
        }
     }
  }
메인 차트의 크기 및 속성 수정 이벤트를 추적하려면 OnChartEvent() 함수에 다음 문자열을 추가해야 합니다.
지표를 컴파일하여 차트에 첨부하면 메인 창의 크기를 조정할 때마다 차트 개체가 하위 창 크기로 조정되는 것을 볼 수 있습니다.
결론
여기서 글을 마치도록 하겠습니다. 숙제로 메인 차트의 심볼이 수정될 때 차트 개체의 심볼 조정과 같은 기능을 구현해 보십시오. 차트 개체의 시간 프레임이 낮은 것에서 높은 것(왼쪽에서 오른쪽)으로 연속적으로 설정되도록 할 수도 있습니다. 이 가능성은 위에 설명된 지표 버전에서 구현되지 않았습니다.
기성 애플리케이션에 대한 설명 - TF PANEL에서 이러한 기능의 구현을 보여주는 비디오를 찾을 수 있습니다. 소스 코드 파일은 글에 첨부되어 있으며 다운로드할 수 있습니다.
MetaQuotes 소프트웨어 사를 통해 러시아어가 번역됨.
원본 기고글: https://www.mql5.com/ru/articles/749
경고: 이 자료들에 대한 모든 권한은 MetaQuotes(MetaQuotes Ltd.)에 있습니다. 이 자료들의 전부 또는 일부에 대한 복제 및 재출력은 금지됩니다.
이 글은 사이트 사용자가 작성했으며 개인의 견해를 반영합니다. Metaquotes Ltd는 제시된 정보의 정확성 또는 설명 된 솔루션, 전략 또는 권장 사항의 사용으로 인한 결과에 대해 책임을 지지 않습니다.
문서 MQL5 레시피 - 하나의 창에서 여러 시간대 모니터링이 게시되었습니다:
작성자: 아나톨리 카즈하르스키
예를 들어 10초, 30초와 같은 초 단위의 시간 프레임을 추가할 수 있는지 알려주시겠습니까?
매우 편리한 표시기입니다.
예를 들어 10초, 30초와 같이 초 단위의 시간 프레임을 추가할 수 있는지 알려주시겠어요?
안녕하세요 아나톨리님,
훌륭한 글 감사합니다! 하위 창 표시기에 대해 궁금한 점이 있습니다... 별도의 창이 아닌 차트 창에 표시되도록 설정되어있는 것을 보았습니다... 이것이 실수입니까?