Color HLC Bars and Candles

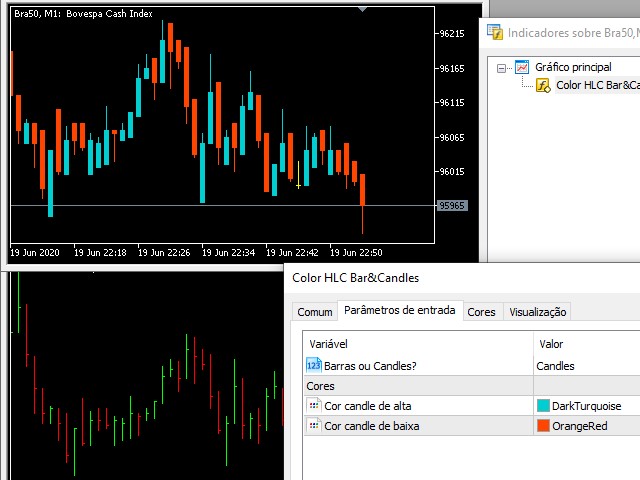
Want to make the graph cleaner?

Don't you use the opening price in your analysis?

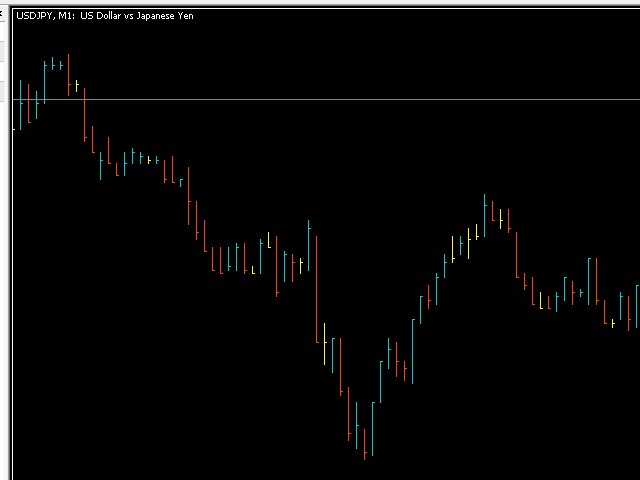
Want to use a chart model that was used by Richard Wyckoff?

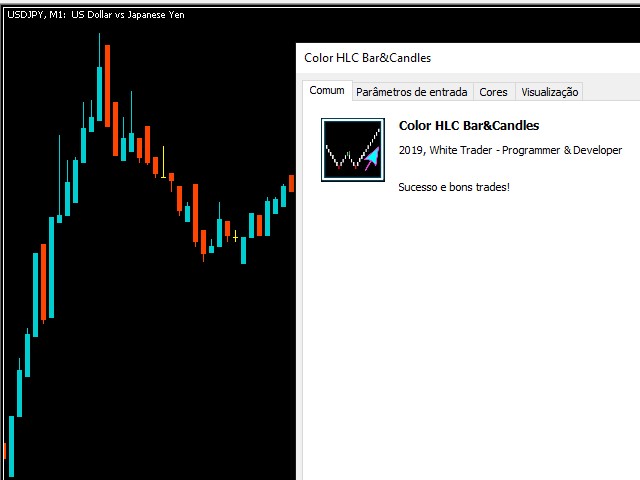
Then you need to know the Color HLC Candles and Bars indicator. In the same indicator you can switch to the display of candles or bars.

Take a look at the other volume indicators to complement your operating.And don't forget to look at the best Vwap Custom (Midas)!

Leave your comment!

Success and good trades!
Рекомендуем также
Follow The Line MT5
Oliver Gideon Amofa Appiah
4.6 (35)
This indicator obeys the popular maxim that: "THE TREND IS YOUR FRIEND" It paints a GREEN line for BUY and also paints a RED line for SELL. (you can change the colors). It gives alarms and alerts of all kinds. IT DOES NOT REPAINT and can be used for all currency pairs and timeframes. Yes, as easy and simple as that. Even a newbie can use it to make great and reliable trades. NB: For best results, get my other premium indicators for more powerful and reliable signals. Get them here: https://www.m
FREE
WAPV Box Effort x Result
Eduardo Da Costa Custodio Santos
WA_PV_BOX_EFFORT X РЕЗУЛЬТАТ для MT5 Индикатор WAPV Box Effort x Result входит в группу индикаторов пакета (Wyckoff Academy Wave Market). Индикатор WAPV Box Effort x Result для MT5 поможет вам определить цену и объем. Его прочтение состоит в том, чтобы помочь идентифицировать усилие x результат. в волнах, созданных графиком. Индикатор WAPV Box Effort x Result для MT5, когда поле зеленого цвета, означает, что объем соответствует спросу, а когда поле красного цвета. объем в пользу предложения. Чем
Donchian Channel DC is the indicator of Donchian Channels, that plots maximum and minimum values of a specific period, besides mean value line. It´s possible to configure simple period for analysis and the indicator will plot all three values. You can trade with this indicator as trend or reversal, according to each strategy. Do not let to test others indicators as soon as others expert advisors.
Общее описание Этот индикатор — усовершенствованная версия классического канала Дончия с добавлением практических функций для реальной торговли. Помимо стандартных трёх линий (верхняя, нижняя и средняя), система определяет пробои и отображает их на графике стрелками, показывая только линию, противоположную текущему направлению тренда для более чистого восприятия. Индикатор включает: Визуальные сигналы : цветные стрелки при пробое Автоматические уведомления : всплывающие окна, push и email Фильтр
FREE
HLC bar MT5 Wyckoff
Eduardo Da Costa Custodio Santos
Индикатор «HLC_bar_MT5 Wyckoff» для MT5 был создан для облегчения анализа во время торговли. Панель HLC использовалась Ричардом Вайкоффом и в настоящее время широко используется в операциях VSA. Вайкофф обнаружил, что использование максимума, минимума и закрытия сделало график намного чище и проще для анализа. Индикатор «HLC_bar_MT5 Wyckoff» позволяет: # Изменить ширину полосы; # Оставьте полосу того же цвета; # И выделите бар, который открывался и закрывался по одной цене. Цвета и ширина легко
Easy GOLD MT5
Franck Martin
3.88 (42)
Easy Gold is the latest addition to the BotGPT family. It is surprising and very powerful. It is ideal for beginners due to its simplicity.  There is absolutely nothing to do, it's 100% automated, simply indicate the percentage of risk you want to take per trade and the EA is ready. Whatever your capital, the EA takes care of everything. Optimized on (XAUUSD).  Unleash all the power with the professional version (AGI Gold) and its connection to the neural network, available in my store. My othe
FREE
Donchian Channel is an indicator created by Richard Donchian. It is formed by taking the highest high and the lowest low of the last specified period in candles. The area between high and low is the channel for the chosen period. Its configuration is simple. It is possible to have the average between the upper and lower lines, plus you have alerts when price hits one side. If you have any questions or find any bugs, please contact me. Enjoy!
FREE
Weis Waves
Flavio Javier Jarabeck
2.83 (18)
The original author is David Weis, an expert in the Wyckoff Method. The Weis Wave is a modern adaptation of the 1930's Wyckoff Method, another expert in Tape Reading techniques and Chart Analysis. Weis Waves takes market volume and stacks it into waves according to price conditions giving the trader valuable insights about the market conditions. If you want to learn more about this subject you can find tons of videos in YouTube. Just look for "The Wickoff Method", "Weis Wave" and "Volume Spread
FREE
Order Book, известный также как Market Book, глубина рынка, стакан цен, Level 2, - это предоставляемая брокером динамически обновляемая таблица с данными по текущим объемам торговых заявок на покупку и продажу для различных уровней цен вблизи Bid и Ask конкретного финансового инструмента. MetaTrader 5 предоставляет возможность трансляции стакана цен , но только в реальном времени. Данный индикатор OrderBook Cumulative Indicator позволяет аккумулировать данные стакана онлайн и визуализировать их
VWAP With Alerts
Francisco Gomes Da Silva
5 (6)
Это простой индикатор VWAP, но мы добавили в него оповещения, чтобы вы знали, когда цена касается простого VWAP или пересекает его. Этот индикатор представляет собой традиционный индикатор VWAP для MetaTrader 5 (MT5). Стандартные параметры такие же, как у обычного VWAP, но у вас есть возможность использовать новые расчеты и лучшее: Когда цена касается или пересекает VWAP, вы узнаете об этом через оповещения, уведомления на мобильном телефоне, электронную почту или звуковые события. бесплатный ин
FREE
MACD Enhanced
Nikita Berdnikov
5 (3)
Представляем   MACD  Enhanced  – усовершенствованный индикатор MACD (Moving Average Convergence Divergence), который предоставляет трейдерам расширенные возможности для анализа тренда и момента на финансовых рынках. Индикатор использует разницу между быстрой и медленной экспоненциальными скользящими средними для определения импульса, направления и силы тренда, создавая четкие визуальные сигналы для потенциальных точек входа и выхода. Внимание!   Для достижения наилучших результатов рекомендуется
FREE
Caicai L&S Yield Histogram Important Notice: This indicator is an integral tool of the automated EA Caicai Long and Short Pair Trading . This indicator visually displays the percentage deviation (Yield %) of a pair's current spread relative to its own historical mean. It is an excellent tool for quickly visualizing the gross financial potential of a market distortion in Long & Short operations. Main Features: Percentage Visualization: Understand the size of the distortion in palpable percentage
Поддержка и Сопротивление Предыдущего Дня Платформа: MetaTrader 5 Тип: Пользовательский индикатор Отображение: Окно графика (наложение) Функции: Вычисляет уровни поддержки и сопротивления на основе экстремумов предыдущего дня. Использует скользящее окно ( SampleWindowSize ) для анализа локального диапазона цен. Определяет зону поддержки , если текущая волатильность значительно ниже предыдущих максимумов. Определяет зону сопротивления , если цена торгуется выше предыдущих минимумов. Отображает 4
FREE
Phoenix Delta Volume
Nigel Nii Darku Narnor Darko
This is the Phoenix Institutional SMC Dashboard (Emerald-Teal Edition). It is engineered to provide retail traders with the same "Volume-at-Price" clarity used by institutional desks. Below is a full breakdown of the benefits, the high-confluence logic for entries, and how to manage your trades using the current visual engine. Strategic Benefits to the User Sentiment over Price: Most indicators only look at where the price is. This dashboard tells you how much effort (Volume Delta) was required
FREE
Это инновационный индикатор измерения силы валют от INFINITY является незаменимым помощником для скальперов и трейдеров торгующих в долгую. Система анализа Силы/слабости валют давно известна и применяется на рынке ведущими трейдерами мира. Любая арбитражная торговля не обходится без этого анализа. Наш индикатор легко определяет силу базовых валют по отношению друг к другу. Он выводит линейные графики по всем или по текущей паре валют, позволяя проводить мгновенный анализ и поиск наиболее сильны
FREE
Important Lines
Terence Gronowski
4.88 (24)
Индикатор отображает линии пивот, уровни максимума, минимума и закрытия предыдущего дня, а также минимум и максимум предыдущего часа. Нужно просто установить этот индикатор на график, чтобы отобразить все эти важные линии, нет необходимости настраивать множество отдельных индикаторов. Почему важны определенные линии Максимум и минимум предыдущего дня : эти уровни используются для торговли на дневном графике. Очень часто, если цена становится выше или ниже минимума/максимума предыдущего дня, про
FREE
Girassol Sunflower MT5 Indicator
Saullo De Oliveira Pacheco
3.86 (7)
This is the famous Sunflower indicator for Metatrader5. This indicator marks possible tops and bottoms on price charts. The indicator identifies tops and bottoms in the asset's price history, keep in mind that the current sunflower of the last candle repaints, as it is not possible to identify a top until the market reverses and it is also not possible to identify a bottom without the market stop falling and start rising. If you are looking for a professional programmer for Metatrader5, please
FREE
Value Chart Candlesticks
Flavio Javier Jarabeck
4.69 (13)
The idea of a Value Chart indicator was presented in the very good book I read back in 2020 , " Dynamic Trading Indicators: Winning with Value Charts and Price Action Profile ", from the authors Mark Helweg and David Stendahl. The idea is simple and the result is pure genius: Present candlestick Price analysis in a detrended way! HOW TO READ THIS INDICATOR Look for Overbought and Oversold levels. Of course, you will need to test the settings a lot to find the "correct" one for your approach. It
FREE
VolumeBasedColorsBars — Free Powerful Volume Analysis for All Traders Unlock the hidden story behind every price bar! VolumeBasedColorsBars is a professional-grade, 100% FREE indicator that colorizes your chart candles based on real, adaptive volume analysis. Instantly spot surges in market activity, identify exhaustion, and catch the moves that matter. This indicator gives you:    • Dynamic color-coded bars for instant volume context    • Adaptive thresholds based on historical, session-awar
FREE
Statistical Arbitrage Spread Generator for Cointegration [MT5] What is Pair Trading? Pair trading is a market-neutral strategy that looks to exploit the relative price movement between two correlated assets — instead of betting on the direction of the market. The idea? When two assets that usually move together diverge beyond a statistically significant threshold, one is likely mispriced. You sell the expensive one, buy the cheap one , and profit when they converge again. It’s a statistica
FREE
Donchian Pro
Paulo Henrique Faquineli Garcia
4.75 (4)
The Donchian Channel Channels are among the most popular tools of technical analysis, as they visually convey to the analyst the limits within which most price movement tends to occur. Channel users know that valuable information can be obtained at any time, whether prices are in the central region of a band or close to one of the border lines. One of the best known techniques to explore these concepts is Bollinger Bands. However, John Bollinger was not the only one to research the application
FREE
Индикатор основан на методике Роберта Майнера, описанной в его книге "Торговые стратегии с высокой вероятностью успеха" и отображает сигналы по моментуму двух таймфреймов. В качестве индикатора моментума используется Стохастический осциллятор.  Настройки говорят сами за себя period_1 - текущий таймфрейма, указывается 'current' period_2 - старший таймфрейм - в 4 или 5 раз больше текущего. Например если текущий 5-мин, то старший будет 20-мин остальные настройки - это настройки Стохастического осци
FREE
Ratio Indicator
Rafael Gazzinelli
5 (2)
Ratio Indicator - User Guide Special Deal! Leave a review and get the indicator  Long & Short Cointegration Analyzer for free — just send me a message! This Ratio indicator between assets allows you to monitor and trade the price relationship between two assets selected by the user. It calculates the ratio between the prices of two assets, referred to as Asset1 and Asset2 (e.g., "GBPUSD" and "EURUSD"), and plots a moving average of the ratio along with Bollinger Bands . These bands are used to
FREE
All-in-One Chart Patterns Professional Level: The Ultimate 36-Pattern Trading System All-in-One Chart Patterns Professional Level is a comprehensive 36-pattern indicator well known by retail traders, but significantly enhanced with superior accuracy through integrated news impact analysis and proper market profile positioning. This professional-grade trading tool transforms traditional pattern recognition by combining advanced algorithmic detection with real-time market intelligence.  CORE FEATU
FREE
This is a FREE Trend Direction Indicator for MetaTrader 5. Features: Identifies market trend direction Uses EMA 50 and EMA 200 Non-repainting logic Clear visual display Suitable for manual trading Free version includes: - Single timeframe - Trend direction only - No alerts If you need: Alerts Multi-timeframe version EA automation Custom modifications My Name is Khalaf Hamza , You can contact me for freelance work --> khalaf.hamza.hi@gmail.com
FREE
Long&Short Cointegration Analyzer An advanced tool for traders looking to profit from cointegration. Analyzes any asset pair for Long&Short strategies. What does the Long&Short Cointegration Analyzer do? Identifies cointegrated pairs that revert to the mean, ideal for profitable trades. Provides a detailed panel with statistical data for confident decisions. Works with any currency pair, on any timeframe. Find buying and selling opportunities based on cointegration. Minimize risks with a relia
Tabajara V5
Flavio Javier Jarabeck
4.83 (36)
Metatrader 5 version of the famous Andre Machado's Tabajara indicator. If you don't know Andre Machado's Technical Analysis work you don't need this indicator... For those who need it and for those several friend traders who asked this porting from other platforms, here it is... FEATURES 8-period Moving Average 20-period Moving Average 50-period Moving Average 200-period Moving Average Colored candles according to the inflexion of the 20-period MA SETTINGS You can change the Period of all MA's
FREE
Индикатор подчёркивает те моменты, которые профессиональный трейдер видит в обычных индикаторах. VisualVol визуально отображает разные показатели волатильности в единой шкале и общем масштабе. Подчёркивает цветом превышение показателей объёма. Одновременно могут быть отображены Тиковый и Реальный Объем, Действительный диапазон, ATR, размер свечи и ретурнс (разница open-close). Благодаря VisualVol вы увидите рыночные периоды и подходящее время для разных торговых операций. Эта версия предназначен
FREE
Daily High Low Danilo Monteiro
Danilo Hudson Couto Monteiro
4 (1)
# Indicador Daily High - Danilo Monteiro - MT5 ## Descrição O Daily High/Low Labels é um indicador personalizado para MetaTrader 5 que exibe automaticamente as máximas e mínimas diárias no gráfico, facilitando a identificação rápida dos níveis importantes de preço. O indicador marca os preços com etiquetas e linhas horizontais, permitindo uma visualização clara dos níveis críticos do dia atual e anterior. ## Principais Características ### 1. Marcação Automática - Exibe automaticamente as máxi
FREE
Simple VWAP
Abraao Moreira
4 (1)
Fundamentação teórica A VWAP é uma média móvel ajustada pelo volume, ou seja o peso de cada preço corresponde ao volume de ações negociadas no período, dando mais importância ao período em que se tenha mais negociações. [1] VWAP = sum(price[i]*volume[i]) / sum(volume[i]) Metodologia É possível configurar o período que será utilizado para o calculo da VWAP, a cor, a espessura e o estilo da linha. A linha é desenhada desde a o começo da série disponível apenas uma vez para economizar recursos com
FREE
С этим продуктом покупают
SuperScalp Pro
Van Minh Nguyen
4.55 (20)
SuperScalp Pro – Продвинутая система скальпингового индикатора с множеством фильтров SuperScalp Pro — это продвинутая система скальпингового индикатора, объединяющая классический Supertrend и множество интеллектуальных подтверждающих фильтров. Индикатор эффективно работает на всех таймфреймах от M1 до H4 и особенно подходит для XAUUSD, BTCUSD и основных валютных пар. Может использоваться как самостоятельная система или гибко интегрироваться в существующие торговые стратегии. Индикатор включает б
Azimuth Pro
Ottaviano De Cicco
5 (6)
Azimuth Pro V2: Синтетический фрактальный структурный анализ и подтверждённые входы для MT5 Обзор Azimuth Pro — многоуровневый индикатор свинговой структуры от Merkava Labs . Четыре вложенных уровня свингов, привязанный к свингам VWAP, определение ABC-паттернов, трёхтаймфреймная структурная фильтрация и подтверждённые входы на закрытой свече — один график, один рабочий процесс от микро-свингов до макро-циклов. Это не слепой сигнальный продукт. Это рабочий процесс, основанный на структуре, для т
Entry In The Zone and SMC Multi Timeframe is a real-time 2-in-1 market analysis tool that combines market structure analysis and a No Repaint BUY / SELL signal system into a single indicator, built on Smart Money Concepts (SMC) — a widely adopted framework used by professional traders to understand market structure. This indicator helps you see the market more clearly, make decisions based on structure rather than guesswork, and focus on high-probability zones where price is more likely to react
Power Candles – Входные сигналы на основе силы для любого рынка Power Candles переносит проверенный анализ силы Stein Investments прямо на ценовой график. Вместо реакции только на цену каждая свеча окрашивается на основе реальной рыночной силы, позволяя мгновенно распознавать накопление импульса, ускорение силы и четкие смены тренда. Одна логика для всех рынков Power Candles автоматически работает со всеми торговыми инструментами . Индикатор определяет, является ли текущий символ валютной парой
Каждый покупатель этого индикатора получает дополнительно Бесплатно: Авторскую утилиту "Bomber Utility", которая автоматически сопровождает каждю торговую операцию, устанавливает уровни Стоп Лосс и Тейк профит и закрывает сделки согласно правилам этой стратегии, Сет-файлы для настройки этого индикатора на различных активах, Сет-файлы для настройки Bomber Utility в режимы: "Минимум Риска", "Взвешенный Риск" и "Стратегия Выжидания", Пошаговый видео-мануал, который поможет вам быстро установить, на
FX Trend NG: Следующее поколение интеллектуального анализа трендов на разных рынках Обзор FX Trend NG — это профессиональный инструмент анализа трендов и мониторинга рынка с поддержкой нескольких таймфреймов. Он позволяет за секунды получить полное структурное понимание текущего состояния рынка. Вместо переключения между десятками графиков вы мгновенно видите, какие инструменты находятся в тренде, где импульс ослабевает и где наблюдается сильная синхронизация между таймфреймами. Специальное пр
Quantum TrendPulse
Bogdan Ion Puscasu
5 (23)
Представляем   Quantum TrendPulse   , совершенный торговый инструмент, который объединяет мощь   SuperTrend   ,   RSI   и   Stochastic   в один комплексный индикатор, чтобы максимизировать ваш торговый потенциал. Разработанный для трейдеров, которые ищут точность и эффективность, этот индикатор помогает вам уверенно определять рыночные тренды, сдвиги импульса и оптимальные точки входа и выхода. Основные характеристики: Интеграция SuperTrend:   легко следуйте преобладающим рыночным тенденциям и п
Если вы покупаете этот индикатор, вы получите мой профессиональный Trade Manager + EA БЕСПЛАТНО. Прежде всего стоит подчеркнуть, что эта торговая система является индикатором без перерисовки, без повторной отрисовки и без задержки, что делает ее идеальной как для ручной, так и для роботизированной торговли. Онлайн курс, руководство и загрузка пресетов. «Smart Trend Trading System MT5» - это комплексное торговое решение, созданное для новичков и опытных трейдеров. Он объединяет более 10 премиаль
Meridian Pro
Ottaviano De Cicco
5 (1)
Meridian Pro: Профессиональная мульти-таймфрейм матрица трендов для MT5 Обзор Meridian Pro — это мульти-таймфрейм матрица трендов от Merkava Labs , которая сжимает направление, силу, состояние импульса и согласованность матрицы в одну компактную панель. Один адаптивный движок, последовательно применяемый от M1 до W1. Без настройки под отдельные символы. Без нагромождения индикаторов. Одна структурированная оценка по всем активам и всем таймфреймам. Акция запуска — получите Meridian Pro за USD 99
Раскройте силу торговли трендами с помощью индикатора Trend Screener: вашего идеального решения для торговли трендами, основанного на нечеткой логике и мультивалютной системе! Повысьте уровень своей торговли по тренду с помощью Trend Screener, революционного индикатора тренда, основанного на нечеткой логике. Это мощный индикатор отслеживания тренда, который сочетает в себе более 13 инструментов и функций премиум-класса и 3 торговые стратегии, что делает его универсальным выбором для превращения
Представляем       Quantum Breakout PRO   , новаторский индикатор MQL5, который меняет ваш способ торговли в зонах прорыва! Разработан командой опытных трейдеров со стажем торговли более 13 лет,       Квантовый прорыв PRO       разработан, чтобы поднять ваше торговое путешествие к новым высотам с его инновационной и динамичной стратегией зоны прорыва. Quantum Breakout Indicator покажет вам сигнальные стрелки на зонах прорыва с 5 целевыми зонами прибыли и предложением стоп-лосса на основе поля
Gann Made Easy   - это профессиональная, но при этом очень простая в применении Форекс система, основанная на лучших принципах торговли по методам господина У.Д. Ганна. Индикатор дает точные BUY/SELL сигналы, включающие в себя уровни Stop Loss и Take Profit. ПОЖАЛУЙСТА, СВЯЖИТЕСЬ СО МНОЙ ПОСЛЕ ПОКУПКИ, ЧТОБЫ ПОЛУЧИТЬ ТОРГОВЫЕ ИНСТРУКЦИИ И ОТЛИЧНЫЕ ДОПОЛНИТЕЛЬНЫЕ ИНДИКАТОРЫ БЕСПЛАТНО! Вероятно вы уже не раз слышали о торговли по методам Ганна. Как правило теория Ганна отпугивает от себя не только
Представляю Вам отличный технический индикатор GRABBER, который работает, как готовая торговая стратегия "Все включено"! В одном программном коде интегрированы мощные инструменты для технического анализа рынка, торговые сигналы (стрелки), функции алертов и Push уведомлений.  Каждый покупатель этого индикатора получает дополнительно БЕСПЛАТНО:  Grabber Утилиту для автоматического управления открытыми ордерами, Пошаговый видео-мануал : как установить, настроить и торговать, Авторские сет-файлы дл
OmniSync Projection
Antonio-alin Teculescu
5 (1)
Chronos Fractal Engine is an innovative price projection indicator for MetaTrader 5, designed to transform your technical analysis by intelligently identifying and projecting historical price patterns. Built upon an advanced correlation algorithm and the fractal principles of the market, this powerful tool visualizes potential future price movements, giving you a unique edge in your trading decisions. What is Chronos Fractal Engine? At its core, the Chronos Fractal Engine employs a sophisticat
Crystal Heikin Ashi Signals - Professional Trend & Signal Detection Indicator Advanced Heikin Ashi Visualization with Intelligent Signal System for Manual & Automated Trading Final Price: $149 ---------> Price goes up $10 after every 10 sales . Limited slots available — act fast . Overview Crystal Heikin Ashi Signals is a professional-grade MetaTrader 5 indicator that combines pure Heikin Ashi candle visualization with an advanced momentum-shift detection system. Designed for both manual traders
Smart Stop Indicator – Интеллектуальная точность стоп лоссов прямо на графике Обзор Smart Stop Indicator это специализированное решение для трейдеров, которые хотят устанавливать стоп лоссы чётко и методично, а не на интуитивной основе. Индикатор объединяет классическую логику прайс экшн (higher highs, lower lows) с современной системой распознавания пробоев, чтобы определить действительно логичный уровень стопа. В трендах, диапазонах или фазах резких движений он показывает оптимальные зоны SL
ARICoin is a powerful trading companion designed to generate high-probability entry signals with dynamic TP/SL/DP levels based on volatility. Built-in performance tracking shows win/loss stats, PP1/PP2 hits, and success rates all updated live. Key Features: Buy/Sell signals with adaptive volatility bands Real-time TP/SL/DP levels based on ATR Built-in MA Filter with optional ATR/StdDev volatility Performance stats panel (Success, Profit/Loss, PP1/PP2) Alerts via popup, sound, push, or email Cust
Узнайте, какая стратегия действительно работает на вашем инструменте - прежде чем рисковать реальными деньгами. Power Bar обнаруживает экстремальные ценовые бары на любом инструменте и любом таймфрейме, затем мгновенно тестирует 3 различные торговые стратегии, чтобы вы могли сравнить процент выигрышей, профит-факторы и прибыль/убыток. Все в одной интерактивной панели. Никаких догадок. Никакой подгонки. Только данные. Что делает Power Bar уникальным? Большинство индикаторов дают сигнал и оставля
Btmm state engine pro
Garry James Goodchild
5 (4)
BTMM State Engine Pro is a MetaTrader 5 indicator for traders who use the Beat The Market Maker approach: Asian session context, kill zone timing, level progression, peak formation detection, and a multi-pair scanner from a single chart. It combines cycle state logic with a built-in scanner dashboard so you do not need the same tool on many charts at once. What it does Draws the Asian session range; session times can follow broker server offset or be set in inputs. Tracks level progression (L
FX Power: Анализируйте силу валют для более эффективной торговли Обзор FX Power — это ваш незаменимый инструмент для понимания реальной силы валют и золота в любых рыночных условиях. Определяя сильные валюты для покупки и слабые для продажи, FX Power упрощает принятие торговых решений и выявляет высоковероятные возможности. Независимо от того, хотите ли вы следовать за трендами или предсказывать развороты с использованием экстремальных значений дельты, этот инструмент идеально адаптируется под
Прежде всего стоит подчеркнуть, что этот Торговый Инструмент является Неперерисовывающимся Нерепейнтинговым Индикатором, что делает его идеальным для профессиональной торговли. Онлайн-курс, руководство пользователя и демонстрация. Индикатор Концепций Умного Действия Цены - очень мощный инструмент как для новичков, так и для опытных трейдеров. Он объединяет более 20 полезных индикаторов в одном, комбинируя передовые торговые идеи, такие как анализ Inner Circle Trader и стратегии торговли концеп
CGE Trading Suite
Carl Gustav Johan Ekstrom
5 (1)
Institutional-Grade Analytics for MT5 CGE Trading Suite delivers the analytical edge typically reserved for professional trading desks. The platform integrates a full suite of analytical tools into one seamless workflow: dynamic grid mapping, liquidity behavior analysis, ECM, trend lines, MIDAS, trade cycles, and directional channel projections. Together, these provide a unified view of market structure and momentum. Directional clarity is further enhanced by the capital flow index, which measu
Market Structure Order Block Dashboard MT5 — это индикатор MT5, предназначенный для трейдеров, которые хотят анализировать рыночную структуру и основные зоны реакции цены прямо на графике. Он объединяет BOS, ChoCH, Order Blocks, Fair Value Gaps (FVG), Liquidity, Kill Zones, Volume Profile и компактную dashboard-панель для быстрого анализа. Этот индикатор предназначен для трейдеров, которые используют рыночную структуру, концепции ICT и Smart Money как основу для принятия решений. Он помогает опр
Прежде всего стоит подчеркнуть, что этот торговый индикатор не перерисовывается, не перерисовывает и не отставает, что делает его идеальным как для ручной, так и для роботизированной торговли. Руководство пользователя: настройки, вводы и стратегия. Атомный аналитик - это индикатор ценового действия PA, который использует силу и импульс цены, чтобы найти лучший край на рынке. Оборудованный расширенными фильтрами, которые помогают убирать шумы и ложные сигналы, и повышают торговый потенциал. Испо
Auto Optimized Parabolic RSI: Передовой 3D-движок импульса Большинство розничных индикаторов терпят неудачу, потому что они полагаются на статические входные параметры, которые ломаются, как только меняется волатильность рынка. Auto Optimized Parabolic RSI решает проблему «устаревания индикатора» путем непрерывного пересчета собственного математического преимущества, привнося количественную адаптацию институционального уровня прямо в ваш терминал MT5. Главное преимущество: Пользовательская 3D-оп
RelicusRoad Pro: Квантовая Рыночная Операционная Система СКИДКА 70% ПОЖИЗНЕННЫЙ ДОСТУП (ОГРАНИЧЕНО) - ПРИСОЕДИНЯЙТЕСЬ К 2000+ ТРЕЙДЕРАМ Почему большинство трейдеров теряют деньги даже с «идеальными» индикаторами? Потому что они торгуют Единичными Концепциями в вакууме. Сигнал без контекста — это лотерея. Чтобы выигрывать стабильно, вам нужна КОНФЛЮЭНЦИЯ . RelicusRoad Pro — это не простой стрелочный индикатор. Это полная Количественная Рыночная Экосистема . Она отображает «Дорогу Справедливой Сто
Berma Bands
Muhammad Elbermawi
5 (8)
Индикатор Berma Bands (BBs) является ценным инструментом для трейдеров, стремящихся определить и извлечь выгоду из рыночных тенденций. Анализируя взаимосвязь между ценой и BBs, трейдеры могут определить, находится ли рынок в фазе тренда или диапазона. Посетите [ Блог Berma Home ], чтобы узнать больше. Berma Bands состоят из трех отдельных линий: Upper Berma Band, Middle Berma Band и Lower Berma Band. Эти линии наносятся вокруг цены, создавая визуальное представление движения цены относительно об
ARIBot is a powerful trading companion designed to generate high-probability entry signals with dynamic TP/SL/DP levels based on volatility. Built-in performance tracking shows win/loss stats, PP1/PP2 hits, and success rates — all updated live. Key Features: Buy/Sell signals with adaptive volatility bands Real-time TP/SL/DP levels based on ATR Built-in MA Filter with optional ATR/StdDev volatility Performance stats panel (Success, Profit/Loss, PP1/PP2) Alerts via popup, sound, push, or email Cus
ICT PO3 (Power of 3) AMD Protocol Framework Indicator True Time & Structure Integration   |  Non-Repainting | Real-Time  | Multi-Asset  | MT4 Version Available Full Setup Guide & Strategy Playbook: https://www.mql5.com/en/blogs/post/768683 MT4 Version: https://www.mql5.com/en/market/product/171742 Indicator Overview The ICT PO3 AMD Protocol Framework is a complete structural overlay for MetaTrader 5 that maps the True Daily Cycle directly onto your lower-timeframe execution chart. It projects
[ My Products ] , [ My Channel ]   ,  [ LIVE SIGNAL ] HFT Spike Detector HFT Spike Detector — это профессиональный инструмент мониторинга тиков, разработанный для анализа и измерения высокочастотных ценовых движений (вызванных HFT резкими скачками) в режиме реального времени. Цель — позволить вам выявлять аномальные значения проскальзывания, разрывы ликвидности и миллисекундные ценовые скачки, вызванные брокером, с помощью числовых данных. Поскольку инструмент анализирует поток тиков в реаль
Другие продукты этого автора
The White's Candle Color indicator (by volume) will color the candles based on the current candle's volume compared to the moving average of the volume. This will allow you to see clearly if the volume (real or tick) is within the normal range, whether it is high or low and bring very important information about the market. I hope that this indicator can help in your operational. Success and good trades!
White Weis Volume Ticks
Ricardo Almeida Branco
5 (4)
White Weis Volume This indicator shows the sum of the volume in each wave, bulish or bearish, as idealized by David Weis , but it brings an important addition , which is the marking of the bar with the highest volume of the wave (White Bar)! In coding the indicator, it was sought to optimize the code to require minimal processing during use and not to overload mt5. The indicator can be used for pre-trading analysis and study, where the trader analyzes possible points of support and resistance
Display N Bars
Ricardo Almeida Branco
4.88 (8)
The Display N Bars utility is a simple tool designed to help identify candles. If a trader tries to share knowledge with a colleague but it is difficult to pinpoint exactly the desired candle, just say the corresponding candle number. The candle count is reset every day. Seeking to offer a good customization the inputs are: Display type -> Display only odd, only odd, or both candles? Direction -> Horizontal or Vertical? Display multiples of: (display frequency) -> Display all number
FREE
Volume Doji
Ricardo Almeida Branco
Hey guys. This indicator will show you, in the volume histogram, if the candle was a Doji, a bullish candle, or a bearish candle. The construction of this indicator was requested by a trader who uses other indicators from my catalog, and I decided to release it free to help traders who think that the indicator can contribute to their operations. The parameters are: Volume Type: Real Volume or Tick Volume. Color if the candle is bearish: select the color. Color if the candle is high: select
FREE
White Trader Clock
Ricardo Almeida Branco
5 (1)
Simple countdown indicator for the next candle. Only claim is to be light! The indicator inserts a text object to the right of the current price and calculates how much time is left for the new bar, showing this to the trader. Leave your comment if the indicator helped you in any way! If you have any suggestions, let me know to evaluate the improvements. Success and Good Trades!
FREE
Automatic Vwap Midas
Ricardo Almeida Branco
5 (1)
The 3 Automatic Vwap (Midas) Indicator can be used for Price and Volume studyers to map the movement of market drivers. It automatically plots 3 Vwaps, two of which are dynamic and will be updated throughout the day if new highs or new lows emerge. The third Vwap is daily and can help if the trend is up or down. Also, an auxiliary indicator that plots (also dynamic) points of interest with OHLC prices (Open, High and Low of the current day and Close of the previous day) was inserted. Success and
Start Vwap Custom Midas
Ricardo Almeida Branco
5 (3)
Attention: New update - 4 major practicality improvements! 1) Alarm 2) Midas text value 3) Click panel 4) Can be connected to an EA to operate in semi-automatic mode Attention - This indicator does not work perfectly in backtest due to MT5 peculiarities (Reading hotkeys or panel clicks) . My suggestion is that you test Automatic Vwap Midas which has automatic operation to analyze the calculation and then buy Start if you think the indicator will match your operating.     This indicator is use
O HL2 C Lines
Ricardo Almeida Branco
5 (2)
If you consider the extremes of the daily price as important points, this indicator will help in your trades. Now, instead of manually drawing lines that mark daily highs and lows, you can use the O (HL) ² C Lines indicator. Thus, the OHLC Lines indicator automatically plots the lines O (Open for the current day), H (High for the current day), L (Low for the current day) and C (Close for the previous day). Plot also the high and low of the previous day. Thus, we have 4 static lines and tw
PVA Dragon
Ricardo Almeida Branco
Users of PVRSA / PVA certainly already know the Dragon indicator and its use. The Dragon works as dynamic support and resistance and can be used for scalper or trend follower. In addition to the Dragon we have the WGT (fast) and EMA (slow) averages that can show immediate movement and also trend movement. Stay tuned for the Dragon's inclination! The indicator can be used on any asset/currency pair and can be customized according to the trader's interest. See also my volume analysis indicato
Several techniques use volume as an important point in the trade. Whether to indicate strength, exhaustion, pullback weakness, among others. In chief I quote Richard Wyckoff's theory, which said about the importance of looking price and volume. However, there are several possibilities to filter what is volume that should be noticed. PVRSA/PVA users use an indicator with specific colors, which assist in identifying the volume and type of movement that the price has made. Will the high volume
Do you use volume in your reading of the market? Certainly many traders use it, and do not imagine operating without it. The Color Histogram Volume Set indicator allows the user to choose the value that he considers interesting to monitor. When you pass this you will have visual confirmation and if you want you will also have the audible alert that is given by the indicator. Of course, there are other ways to try to find a high volume, such as assessing whether the volume is above av
Do you use volume in your reading of the market? Certainly many traders use it, and do not imagine operating without it. The Color Candle Volume Set indicator allows the user to choose the value that he considers interesting to monitor. When you pass this you will have visual confirmation on the price chart and if you want you will also have the audible alert that is given by the indicator. Of course, there are other ways to try to find a high volume, such as assessing whether the vol
WT Vwap Bands
Ricardo Almeida Branco
The WT Vwap Bands indicator is an indicator that combines price and volume, helping to show whether the price is within the "fair price", overbought or oversold. The indicator code was designed for performance and has already been tested in a real trading account. In addition to the visual inputs (color, thickness and line style), the user can define a% value that depends on the price. The default values work with the most distant band at 1% of the price and then dividing this distance in
Fibo Z
Ricardo Almeida Branco
5 (1)
With it, you leave pre-configured two expansion settings and one fibo retraction configuration to use via keyboard shortcut and mouse click. That is, the Fibo_Z utility facilitates the use of MT5's native functions. The shortcut keys are: "Z" configuration 1 of the expansion. "X" expansion setting 2 "Z" retraction configuration. "V" clears objects from the screen. It is. Success and good trades!
Vwap Freeze
Ricardo Almeida Branco
5 (1)
The previous day's vwap is used by some traders as a support and resistance point, after all it is one of the ways to consider the fair price of that asset or that pair the day before. Possible defenses can occur in this region indicating a reversal, or triggering stops starting a new, more directional movement. It is a matter of analyzing how it will add to your operational. To avoid manually drawing the previous day's vwaps and saving time for your analysis, use the Vwap Freeze indicator, as
Start Display N Bars
Ricardo Almeida Branco
5 (1)
Do you already know Display N Bars? Do you already know the Start tool (from Midas indicators)? In this indicator, we unified the two tools, allowing you to define which candle will start counting, or use the automatic numbering that was already available in the previous version. Description of the utility follows: Display N Bars The Display N Bars utility is a simple tool that aims to help identify candles. If a trader tries to share the knowledge with a colleague but it is difficult t
WT Vwap 5 Bands The WT Vwap Bands indicator is an indicator that combines price and volume, helping to show whether the price is within the "fair price", overbought or oversold. The indicator code was designed for performance and has already been tested in a real trading account. In addition to the visual inputs (color, thickness and line style), the user can define a% value that depends on the price. The default values work with the most distant band at 1% of the price and then dividing
Haos MT5
Ricardo Almeida Branco
5 (1)
The Haos oscillator coded for the MT5! This oscillator allows to verify overbought / oversold regions in two periods (14 and 96, for example), making it possible to anticipate a reversal. Possibility to activate an audible alert when it reaches a defined level. Possibility to choose the alert sound by placing a .wav song in each asset or timeframe. (save a .wav file to the MQL5 \ Files folder) Possibility to activate / deactivate histogram and levels to make the screen cleaner. Customizable col
The Initial Balance (Initial Balance / Initial Balance) is a concept related to the study of volume (to learn more, study about Market Profile and Auction Market Theory. You can find some videos in English when searching for "Initial Balance Market Profile"). The IB defines a range in which prices were negotiated in the first hour of trading.The amplitude of the range is important and the break in the range defined by the Initial Balance may have occurred due to the movement of several players
VTC Volatility
Ricardo Almeida Branco
The VTC Volatility indicator was written to support a Brazilian stock market strategy in the WDO (USDBRL), but it can be adapted to other strategies and markets. In the new indicator update, it is now allowed to choose up to 4 levels to determine the range, and thus be more versatile. The Brazilian stock exchange (B3) has the VTC which is a "Structured Exchange Rate Volatility Transaction" (more information on the B3 website). At around 10:00 am, the VTC "Call" comes out and Brazilian broker
O indicador Vwap Deviation Bands segue na mesma linha dos outros indicadores da White Trader, que buscam leveza, personalização e qualidade, para entregar o que há de melhor para o trader. Isto, além de combinar preço e volume (informações importantes para o trader) com uma medida estatística do desvio padrão. Este indicador já foi utilizado e testado por outros traders que deram sugestões, inclusive, para chegarmos nesta versão final (embora ainda esteja aceitando sugestões, sempre :)   ). O de
Midas is the acronym for Market Interpretation / Data Analysis System is a trade approach started in 1995 by technical analyst Paul Levine and later developed by Andrew Coles, PhD and David Hawkins. Learn more in the book MIDAS Technical Analysis: A VWAP Approach to Trading and Investing in Today's Markets , (I saw that it is possible buy via Amazon). The positive points in relation to the Midas-based indicators are the prediction of movement reversal points, the negative point is the subjectivi
The Vwap Bands Auto indicator seeks to automatically map the maximum market frequency ( automatic update of the outermost band ) and has two intermediate bands that also adjust to daily volatility. Another tool from White Trader that combines price and volume, in addition to mapping the daily amplitude. The external band is updated automatically when the daily maximum or minimum breaks the current frequency, and can be an input signal, seeking a return to the daily vwap. Thus, in addition t
Start Midas SD Channel
Ricardo Almeida Branco
5 (1)
Do you already know the Start Midas indicator? What about the Vwap Standard Deviation indicator? And I need to speak again in the book MIDAS Technical Analysis ... The Start Midas SD Channel indicator combines the two in one, bringing the practicality and efficiency of Midas with the statistical calculation of the standard deviation. All of this with the practicality of the White Trader Start indicators, where you can plot the indicator and move them on the screen using keyboard shortcuts
Here we have the Start Midas Fibo Bands , I confess that it is an indicator that excited me enough to operate because I was able to find more defined rules. Well, the indicator has the functions of the other indicators of the Start line , which is a possibility to plot several Midas on the screen, you can move the anchor point using keyboard shortcuts and use the legend to differentiate one anchor from another. The rules that I have analyzed for my possible setup are recommended to the entry, st
Prior Lines
Ricardo Almeida Branco
This indicator shows on the current day some lines of interest, such as maximum, minimum and closing of the previous day, as well as the opening, maximum and minimum price of the current day. It can also show the GAP (closing of the previous day and opening of the current day) and projections of the amplitude of the previous day, according to the value you choose in the multiplier. Oh, I was going to forget. It is also possible to determine the time frame, which is daily by default. If this i
Auto Zig HTF Vwap Midas
Ricardo Almeida Branco
5 (1)
The best Vwap Midas coding for Metatrader 5 you can find in White Trader indicators. The indicator has been optimized not to recalculate (improving performance) and has several visual settings for you to adapt in your own way. TRY IT FOR FREE by clicking the free demo button Where and why to use Vwap Midas (and Auto Zig Vwap Midas) can be used on a variety of indices, currencies, forex, cryptocurrencies, stocks, indices and commodities. Many successful traders use price and volume to get the
The Danko Trend Color indicator is actually a candle coloring to bring practicality, ease and information to your charts. Danko Trend Color combines PRICE AND VOLUME indicators to define the prevailing trend, so the colors are: Blue (indicates an uptrend) Orange (indicates a downtrend) White (indicates undefined trend) I don't like to promise anything with my indicators, I ask you to download, test it for free (for use in backtesting) and see if the indicator can, in some way, help your oper
Danko DTC Panel
Ricardo Almeida Branco
Do not buy before seeing the Danko Trend Color product, as this panel is a way to view a summary of this indicator on various timeframes. The Danko DTC Panel utility allows you to look at the trend in up to 5 timeframes. When clicking on the timeframe texts, a new window will open with the indicator plotted on the screen so you can see the complete chart. The width of the panel, with the amount of candles you want to see, is customizable, see the images below. Ao clicar nos textos dos timeframe
Фильтр:
Нет отзывов
Ответ на отзыв