Color HLC Bars and Candles
- Indicatori
-
Ricardo Almeida Branco
 I started following the Brazilian stock exchange in 2018, in a demo account, and I found the amount of setups used interesting. Taking learning and even the demo seriously, I understood that I should start programming to validate / discard setups.
 - Versione: 1.0
- Attivazioni: 5
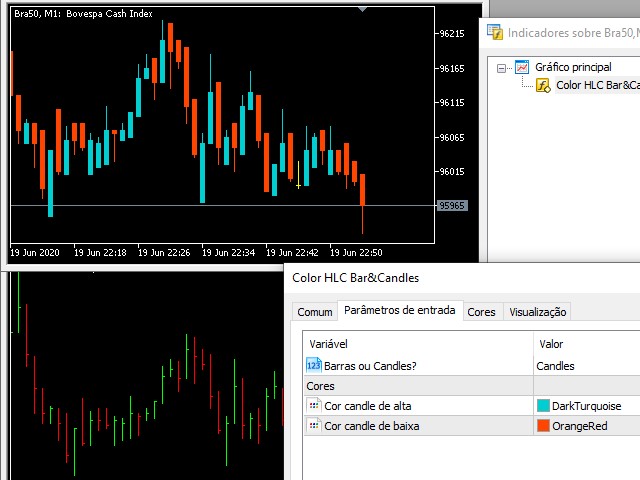
Want to make the graph cleaner?
Don't you use the opening price in your analysis?
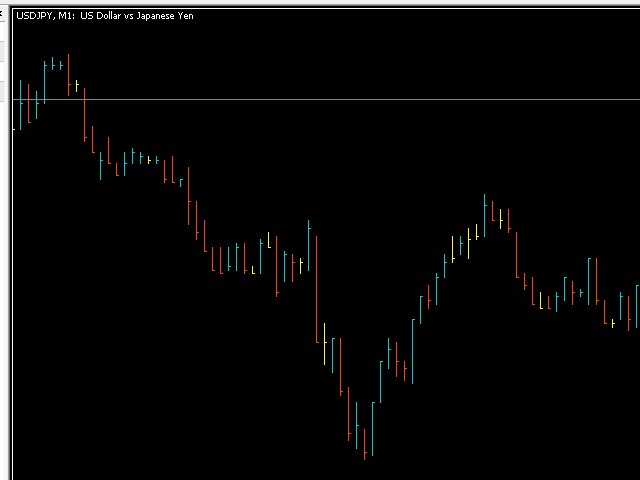
Want to use a chart model that was used by Richard Wyckoff?
Then you need to know the Color HLC Candles and Bars indicator. In the same indicator you can switch to the display of candles or bars.
Take a look at the other volume indicators to complement your operating.And don't forget to look at the best Vwap Custom (Midas)!
Leave your comment!
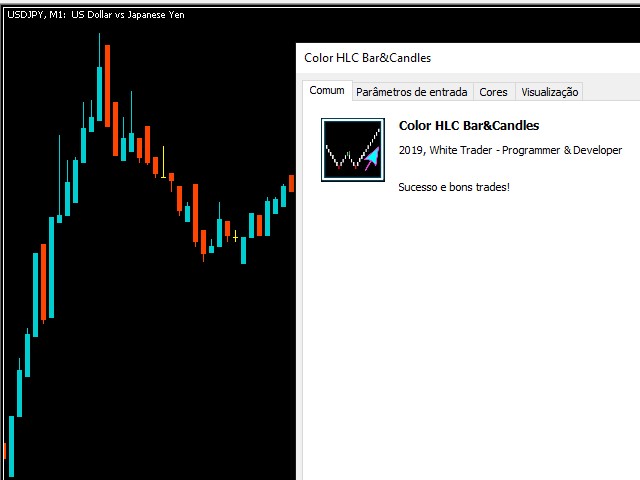
Success and good trades!
Don't you use the opening price in your analysis?
Want to use a chart model that was used by Richard Wyckoff?
Then you need to know the Color HLC Candles and Bars indicator. In the same indicator you can switch to the display of candles or bars.
Take a look at the other volume indicators to complement your operating.And don't forget to look at the best Vwap Custom (Midas)!
Leave your comment!
Success and good trades!