WT Vwap Bands
- Индикаторы
-
Ricardo Almeida Branco
 Я начал следить за бразильской фондовой биржей в 2018 году на демо-счете и нашел интересным количество используемых настроек. Серьезно относясь к обучению и даже к демонстрации, я понял, что мне следует начать программировать, чтобы проверять / отбрасывать настройки.
 - Версия: 1.0
- Активации: 5
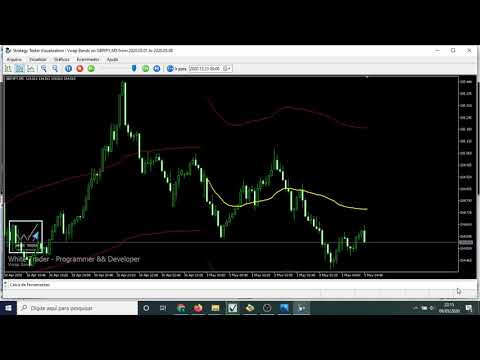
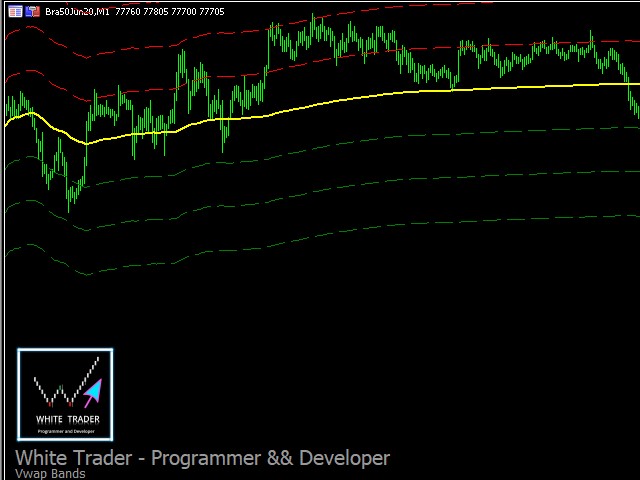
The WT Vwap Bands indicator is an indicator that
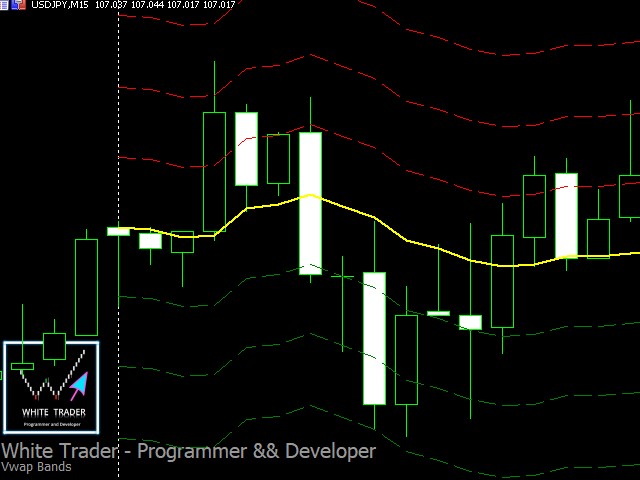
combines price and volume, helping to show whether the price is within the "fair price", overbought or oversold.
The indicator code was designed for performance and has already been tested in a real trading account.
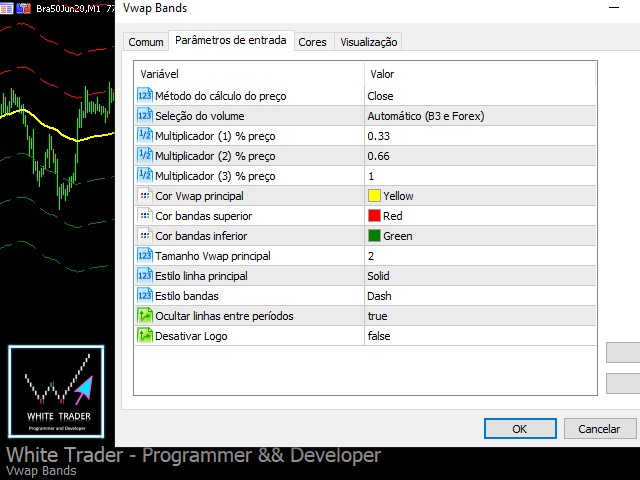
In addition to the visual inputs (color, thickness and line style), the user can define a% value that depends on the price.
The default values work with the most distant band at 1% of the price and then dividing this distance in 3, that is, 0.33% and 0.66% of the price.
These values may need to be changed depending on the asset or pair you are going to trade.
This indicator can be used in the strategy tester (works in demo) and can also be used in an Expert Advisor (robot) to give input and output signals.
It is!
Success and good trades!
The indicator code was designed for performance and has already been tested in a real trading account.
In addition to the visual inputs (color, thickness and line style), the user can define a% value that depends on the price.
The default values work with the most distant band at 1% of the price and then dividing this distance in 3, that is, 0.33% and 0.66% of the price.
These values may need to be changed depending on the asset or pair you are going to trade.
This indicator can be used in the strategy tester (works in demo) and can also be used in an Expert Advisor (robot) to give input and output signals.
It is!
Success and good trades!