O HL2 C Lines
- Индикаторы
-
Ricardo Almeida Branco
 Я начал следить за бразильской фондовой биржей в 2018 году на демо-счете и нашел интересным количество используемых настроек. Серьезно относясь к обучению и даже к демонстрации, я понял, что мне следует начать программировать, чтобы проверять / отбрасывать настройки.
 - Версия: 3.0
- Обновлено: 15 октября 2020
- Активации: 5
If you consider the extremes of the daily price as
important points, this indicator will help in your trades.
Now, instead of manually drawing lines that
mark daily highs and lows, you can use the O (HL) ² C Lines indicator.
Thus, the OHLC Lines indicator
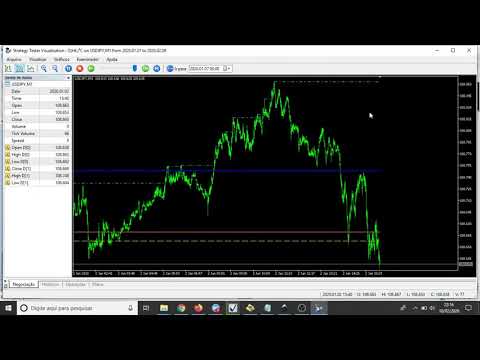
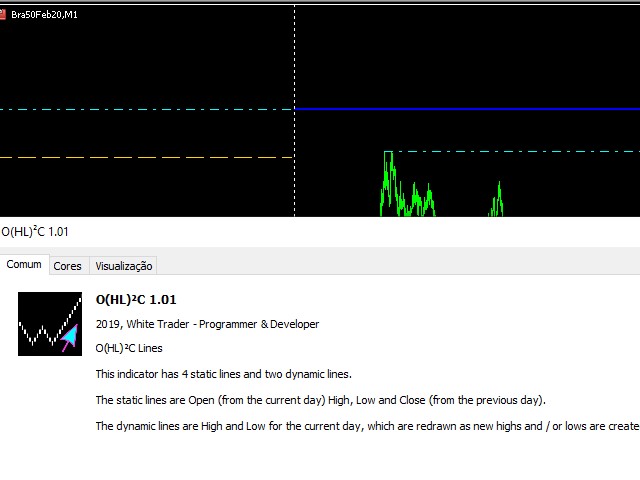
automatically plots the lines O (Open for the current day), H (High for the current day), L (Low for the current day) and C (Close for the
previous day). Plot also the high and low of the previous day.
Thus, we
have 4 static lines and two dynamic lines (high and low of the current trading session) that are redesigned as new highs and / or minimums
appear on the current day.
Success and good trades!





















































GREAT INDICATOR!!!!! EXACTLY WHAT I WAS LOOKING FOR