Bollinger Market and Trend Assessment

BOLLINGER MARKET & TREND INTELLIGENCE

MT4 Bollinger Breakout Analysis • Volatility Regimes • Trend Structure • Breakout Validation • Post-Breakout Analysis

STOP GUESSING WHICH BREAKOUTS ARE REAL.

You've been here before.

Price closes outside the upper Bollinger Band.

You see the breakout. You hesitate for a second — then enter.

Three candles later, price is back inside the band.

The breakout failed.

Now you're wondering whether you entered too early, whether you should have waited for a retest, or whether the breakout was never strong in the first place.

Then the opposite happens.

You wait for confirmation.

You wait for the retest.

And price keeps moving without you.

So you add another filter.

RSI.

Then MACD.

Then ADX.

Then another indicator to interpret the indicators.

Before long, your chart is full of signals — but you still don't have a clear answer to the question that matters:

What kind of breakout is this?

That's the problem Bollinger Market & Trend Intelligence is designed to address.

A Bollinger Band breakout is an event.

The important information is often in the context surrounding that event.

This MT4 indicator examines the volatility environment, breakout-candle structure, trend alignment, market structure, confirmation, retests, sweep-like behavior, and what happens after the breakout.

You see the analysis in one integrated dashboard instead of having to assemble it from multiple indicators.

THE BREAKOUT IS ONLY THE STARTING POINT

A candle closing outside a Bollinger Band tells you that price has moved beyond the channel.

It doesn't, by itself, tell you:

  • whether volatility was compressed beforehand

  • whether volatility is expanding or contracting

  • how strong the breakout candle was

  • where the candle closed within its range

  • whether the broader trend supports the move

  • whether shorter-term pressure agrees with that trend

  • whether the breakout confirmed

  • whether price subsequently retested the broken area

  • whether price returned inside the channel

  • whether the move developed sweep-like characteristics

  • or how efficiently price progressed afterward

Bollinger Market & Trend Intelligence brings these dimensions together.

Instead of treating every band violation as the same type of event, it gives you a structured way to examine what happened before, during, and after the breakout.

THE KEY ARCHITECTURAL DIFFERENCE

THE BREAKOUT CANNOT MOVE ITS OWN THRESHOLD

One of the most important design decisions in the engine is how the breakout threshold is evaluated.

For a historical breakout evaluation, the engine reads the completed Bollinger Band values from the bar immediately before the evaluated bar.

The breakout is then tested against that previously established channel level.

This creates a fixed reference point.

The evaluated candle cannot simply alter the Bollinger Band and then be judged against the modified value it helped create.

The result is a cleaner separation between:

the channel that existed before the breakout

and

the price movement being evaluated against that channel.

Signals are based on completed-bar data, with historical breakout states maintained through the engine's persistent tracking logic.

THE DASHBOARD

The dashboard is organized into six analytical areas so you can move from broad market context to the specific breakout.

1. MARKET STATE

Understand the volatility environment surrounding price.

The panel includes:

  • Volatility State

  • Bollinger Band Width

  • Width Percentile

  • Width / ATR Ratio

  • Width Velocity

  • Width Acceleration

  • Market-State Interpretation

The default width percentile compares current Bollinger width with a configurable historical lookback, allowing you to distinguish periods of relative compression from periods of expanded volatility.

2. GENERAL TREND

The broader market environment is evaluated using multiple structural components.

Depending on the available data, the panel incorporates:

  • Trend Direction

  • Trend Strength

  • Confidence

  • EMA Alignment

  • EMA Slope

  • ADX and Directional Movement

  • Higher High / Higher Low structure

  • Lower High / Lower Low structure

  • Trend Persistence

  • Market Phase

  • Environment

The result is expressed as a directional score from 0–100 together with the corresponding trend state.

This is not a standalone entry signal.

It is broader context for interpreting what the market is doing.

3. CURRENT TREND

The current trend panel looks at a shorter-term horizon than the General Trend analysis.

It helps you see whether:

  • short-term pressure agrees with the broader trend

  • momentum is weakening

  • the current move is diverging from the larger structure

  • price is transitioning between phases

This creates a useful distinction between:

Where the market has been trending

and

What it is doing right now.

4. BREAKOUT INTELLIGENCE

This is where the engine moves beyond a simple Bollinger breakout alert.

For the most recent qualifying breakout, the dashboard can display:

  • Breakout Direction

  • Bars Since Breakout

  • Breakout Status

  • Breakout Quality

  • Candle Classification

  • Body Percentage

  • Close Position Percentage

  • ATR Distance

  • Current Price Position

  • Signal Insight

The quality assessment combines measurable properties of the breakout candle and its relationship to the channel.

For example, a breakout candle can be examined according to:

BODY SIZE

How much of the candle's total range was occupied by its body?

CLOSE POSITION

Did price close near the extreme of the candle or give back a substantial portion of the move?

ATR DISTANCE

How far did price move beyond the Bollinger threshold relative to current volatility?

These measurements provide a more detailed description of the breakout than simply marking the candle with an arrow.

5. POST-BREAKOUT ANALYSIS

The breakout itself is only one part of the story.

The engine can continue evaluating what happens after the initial channel violation.

The panel can show:

  • Post-Breakout State

  • Momentum

  • Progression

  • Bars Analyzed

  • Bullish Movement

  • Bearish Movement

  • Net Change

  • Efficiency

  • Bull / Bear / Range Bar Distribution

POST-BREAKOUT EFFICIENCY

Efficiency compares directional movement with opposing or non-directional movement during the analysis period.

This provides a way to distinguish between:

price that continues progressing in one direction

and

price that moves back and forth with relatively little directional progress.

It is an analytical measurement of what happened after the breakout—not a prediction of what must happen next.

6. FINAL ASSESSMENT

All of the major analytical components are brought together in the final dashboard section.

The assessment can incorporate:

  • volatility environment

  • broader trend

  • current trend

  • breakout quality

  • breakout status

  • post-breakout behavior

  • directional structure

The dashboard presents the resulting market interpretation using descriptive states such as:

BULLISH

BEARISH

EMERGING BULLISH

BULLISH STRUCTURE

CORRECTION

and other configured market states.

The final assessment is intended as a compact summary of the underlying measurements.

It does not replace your trading rules or risk management.

THE 7-PHASE INTELLIGENCE ENGINE

The indicator is built as a sequence of analytical stages rather than a single Bollinger calculation.

PHASE 1 — BOLLINGER BREAKOUT ENGINE

Core Bollinger Band calculations:

  • Period

  • Standard Deviation

  • Upper Band

  • Middle Band

  • Lower Band

  • Breakout detection

  • Fixed pre-breakout threshold evaluation

Default:

Bollinger Period: 20

Standard Deviation: 2.0

PHASE 2 — VOLATILITY ENGINE

The engine measures the behavior of Bollinger Band width over time.

Components include:

  • Width

  • ATR normalization

  • Width percentile

  • Width velocity

  • Width acceleration

  • Smoothing

  • Volatility-state thresholds

  • Hysteresis

Default width lookback:

100 bars

Default ATR:

14 periods

Velocity and acceleration lookbacks are configurable.

A hysteresis mechanism can also be used to reduce unnecessary switching between adjacent volatility states when conditions are close to a threshold.

PHASE 3 — PERSISTENT BREAKOUT TRACKING

Breakouts are not treated as isolated events that disappear after one candle.

The engine can scan a configurable historical range and maintain information about the latest qualifying breakout.

Default historical scan:

3,000 bars

The tracking system maintains the breakout's position using absolute bar indexing and allows the event to move through different lifecycle states as additional candles develop.

This creates continuity between:

Breakout → Confirmation → Retest → Failure / Sweep → Post-Breakout Behavior

rather than evaluating every candle independently.

PHASE 4 — BREAKOUT INTELLIGENCE

The breakout candle is examined using measurable price characteristics.

Key measurements include:

  • Body %

  • Close position %

  • Candle classification

  • ATR distance

  • Directional structure

  • Breakout quality

Default examples include:

Minimum breakout distance: 0.05 ATR

Strong breakout distance: 0.50 ATR

Directional body threshold: 60%

Close-position threshold: 75%

These parameters are configurable.

PHASE 5 — TREND & MARKET STRUCTURE

Trend analysis combines several independent measurements.

The engine can evaluate:

  • EMA alignment

  • EMA slope

  • ATR-normalized slope

  • ADX

  • +DI / -DI

  • Higher High / Higher Low structure

  • Lower High / Lower Low structure

  • Trend persistence

  • Momentum

  • Market phase

The General Trend and Current Trend use separate lookback settings, allowing broader and shorter-term conditions to be compared.

Default lookbacks:

General Trend: 50 bars

Current Trend: 20 bars

PHASE 6 — BREAKOUT VALIDATION

After a breakout occurs, the engine continues to monitor its development.

CONFIRMATION

Determines whether price remains beyond the relevant channel threshold for the configured confirmation period.

RETEST

Monitors whether price returns toward the broken channel area within the configured ATR distance.

Default:

0.25 ATR

FALSE BREAKOUT

Identifies situations where price breaks beyond the channel and subsequently closes back inside it according to the configured rules.

SWEEP

Detects a breakout structure where price extends beyond the channel and then reverses, using a configurable wick-distance condition.

Default sweep threshold:

35%

These labels describe observed price behavior. They are not guarantees about what the market will do afterward.

PHASE 7 — DASHBOARD & ALERTS

The final phase brings the analysis together visually.

Features include:

  • Multi-panel dashboard

  • Market-state display

  • Trend analysis

  • Breakout tracking

  • Breakout status

  • Post-breakout analysis

  • Final assessment

  • Historical breakout labels

  • Optional popup alerts

  • Optional sound alerts

  • Configurable dashboard position and dimensions

Alerts can be enabled for new breakout events and relevant breakout-state changes.

FOLLOW THE BREAKOUT THROUGH ITS LIFECYCLE

One of the useful ways to work with the indicator is to stop thinking of a breakout as a single signal.

Instead, observe its progression.

1. COMPRESSION

Bollinger width contracts relative to its historical range.

2. BREAKOUT

Price moves beyond the pre-existing Bollinger threshold.

3. INITIAL ASSESSMENT

The engine evaluates candle structure, distance and surrounding trend conditions.

4. CONFIRMATION

Price either maintains the breakout or begins returning toward the channel.

5. RETEST

Price revisits the broken area.

6. FAILURE / SWEEP

Price may return inside the channel or develop a sweep-like structure.

7. POST-BREAKOUT

The engine evaluates how the market actually behaved following the event.

This lifecycle perspective is one of the main differences between the indicator and a conventional Bollinger Band breakout marker.

PRACTICAL ANALYSIS SCENARIOS

COMPRESSION → EXPANSION

You notice Bollinger width has remained relatively compressed.

Price then breaks beyond the channel.

Instead of looking only at the breakout candle, you can examine the volatility percentile, width expansion, candle quality and broader trend together.

BREAKOUT → RETURN INSIDE

Price closes outside the band and subsequently returns inside.

The breakout lifecycle can identify the resulting state as the event develops rather than leaving the original breakout marker as the entire analysis.

BREAKOUT → RETEST

Price moves beyond the channel and later returns toward the broken area.

The retest component provides a specific status for this stage of the breakout lifecycle.

BREAKOUT → CONTINUATION

Price remains beyond the channel while post-breakout movement continues to develop.

The Post-Breakout panel allows you to examine directional movement, efficiency and bar distribution.

SHORT-TERM / BROADER TREND DIVERGENCE

The General Trend may remain bullish while the Current Trend begins showing opposing pressure.

This gives you additional context when evaluating a breakout that occurs during a potential transition or correction.

HISTORICAL AND LIVE DATA BEHAVIOR

The indicator is designed around completed-bar analysis.

Historical breakout calculations use completed data, while breakout states can continue evolving as subsequent bars become available.

This distinction matters.

A historical breakout can later become:

CONFIRMED

RETESTED

FALSE BREAKOUT

SWEPT

or another configured lifecycle state because later price action provides additional information.

The original historical event is not simply rewritten as though it had been known differently at the time.

For live use, the currently forming candle should be treated separately from completed-bar confirmation.

ATR NORMALIZATION

Different instruments can have very different price scales and volatility characteristics.

The engine therefore uses ATR normalization in several areas, including:

  • breakout distance

  • Bollinger width relationships

  • EMA slope

  • retest distance

  • sweep analysis

  • other configurable thresholds

This allows many measurements to be expressed relative to the market's current volatility rather than relying exclusively on fixed price distances.

PERSISTENT HISTORICAL CONTEXT

A common problem with simple indicators is that the analysis effectively starts again every time you attach the indicator or every time a new event occurs.

Bollinger Market & Trend Intelligence maintains a historical breakout context over a configurable scan range.

Default:

3,000 bars

The dashboard can therefore remain aware of the most recent relevant breakout while subsequent price action develops.

DESIGNED FOR A CLEANER DECISION PROCESS

You do not need to interpret every component individually every time.

A practical workflow is:

1. CHECK MARKET STATE

Is the market compressed, normal, or expanding?

2. CHECK GENERAL TREND

What is the broader directional environment?

3. CHECK CURRENT TREND

Is shorter-term pressure aligned or diverging?

4. CHECK BREAKOUT INTELLIGENCE

How does the breakout candle and breakout distance measure?

5. CHECK BREAKOUT STATUS

Has it confirmed, retested, failed, or developed another lifecycle state?

6. CHECK POST-BREAKOUT

What has actually happened since the breakout?

7. MAKE YOUR OWN DECISION

Use the information alongside your trading method, risk management and other relevant market conditions.

The indicator is designed to make the analysis easier to organize—not to make the decision for you.

CONFIGURABLE PARAMETERS

The engine provides extensive control over its analytical components.

Bollinger

  • Period

  • Standard Deviation

Volatility

  • Width Lookback

  • ATR Period

  • Velocity Lookback

  • Acceleration Lookback

  • Smoothing

  • Volatility Thresholds

  • Hysteresis

Breakout Detection

  • Minimum ATR Distance

  • Strong Breakout Distance

  • Confirmation Bars

  • Breakout Retirement Rules

  • Historical Scan Range

  • Visible Historical Breakouts

Breakout Intelligence

  • Body Threshold

  • Close Position Threshold

  • Ranging Threshold

  • Directional Majority

  • Efficiency Threshold

Trend

  • General Trend Lookback

  • Current Trend Lookback

  • Slope Lookback

  • Neutral Slope Threshold

  • ADX Period

  • EMA Periods

  • ADX Strength Thresholds

Breakout Validation

  • Retest ATR Distance

  • Sweep Wick Threshold

  • Validation Parameters

Dashboard

  • Visibility

  • Corner

  • Width

  • Font Size

  • Horizontal / Vertical Offsets

  • Text Wrapping

  • Historical Labels

Alerts

  • Breakout Alerts

  • Status Alerts

  • Popup

  • Sound

MT4 TECHNICAL INFORMATION

Platform: MetaTrader 4

Indicator Type: Bollinger Band Market & Trend Analysis

Calculation: Native MT4 price and indicator data

Historical Analysis: Configurable historical scan

Default Scan: 3,000 bars

Bollinger Default: 20 / 2.0

ATR Default: 14

Trend Lookbacks: 50 / 20

External Dependencies: None

DLL: Not required

Web Requests: Not required

The indicator is designed to operate directly within the MT4 terminal without requiring external services.

WHO IS THIS FOR?

Bollinger Market & Trend Intelligence is intended for traders who already understand Bollinger Bands but want more context around breakout events.

It may be useful if you:

  • trade Bollinger Band breakouts

  • monitor volatility compression and expansion

  • analyze trend structure

  • use retests as part of your methodology

  • study failed breakouts and sweeps

  • want historical breakout context

  • prefer analytical dashboards over collections of separate indicators

  • want ATR-normalized measurements

  • want to examine what happens after a breakout rather than only the initial signal

It is an analysis tool, not a complete trading system.

WHAT THIS INDICATOR DOES NOT CLAIM

The engine does not know the future.

A high breakout-quality reading does not guarantee continuation.

A low-quality reading does not guarantee failure.

A bullish trend state does not guarantee a bullish move.

The purpose of the scoring and classification system is to organize measurable market information so that different breakout conditions can be compared consistently.

Your strategy, execution rules and risk management remain your responsibility.

WHY THIS IS DIFFERENT FROM A BASIC BOLLINGER INDICATOR

A conventional Bollinger indicator primarily answers:

Where are the bands?

A basic breakout indicator may add:

Did price cross the band?

Bollinger Market & Trend Intelligence goes further:

What was the volatility environment?

How did the breakout candle behave?

What was the broader trend?

What is the current trend doing?

Did the breakout confirm?

Did price retest the broken area?

Did it return inside the channel?

Did the move develop sweep-like characteristics?

What happened afterward?

How efficiently did price progress?

That is the central idea behind the engine.

The breakout is the event.

The surrounding behavior is the intelligence.

PRODUCT INFORMATION

Bollinger Market & Trend Intelligence is built for MT4 traders who want a structured way to analyze Bollinger Band breakouts, volatility conditions, trend structure and post-breakout behavior from a single chart interface.

If you already use Bollinger Bands, the indicator adds a broader analytical layer around them without requiring a collection of separate chart tools.

Use the included documentation to understand the calculations, dashboard states and available parameters before incorporating the indicator into your trading workflow.

SEARCH TERMS

Bollinger Bands MT4
Bollinger Breakout Indicator MT4
Bollinger Breakout Intelligence
Bollinger Band Breakout
Bollinger Volatility Indicator
Volatility Compression Indicator
Volatility Expansion MT4
Bollinger Trend Indicator
MT4 Trend Analysis
MT4 Breakout Indicator
Breakout Quality
Breakout Validation
False Breakout Detection
Breakout Retest Detection
Bollinger Sweep Detection
Post-Breakout Analysis
Post-Breakout Efficiency
ATR Normalization
Market Structure Indicator
MT4 Market Intelligence
Bollinger Dashboard
No-Repaint Bollinger Analysis


Рекомендуем также
Binary Strong Indication Indicator is Designed Based on 14 Different Strategies Based. You can Use Binary Strong Indication Indicator for Binary Option Trading or if you want you can Try it for Forex. Time-Frame : M1 Depend on your choice on which time frame you want to get Indication. Trade Time Duration: 60 Seconds or 5 Minutes Mostly we Used it for 60 seconds in iq option but you can use it for any binary broker. Input Parameters : HLB = 30 it means Highest & Lowest Point of 30 Bars. This Val
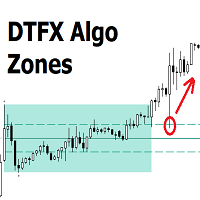
DTFX Algo Zones are auto-generated Fibonacci Retracements based on market structure shifts. These retracement levels are intended to be used as support and resistance levels to look for price to bounce off of to confirm direction.   USAGE Figure 1 Due to the retracement levels only being generated from identified market structure shifts, the retracements are confined to only draw from areas considered more important due to the technical Break of Structure (BOS) or Change of Character (CHo
В быстро меняющемся мире финансовых рынков каждая секунда на счету, и каждое решение может привести к успеху или неудаче сделки. Представляем Binary Hacker Indicator - новаторский инструмент, который призван изменить способ анализа ценовых движений трейдерами, минута за минутой. Откройте для себя точность в торговле:** Binary Hacker Indicator - это не обычный торговый инструмент. Он функционирует как анализатор в реальном времени, разбирая каждую минуту на графике, чтобы предоставить трейдерам ц
Представляю вам индюка скальпера, а также хорошо отрабатывает на бинарных опционах, дополнительно добавлена функция уведомления, где своевременно вы сможете открыть ордера в любом месте, главное чтоб был интернет, но, чтобы данная функция  работала установите индюка на желаемые котировки и все это на сервер VPN. В данном индикаторе для дополнительной фильтрации сигнала используется индикатор RSI, период можно изменить в настройках, для поиска входов в открытие сделки,  установите индикатор на та
Binary Options Assistant (BOA) BURN Signals Indicator provides signals based on Ana Trader Binary Options Strategy. Indicators: MACD & Stochastic Stop missing trades, stop jumping from chart to chart looking for trade set-ups and get all the signals on 1 chart! U se any of the BOA Signals Indicator with the  Binary Options Assistant (BOA) Multi Currency Dashboard .  All BOA Signal Indicator settings are adjustable to give you more strategy combinations. The signals can be seen visually and hea
Yawabeh SD Pro –  Professional Supply and Demand Indicator Trade Smarter with Volume-Confirmed Supply/Demand Zones Our institutional-grade algorithm identifies high-probability reversal zones before price reacts, giving you the edge in Forex, Crypto, and Stocks. Key Features Multi-Timeframe Confirmation – View trend strength across multiple timeframes simultaneously – Align your trades with higher timeframe momentum Smart Alert System – Real-time notifications for: – Strong demand/supply zone
TrendBand Navigator Pro – Non-Repainting Multi-Timeframe Trading System Powered by proprietary multi-dimensional trend band algorithm delivering clear arrow signals Big Arrows Define Direction Small Arrows Capture Entries   Core Advantages   Intelligent Noise Filtering Volatility-adaptive technology avoids false breakouts, triggers arrows only during strong trends   Multi-Timeframe Compatibility Automatically adapts from 1-minute to monthly charts for all trading strategies   Vis
The Binary Profit Maker,  This indicator works on MT4 and is very easy to use. When you receive a signal from it, you wait for that candle with the signal to close and you enter your trade at the beginning of the next new candle . A Up Purple arrow means Buy and a Down Purple arrow means Sell. All arrows comes with Alert  like for easy identification of trade signal. Are you okay with that? How To Enter Trade? 1 minute candle 1 minute expire
Готовая стратегия для бинарных опционов! Для формирования сигнала используются уровни поддержки/сопротивления, для фильтрации полученных сигналов используются несколько индикаторов, которые уже встроены в Strategy for Binary Options Galaxy. При формировании сигнала появляется стрелка. Если сигнал активен, то стрелка остается по закрытию бара, если же сигнал недостаточно силен, стрелка пропадает. Небольшое количество сигналов и небольшое торговое время не заставит вас сидеть целый день за компьют
This   Rattling Signal Point   indicator is designed for signal trading. This indicator generates trend signals. It uses many algorithms and indicators to generate this signal. It tries to generate signals from the points with the highest trend potential. This indicator is a complete trading product. This indicator does not need any additional indicators. The indicator is never repainted. The point at which the signal is given does not change. When the signal comes the arrows are put back on
Индикатор Crypto_Forex "Scalping_Channel" для MT4. - Scalping Channel имеет границы волатильности на основе ATR. - Отлично подходит для скальпинговой торговли: - Входите в сделки, размещая отложенный лимитный ордер на средней линии. - Рассматривайте бычьи входы, когда имеет место зеленый устойчивый восходящий канал и хотя бы 1 свеча закрылась выше верхней границы (см. рисунки). - Рассматривайте медвежьи входы, когда имеет место красный устойчивый нисходящий канал и хотя бы 1 свеча закрылась ниж
RectangleInd
Aliakbar Mohseni Pour
One of the most successful strategies in Forex, stick and metal market, is rectangle pattern. A hard pattern to find in multiple time frames, but, We made it so very easy for you. You can turn on this indicator in different currency pairs with different time frames and set the alarm on your computer or mobile phone. Working with this strategy is easy and enjoyable. Telegram:  https://t.me/triangleexpert Instagram: https://www.instagram.com/p/CNPbOLMh9Af/?igshid=15apgc7j1h5hm Note: This indicat
Some informations on the chart with the single attachment. RangeBorder Buy Sell (RBBS) Non Repaint Indicator will provide trend line, buy sell arrows,reversal arrows, range channel, order exit area,high average price line and low average price line.All arrows and lines don't repaint and not lagging. Once candle closed it won't  repaint. Reading Indicator: 1. Small Stars , Indicates oversold and overbought with certain logic and price may reverse when this small star triggers. Useful to identify
Индикатор создан для бинарных опционов. При звуковом оповещении Вам следует немедленно входить в сделку. Индикатор действует на основании сигнала осцилляторов RSI и CCI и уровней поддержки и сопротивления. Когда график находиться в зонах перекупленности и перепроданности, он находит в этой же зоне уровень и оповещает звуковым и текстовым сообщением. Параметры индикатора dist - количество пунктов, для выдача сигнала. Подходящие значения - от 21 до 50. Filtr_SMA -фильтр переназначен для торговли
Pine script scalping indicator — это многоуровневая аналитическая система, созданная для точечной интерпретации микроструктуры ценовых колебаний в условиях высокой волатильности. В основе лежит комплексная модель динамического фильтрации ценовых рядов с учётом межтаймфреймовых проекций и нелинейной аппроксимации вектора тенденций. В отличие от стандартных инструментов технического анализа, данный индикатор не ограничивается статическим осцилляторным подходом, а использует гибридную интерпретацию
Always Strong indicator, an indicator that uses MacD and Bollinger bands. It is a coded indicator to find trends. It finds these trends by its own algorithm. This indicator requires visual monitoring. It does not give any warning because it needs visual follow-up. The main trendline should turn down to find the down trend. The main trend line should go under the white line and then go under the yellow line. The main trendline should turn upward to find the upward trend. The main trend line shoul
BinaryLuckMt4
Andrey Spiridonov
1 (1)
Индикатор BinaryLuck - мощный инструмент для торговли бинарными опционами с любым временем экспирации. Особенно данный индикатор будет полезен для торговли краткосрочными бинарными опционами, со временем экспирации 30-60 секунд. Это полностью готовая, самодостаточная торговая система. Индикатор прогнозирует для текущей свечи максимальную цену High и минимальную цену Low. Затем вычисляет в процентном отношении к диапазону между прогнозируемым High и Low какой путь прошла цена текущей свечи ( Rang
KT Candlestick Patterns Scanner is a Multi-Symbol and Multi-Timeframe scanner that fetches and shows various candlestick patterns on 28 currency pairs and 9 time-frames concurrently . The scanner finds the candlestick patterns by loading the KT Candlestick Patterns indicator as a resource in the background. Features The scanner can find the candlestick patterns on 252* combinations of symbols and time-frames from a single chart. Open the signal's chart loaded with a predefined template with a s
Индикатор разработан для торговли бинарными опционами на малых таймфреймах до м 15  Прост в использовании не нуждается в дополнительных настройках и можно использовать без дополнительных фильтров  Рекомендации для торговли При появлении сигнала ( синий стрелки показывающий на верх ) нужно рассматривать направление на buy При появлении сигнала ( красной строки показывающий на низ ) нужно рассматривать направление на sell Заключить сделку стоит на той свечи где пришел сигнал на одну свечу если сиг
Multi Signal
Filip Maurice Daelman
Multi Signal Indicator contains a whole series of intersting buy,sell and exit signals that can be separately turned on/off. Signals : Liquidity Pools Liquidity Pools Forecast Projection Reversal Blocks Pinbar groups Overbought/Oversold with Moving Average Band (5 MA bands) Moving Average Difference Liquidity is an important aspect in the market, especially for institutional investors, as they need lots of liquidity to enter or exit the market. Therefore, institutional traders focus more on dema
Pro Magic Signal   indicator is designed for signal trading. This indicator generates trend signals.  It uses many algorithms and indicators to generate this signal. It tries to generate a signal from the points with the highest trend potential. This indicator is a complete trading product. This indicator does not need any additional indicators.  The indicator certainly does not repaint. The point at which the signal is given does not change.  Thanks to the alert features you can get the signals
Quantum Balance — это современный стрелочный индикатор, который определяет ключевые точки разворота цены на рынке с высокой точностью. Он основан на сочетании WPR (Williams %R) и RSI (Relative Strength Index), что позволяет выявлять моменты перекупленности/перепроданности и входить в сделки в точках максимального потенциала. Индикатор анализирует динамику цены и рыночные условия, создавая сигналы только при совпадении нескольких подтверждающих факторов. Это снижает количество ложных сигналов и
EARLY REMINDER: The Starting price is 65 price will rise soon up to 365$ and then 750$ after first 10 copies of sales. Grab this offer now! Introduction Hello, traders! Welcome to the demonstration of the Forex Beast Indicator , a comprehensive tool designed to assist aspiring traders in navigating the complexities of the forex market. This indicator incorporates seven essential components to provide a well-rounded trading experience: Moving Averages Colored Zones Support and Resistance Levels
Trend Professional is an indicator that generates trend signal. It generates trend signal with its own algorithm. These arrows give buying and selling signals. The indicator certainly does not repaint. Can be used in all pairs. Sends a signal to the user with the alert feature. Trade rules Enter the signal when the buy and sell signal arrives. Processing should only be initiated when signal warnings are received. It is absolutely necessary to close the operation when an opposite signal is recei
Target Striking - Один из лучших инструментов для торговли на Бинарных Опционах! Настроен настолько мощно что можно не только на валютных парах торговать но и на сырье золоте нефти! Так же можете попробовать на криптовалюте! Идеально подходит для торговли на валютных парах, процент надежных сделок больше +75% Инструмент для торговли уже настроен на лучшую прибыль! Только  Target Striking способен открыть вам потенциал торгового рынка! С ним сигналы ровные и точные без перерисовки, открывается си
An indicator based on candlestick patterns To catch short-term and long-term trends If it gives a signal in the direction of the trend, it is long term And if it gives a signal in the opposite direction of the trend, it is short term Too many signals Can be used in all symbols Can be used in all time frames Attributes: Too many signals Can be used in all symbols Can be used in all time frames Simple settings Simple and fast usage With author lifetime support Settings: Candle back: The number
BinaryPin
Andrey Spiridonov
3.67 (3)
BinaryPin - индикатор, разработан и адаптирован специально для торговли краткосрочными бинарными опционами. Алгоритм индикатора, прежде чем выдать сигнал анализирует множество факторов, такие как волотильность рынка, ищет патерн PinBar, расчитывает вероятность успеха при совершении сделки.  Устанавливается индикатор обычным способом. Сам индикатор состоит из информационного окна, где отображается имя торгового инструмента, значение вероятности совершения успешной сделки, непосредственно сам сиг
FREE
Crypto_Forex Indicator "ReTest Pro Histogram" для MT4, без перерисовки. - Индикатор ReTestPro_Histogram может использоваться для поиска сигналов входа в направлении основного тренда после повторного тестирования сильного уровня поддержки/сопротивления. - Гистограмма ReTestPro может быть двух цветов: красного для медвежьего тренда и зеленого для бычьего. - Как только вы увидите устойчивые последовательные столбцы гистограммы одного цвета, это означает, что наступил новый тренд. - Сигнал ReTest
Scalping arrows not redraw - индикатор который показывает на графике точки разворота цены и не перерисовывает свои сигналы. Так же, индикатор отправляет трейдеру сигналы на Email и Push. Точность сигналов данного индикатора примерно 92-94% на таймфрейме M5 и более 95% на таймфрейме H1. Таким образом этот индикатор позволяет трейдеру достаточно точно открывать сделки и прогнозировать дальнейшее движение цены.  Точки разворота цены на графике обозначаются с помощью простых и понятных для каждого т
This is a trend following system for Binary options traders and forex scalpers. It is carefully crafted and recognizes periods of strong trends in the market and gives the trader the advantage and opportunity of riding with the momentum. It works on all timeframes and currency pairs especially high liquidity pairs. Avoid news events 15mins before and after. Always have your money management script or system in place. Tested on Deriv synthetics as well, please check screenshots. MT5 version can b
С этим продуктом покупают
Trend SniperX MT4
Sarvarbek Abduvoxobov
5 (5)
Trend Sniper X — это мультитаймфреймовый трендовый индикатор для MetaTrader 5, который помогает трейдерам точно и четко определять направление тренда и потенциальные точки разворота. Для MT5: https://www.mql5.com/en/market/product/181101 Информация о цене: Текущая цена является промо-ценой и может измениться по мере выхода новых обновлений и функций. Канал Code2Profit Освойте рынок с помощью мультитаймфреймового анализа! Как максимизировать процент побед с Trend Sniper X: ключевые правила и сове
AW Prime Oscillator
AW Trading Software Limited
5 (1)
Комбинация из двух осцилляторов. Первый отображает точки входа, второй - текущий тренд. Индикатор может отображать сигналы осцилляторов стрелками в двух режимах, все сигналы быстрого осциллятора или сигналы только по текущему тренду. Имеет мультитаймфреймовую панель и три типа уведомлений о появлении сигнала.   Преимущества: Подходит для дневной и скальпирующей торговли Трендовая фильтрация Простая и чувствительная настройка Мультитаймфреймовая панель Подходит для интеграции в советник.  Работае
Super Signal – Skyblade Edition Профессиональная система трендовых сигналов без перерисовки и без задержек с исключительным процентом выигрышей | Для MT4 / MT5 Лучше всего работает на младших таймфреймах, таких как 1 минута, 5 минут и 15 минут. Основные характеристики: Super Signal – Skyblade Edition — это интеллектуальная система сигналов, специально разработанная для трендовой торговли. Она использует многоуровневую фильтрацию, чтобы выявлять только сильные направленные движения, подкреплённ
Liquidity Scalper System — торговая система на основе ликвидности в формате индикатора. Большинство индикаторов показывают только стрелку, а дальше трейдер сам решает, где поставить стоп, где цель и можно ли вообще доверять сигналу. Liquidity Scalper System закрывает весь цикл сделки: находит пулы ликвидности, даёт сигнал при их пробое, сразу рассчитывает Entry, Stop Loss и три цели, а на панели показывает статистику и результаты проверки на новых данных. Система сама подбирает настройки и обнов
Atomic Analyst — MetaTrader 4 По вопросам продукта, настройки или технической поддержки напишите мне напрямую здесь, на MQL5. Индикатор превращает сложные рыночные расчеты в простые визуальные сигналы, цветные свечи, показания тренда, уровни стоп-лосса и несколько зон тейк-профита, которые трейдеры могут быстро понять и использовать в реальных рыночных условиях. Основные варианты использования: Скальпинг и внутридневная торговля: Создан для быстрого принятия решений, четких стрелок, алертов, цв
Smart Trend Trading System — индикатор для MetaTrader 4, который объединяет информацию о тренде, сигналы входа и выхода и ценовые уровни на одном графике. Система объединяет более 10 торговых инструментов в одном решении, включая определение тренда, зоны разворота, Smart Cloud, логику трейлинг-стопа, поддержку и сопротивление, окраску свечей, уведомления и мульти-таймфрейм анализ. Система создана, чтобы помочь вам торговать в разных рыночных условиях: Трендовые рынки: Определяйте главный тренд,
Neuro Poseidon - новый индикатор от Дарьи Резуевой. Он сочетает точные торговые сигналы с адаптивными уровнями TP/SL , в результате создавая максимально выгодные сделки! TO SWITCH TO   ENG   PLEASE CHOOSE IT IN THE UPPER-RIGHT CORNER OF THE WEBSITE Напишите мне после покупки и получите Neuro Poseidon Assistant в подарок для автоматизации вашей торговли! Что отличает его от других индикаторов? 1. Доказанная прибыльность на всех активах и таймфреймах 2. На графике присутствуют только подтвержденн
В настоящее время скидка 30%! Лучшее решение для новичка или трейдера-эксперта! Эта приборная панель работает на 28 валютных парах. Он основан на 2 наших основных индикаторах (Advanced Currency Strength 28 и Advanced Currency Impulse). Он дает отличный обзор всего рынка Forex. Он показывает значения Advanced Currency Strength, скорость движения валюты и сигналы для 28 пар Forex на всех (9) таймфреймах. Представьте, как улучшится ваша торговля, когда вы сможете наблюдать за всем рынком с помощ
SR Liquidity — это торговый индикатор, предназначенный для выявления скрытых зон, где концентрируется рыночная ликвидность и наблюдается наиболее сильная реакция цены. Эти особые зоны ликвидности выступают в качестве мощных уровней поддержки и сопротивления, предоставляя вам четкую картину того, где с наибольшей вероятностью произойдет разворот рынка. Вместо построения стандартных линий поддержки и сопротивления, индикатор SR Liquidity анализирует реальное поведение цены, выявляя зоны концентрац
M1 Sniper
Oleg Rodin
4.97 (30)
M1 SNIPER — это простая в использовании торговая система. Это стрелочный индикатор, разработанный для тайм фрейма M1. Индикатор можно использовать как отдельную систему для скальпинга на тайм фрейме M1, а также как часть вашей существующей торговой системы. Хотя эта торговая система была разработана специально для торговли на M1, ее можно использовать и с другими тайм фреймами. Первоначально я разработал этот метод для торговли XAUUSD и BTCUSD. Но я считаю этот метод полезным и для торговли на д
Top Bottom Tracker - это индикатор, основанный на сложных алгоритмах, которые анализируют рыночную тенденцию и могут определять максимумы и минимумы тренда / Версия для MT5 . Цена будет постепенно увеличиваться, пока не достигнет 500$. Следующая цена --> $99 Особенности Отсутствие перерисовки Индикатор не меняет свои значения при поступлении новых данных Торговые Все пары Форекс Таймфрейм   Все таймфреймы Параметры ==== Конфигурация индикатора ==== Параметр конфигурации // 40 (Чем выше
Advanced Supply Demand
Bernhard Schweigert
4.91 (302)
Специальное предложение – скидка 30% Этот индикатор является уникальным, качественным и доступным инструментом для торговли, включающим в себя наши собственные разработки и новую формулу. В обновленной версии появилась возможность отображать зоны двух таймфреймов. Это означает, что вам будут доступны зоны не только на старшем ТФ, а сразу с двух таймфреймов - таймфрейма графика и старшего: отображение вложенных зон. Обновление обязательно понравится всем трейдерам, торгующим по зонам спроса и пре
Представленный индикатор использует минувшие рыночные циклы для прогнозирования движения цены в будущем. Прогнозы изображаются в виде вертикальных линий с правой стороны графика, куда рынок еще не продвинулся. Прогноз часто дает в результате тип свечи (например, бычья или медвежья) и/или точку разворота (например, дно или вершина), которые формируются в настоящий момент. Линии рисуются заранее, в чем и заключается уникальность индикатора. Преимущества Индикатор не перерисовывает, не передвигае
Break and Retest Hunter MT4 is a powerful MetaTrader 5 indicator designed to automatically identify support and resistance levels, breakout structures, and potential retest opportunities in real time. Bonus Indicator: After purchasing Break and Retest Hunter , contact me to receive Trade Indicator Assistant EA completely free as a bonus utility. $65 for the next 10 copies . Next price is $120.  Combining adaptive market analysis, clear BUY/SELL signals, Fibonacci-based profit targets, and a pre
PRO Renko System - это высокоточная система торговли на графиках RENKO. Система универсальна. Данная торговая система может применяться к различным торговым инструментам. Система эффективно нейтрализует так называемый рыночный шум, открывая доступ к точным разворотным сигналам. Индикатор прост в использовании и имеет лишь один параметр, отвечающий за генерацию сигналов. Вы легко можете адаптировать алгоритм к интересующему вас торговому инструменту и размеру ренко бара. Всем покупателям с удовол
Индикатор ForexTrendMT4: Инструмент для Надежного Отслеживания Рынка Индикатор ForexTrendMT4 обеспечивает надежное отслеживание рыночного тренда, игнорируя резкие колебания и рыночный шум. Этот инструмент помогает выявлять тренды и указывает на благоприятные моменты для входа в рынок с помощью стрелок. Индикатор подходит как для краткосрочной торговли на мелких периодах, так и для долгосрочных стратегий. Основываясь на принципах технического анализа, ForexTrendMT4 учитывает циклическую природу
CRT Multi-Timeframe Market Structure & Liquidity Sweep Indicator Non-Repainting | Multi-Asset | MT5 Version Available MT5 Version:   https://www.mql5.com/en/market/product/162075 Full User Guide — explains what each feature does and why:   https://www.mql5.com/en/blogs/post/767525 Quick Start User Guide  — explains how to configure and in what order:  https://www.mql5.com/en/blogs/post/767540 Indicator Overview CRT Ghost Candle HTF Fractal is a complete institutional-grade market structure too
KT Parabolic RSI MT4
KEENBASE SOFTWARE SOLUTIONS
KT Parabolic RSI overlays Parabolic SAR directly on the RSI line to highlight likely market turning points. Classic RSI overbought and oversold readings already hint at reversals, and the added PSAR filter removes much of the noise and sharpens those signals, giving you clearer trade setups. Big Square Signals: A Parabolic SAR flip on an RSI that sits in overbought or oversold territory. These mark high-probability market turns. Small Square Signals: A SAR flip inside the neutral RSI band. Treat
Currency Strength Wizard — очень мощный индикатор, предоставляющий вам комплексное решение для успешной торговли. Индикатор рассчитывает силу той или иной форекс-пары, используя данные всех валют на нескольких тайм фреймах. Эти данные представлены в виде простых в использовании индексов валют и линий силы валют, которые вы можете использовать, чтобы увидеть силу той или иной валюты. Все, что вам нужно, это прикрепить индикатор к графику, на котором вы хотите торговать, и индикатор покажет вам ре
В НАСТОЯЩЕЕ ВРЕМЯ СКИДКА 40% Лучшее решение для новичка или трейдера-эксперта! Этот индикатор является уникальным, высококачественным и доступным торговым инструментом, поскольку мы включили в него ряд собственных функций и новую формулу. С помощью всего лишь ОДНОГО графика вы можете определить силу валюты для 28 пар Форекс! Представьте, как улучшится ваша торговля, потому что вы сможете точно определить точку запуска нового тренда или возможность скальпирования? Руководство пользователя:  
Introducing Volume Orderflow Profile , a versatile tool designed to help traders visualize and understand the dynamics of buying and selling pressure within a specified lookback period. Perfect for those looking to gain deeper insights into volume-based market behavior! MT5 Version -  https://www.mql5.com/en/market/product/122657 The indicator gathers data on high and low prices, along with buy and sell volumes, over a user-defined period. It calculates the maximum and minimum prices during this
Стрелка говорит вам покупать. Obsidian Scalper Pro говорит, где покупать, где стоит стоп, где три цели, каким должен быть объём под ваш риск и насколько хорош сетап по шкале до 100. Каждый сигнал приходит готовым торговым планом, нарисованным на графике, а встроенное окно статистики показывает честный результат последних ста таких планов, включая винрейт с доверительным интервалом. Каждое решение принимается на закрытом баре, поэтому история, на которую вы смотрите, это и есть история, которую в
UR TrendИсчерпание   UR TrendExhaustion - лучшее решение для трейдеров, которые не хотят иметь дело ни со значениями параметров, ни с другими настройками - оно простое и визуально понятное для всех. Преимущества использования UR TrendExhaustion: Нет параметров У вас есть 3 линии, которые лучше всего описывают то, что происходит на графике: линия истощения тренда, линия китовых денег и линия розничных денег. Интерфейс демонстрирует исчерпание любой линии на обоих крайних значениях (красные об
This indicator works on MT4 and is very easy to use. When you receive a signal from it, you wait for that candle with the signal to close and you enter your trade at the beginning of the next new candle . A red arrow means sell and a green arrow means buy. All arrows comes with Alert  like for easy identification of trade signal. Are you okay with that? 1 minute candle 1 minute expire
This is a professional chart indicator designed for traders focused on stability and clear price action. It helps filter market noise and provides clear visual entry and exit zones for your trading decisions. Core Features: Strictly Non-Repainting: The system is built with strict non-repaint logic. What you see on the chart is the true historical performance. Confirmed Signals: Signals are triggered and confirmed only after the candle closes . Once a trading arrow appears on a closed candle, it
Сигнал GoldRush Trend Arrow Индикатор GoldRush Trend Arrow Signal предоставляет точный анализ тренда в режиме реального времени, специально разработанный для высокоскоростных краткосрочных скальперов в XAU/USD. Этот инструмент, созданный специально для 1-минутного таймфрейма, отображает стрелки направления для четких точек входа, позволяя скальперам уверенно ориентироваться в волатильных рыночных условиях. Индикатор состоит из ПЕРВИЧНЫХ и ВТОРИЧНЫХ стрелок оповещения. ПЕРВИЧНЫЕ сигналы — это
Scalper Vault — это мощная, полноценная торговая система, созданная для трейдеров, которые стремятся к стабильным результатам в внутридневной торговле. Этот высокоточный индикатор представляет собой комплексное, самостоятельное торговое решение, обеспечивающее аналитику профессионального (институционального) уровня как для торговли на рынке Forex, так и для работы с бинарными опционами. Пожалуйста, свяжитесь со мной после покупки, чтобы получить мои торговые советы, а также отличный бонус! Исклю
TREND LINES PRO помогает понять, где рынок действительно меняет направление. Индикатор показывает реальные развороты тренда и места, где крупные участники входят повторно. Вы видите BOS-линии смены тренда и ключевые уровни старших таймфреймов — без сложных настроек и лишнего шума. Сигналы не перерисовываются и остаются на графике после закрытия бара. VERSION MT 5     -     Раскрывает свой максимальный потенциал в связке с индикатором  RFI LEVELS PRO Что показывает индикатор: Реальные смены   тр
Binary Trader Master — это стрелочный индикатор, который предсказывает закрытие свечи. Он делает свой анализ только в пределах одной свечи. Когда свеча открывается, требуется несколько минут, чтобы провести анализ и предсказать закрытие свечи. Затем генерируется сигнал. Индикатор также позволяет вам применять временные ограничения, которые он может использовать для анализа, что означает, что вы можете фактически указать индикатору, сколько времени ему разрешено иметь для анализа в пределах свечи
Gann Made Easy - это профессиональная, но при этом очень простая в применении Форекс система, основанная на лучших принципах торговли по методам господина У.Д. Ганна. Индикатор дает точные BUY/SELL сигналы, включающие в себя уровни Stop Loss и Take Profit. ПОЖАЛУЙСТА, СВЯЖИТЕСЬ СО МНОЙ ПОСЛЕ ПОКУПКИ, ЧТОБЫ ПОЛУЧИТЬ ТОРГОВЫЕ ИНСТРУКЦИИ И ОТЛИЧНЫЕ ДОПОЛНИТЕЛЬНЫЕ ИНДИКАТОРЫ БЕСПЛАТНО! Вероятно вы уже не раз слышали о торговли по методам Ганна. Как правило теория Ганна отпугивает от себя не только н
Другие продукты этого автора
SWING DETECTOR WITH RSI AND FIBONACCI Structural Swing Points + Fibonacci Retracement + RSI Overlay -------------------------------------------------- FREE INDICATOR Identify swings. See Fibonacci levels. Check RSI. All in one free indicator. -------------------------------------------------- WHAT THIS INDICATOR DOES This indicator automatically detects structural swing highs and lows using configurable depth and deviation filtering. It connects swings with trend lines, overlays standard
FREE
Trend and Consolidation Matrix — это индикатор структуры рынка и ценового действия (Price Action) для MetaTrader 5, объединяющий 6-уровневую адаптивную ленту тренда, модуль пространственных зон консолидации и систему алертов на пробои и ретесты для Forex, Gold (XAUUSD) и индексов. Разработанный для скальпинга, дейтрейдинга и свинговой торговли, алгоритм рассчитывает направление тренда, структуру волатильности и геометрию плотности цен строго на закрытых барах без перерисовки истории. Архитектура
FREE
VWAP Ribbon Intelligence — это индикатор технического анализа для MetaTrader 4, объединяющий средневзвешенную цену по объему (VWAP), динамические ленты волатильности ATR Уайлдера и телеметрию импульса RSI на графике для Forex, Gold (XAUUSD), индексов и криптовалют. Разработанный для дейтрейдинга, скальпинга и свинговой торговли, инструмент проецирует зоны расширения волатильности и показатели импульса прямо на основной ценовой график без необходимости использования подвальных осцилляторов. Архит
FREE
VWAP Ribbons
Charles Mwangi Ndungu
VWAP Ribbon Intelligence — это индикатор технического анализа для MetaTrader 5, объединяющий средневзвешенную цену по объему (VWAP), динамические ленты волатильности ATR Уайлдера и телеметрию импульса RSI на графике для Forex, Gold (XAUUSD), индексов и криптовалют. Разработанный для дейтрейдинга, скальпинга и свинговой торговли, инструмент проецирует зоны расширения волатильности и показатели импульса прямо на основной ценовой график без необходимости использования подвальных осцилляторов. Архит
FREE
SWING HIGHS LOWS DETECTOR Swing Detection with Divergence Analysis -------------------------------------------------- Identify swings. Spot divergences. Trade with confluence. -------------------------------------------------- WHAT THIS INDICATOR DOES This indicator automatically detects structural swing highs and lows using configurable depth and deviation filtering. It then analyzes RSI and MACD to detect regular and hidden divergences between consecutive swings of the same type. Diver

FREE
SWING HIGHS LOWS DETECTOR Swing Detection with Divergence Analysis -------------------------------------------------- Identify swings. Spot divergences. Trade with confluence. -------------------------------------------------- WHAT THIS INDICATOR DOES This indicator automatically detects structural swing highs and lows using configurable depth and deviation filtering. It then analyzes RSI and MACD to detect regular and hidden divergences between consecutive swings of the same type. Diver
FREE
SWING VOLUME PROFILE Swing-Based Volume Profile + Fibonacci + RSI -------------------------------------------------- Auto-detected swings. Volume profile. Fibonacci. RSI. All-in-one. -------------------------------------------------- WHAT THIS INDICATOR DOES Swing Volume Profile (SVP) automatically detects structural swings and displays a volume profile for the most recent completed swing — with Fibonacci retracement and RSI overlay. No manual range selection needed. The indicator finds
Fixed Range Volume Profile — это инструмент анализа объема для MetaTrader 5, который рассчитывает и отображает распределение объема по любому выбранному диапазону цен и времени с помощью стандартных трендовых линий для Forex, Gold (XAUUSD), индексов и криптовалют. Разработанный для дейтрейдинга, скальпинга и свинговой торговли, индикатор автоматически строит точку контроля (POC), границы зоны стоимости (VAH/VAL) и сильные уровни поддержки и сопротивления без сложной ручной настройки. Архитектура
Fixed Range Volume Profile MT4 Volume Profile Indicator — Auto-Detecting Trendline Tracking, POC, Value Area & High Volume Nodes in Real Time Fixed Range Volume Profile (FRVP) displays volume distribution over a user-defined range — automatically detecting the latest trendline you draw or drag on the chart. No manual range selection. No naming conflicts. Just draw a trendline and the profile appears. Update it live by dragging. MT4 Native • No Repainting • Real-Time Trendline Tracking • Fully Cu
Adaptive Swing Density Heat Map MT4 Structural Density Indicator — Swing Clustering, Participation Tracking, Acceptance vs Rejection & Color-Coded Heat Map Adaptive Swing Density Heat Map analyzes swing point density across price levels, then tracks how price actually interacts with each zone — measuring participation, acceptance, and rejection. The result is a heat map of structural zones, color-coded by density strength. Not all support and resistance levels are equal — this indicator quantif
CONSOLIDATION INTELLIGENCE PRO MT4 Consolidation Indicator | Automatic Range Detection + 5-Tier Price-Density Heatmaps + Re-Entry Alerts Consolidation Intelligence Pro is a MetaTrader 4 indicator designed to identify areas where price repeatedly overlaps and trades within a concentrated range. The indicator analyzes candle overlap, body-to-wick structure, zone strength, and price-density distribution, then displays detected consolidation areas as 5-tier heatmaps directly on the chart. It also su
DONCHIAN MARKET & TREND INTELLIGENCE ENGINE (MT4) Multi-Factor Volatility, Trend Structure & Institutional Breakout Validation Dashboard MOST BREAKOUT INDICATORS ARE TRAPPING YOU. They Tell You THAT Price Broke Out. They Never Tell You IF It Will Hold. You have lived this scenario dozens of times: Price spends days coiling inside a tight Donchian band on your MT4 chart. A massive candle punches above the 20-period high. You buy the breakout — expecting momentum. Three candles later, price colla
VWAP Sniper Reversal Pro v3.00 MT4 Mean-Reversion Indicator — Rolling VWAP, Dual-Layer ATR Bands, Volume Exhaustion, RSI Gate & Confirmation Modes VWAP Sniper Reversal Pro identifies potential mean-reversion setups at statistical price extremes. It combines a rolling volume-weighted average price (VWAP) baseline, dual-layer ATR deviation bands, volume and wick exhaustion filters, and an RSI gate to confirm reversal signals on completed bars. Built for traders who want multi-factor confluence ra
Adaptive Swing Density Heat Map MT5 Structural Density Indicator — Swing Clustering, Participation Tracking, Acceptance vs Rejection & Color-Coded Heat Map Adaptive Swing Density Heat Map analyzes swing point density across price levels, then tracks how price actually interacts with each zone — measuring participation, acceptance, and rejection. The result is a heat map of structural zones, color-coded by density strength. Not all support and resistance levels are equal — this indicator quantif
Swing Volume Profile MT5 Swing Volume Profile Indicator — Auto Swing Detection, Volume Profile, Fibonacci Retracement & RSI Overlay in One Chart Tool Swing Volume Profile (SVP) automatically detects structural swings and displays a volume profile for the most recent completed swing — with Fibonacci retracement and RSI overlay. No manual range selection. No trendline required. The indicator finds the swings and builds the profile automatically. MT5 Native • No Repainting • Auto Swing Detection •
Consolidation Intelligence Pro MT5 Consolidation Indicator — Automatic Range Detection, 5-Tier Price-Density Heatmaps & Re-Entry Alerts Consolidation Intelligence Pro automatically identifies where price repeatedly overlaps and trades within a concentrated range — then renders that structure as a 5-tier price-density heatmap directly on your chart. No more manually drawing every consolidation box. The indicator analyzes historical price structure, measures candle overlap and body-to-wick charac
DONCHIAN MARKET & TREND INTELLIGENCE The Only Donchian Tool That Tells You WHY the Market Is Moving — Not Just Where Most Donchian indicators draw three lines and call it a day. You get an upper band. A middle band. A lower band. And when price pokes above the upper band, you're supposed to just... buy? That's not analysis. That's guessing with extra steps. THE PROBLEM EVERY DONCHIAN TRADER KNOWS You've seen it a hundred times. Price finally breaks above the 20-period high after days of compress
BOLLINGER MARKET & TREND INTELLIGENCE — MT5 STOP GUESSING WHAT A BOLLINGER BREAKOUT IS TELLING YOU You've been here before. It's 2 AM. You're staring at a chart. Price has just closed outside the upper Bollinger Band. You enter. Three candles later, price is back inside the band. Then the move reverses. You tell yourself: "I should have waited for a retest." But when you wait for the retest, sometimes price continues without giving you the entry you wanted. So you add another filter. RSI. Then M
VWAP Sniper Reversal Pro — это индикатор разворотов и откатов для MetaTrader 5, объединяющий средневзвешенную цену по объему (VWAP), двухслойные полосы волатильности ATR, всплески объема и фильтры импульса RSI для Forex, Gold (XAUUSD), индексов и криптовалют. Разработанный для скальпинга, дейтрейдинга и свинговой торговли, инструмент определяет точки разворота при сильном отклонении цены от справедливой стоимости, рассчитывая подтвержденные сигналы строго на закрытых барах без перерисовки истори
Super Trend and Consolidation Matrix — это индикатор структуры рынка и ценового действия (Price Action) для MetaTrader 5, объединяющий 6-уровневую адаптивную ленту тренда, модуль сжатия волатильности, динамические зоны консолидации и информационную панель конфлюэнции в реальном времени для Forex, Gold (XAUUSD) и фондовых индексов. Разработанный для скальпинга, дейтрейдинга и свинговой торговли, алгоритм предоставляет объективный структурный анализ, рассчитываемый строго на закрытых барах без пер
Gold Prism
Charles Mwangi Ndungu
Gold Prism EA — это автоматическая мультитаймфреймовая пробойная торговая система для XAUUSD, которая определяет ключевые уровни поддержки и сопротивления, ранжирует их значимость и исполняет импульсные сделки с помощью отложенных ордеров. Быстрая распродажа на старте: Для формирования первой торговой истории и сбора отзывов цена временно снижена до $199 только для первых 5 покупателей. После продажи первых 5 лицензий цена автоматически вырастет до $499, а затем достигнет стандартных $999. Скача
Фильтр:
Нет отзывов
Ответ на отзыв