On Balance Volume MTF

The OBV MTF is an Enterprise-grade On-Balance Volume indicator that transforms standard OBV into a complete trading system. It combines gradient-aware momentum analysis, divergence detection, multi-timeframe alignment, and dynamic customisable midpoint-filtering in a single intuitive professional volume analysis tool.

Core Features

1. 5-State Momentum Engine

  • Aqua (Strong Bullish): OBV slope rising with positive acceleration

  • SteelBlue (Weak Bullish): OBV rising but losing momentum

  • Gray (Neutral): OBV flat or consolidating within hysteresis band

  • DeepPink (Weak Bearish): OBV falling but losing downward momentum

  • Magenta (Strong Bearish): OBV slope falling with negative acceleration

This state machine uses hysteresis to prevent whipsaw and acceleration as a second derivative indicator. User can change these colours.

2. Dynamic Divergence Detection

Detects both regular and hidden divergences with a multi-factor scoring system (0-100):

  • Regular Bearish: Price makes higher high, OBV makes lower high

  • Regular Bullish: Price makes lower low, OBV makes higher low

  • Hidden Bearish: Price makes lower high, OBV makes higher high

  • Hidden Bullish: Price makes higher low, OBV makes lower low

Scoring factors:

  • Bar distance (12-50 bars ideal)

  • Volume confirmation

  • Slope steepness comparison

3. Native Multi-Timeframe Panel

Displays OBV direction on 3 user-selectable timeframes:

  • Shows BULL (▲ Aqua) when OBV rising

  • Shows BEAR (▼ Magenta) when OBV falling

  • Background color indicates confluence:

    • Dark Green: All 3 timeframes bullish

    • Dark Red: All 3 timeframes bearish

    • Dark Olive Green: Bullish bias (2 of 3)

    • Dark Violet: Bearish bias (2 of 3)

4. Dynamic Rolling Midpoint

Calculates the midpoint of OBV's range over a user-defined period:

  • Midpoint = (Highest OBV + Lowest OBV) / 2

  • Provides a dynamic reference line (not static overbought/oversold)

  • Visual gold line on the indicator window

5. Filter System

Three filter modes using the dynamic midpoint:

  • FILTER_NONE: All signals allowed

  • FILTER_TREND: Buy signals allowed above midpoint, sell signals allowed below midpoint

  • FILTER_MEAN_REVERSION: Sell signals allowed above midpoint, buy signals allowed below midpoint

Filters apply to both momentum arrows and divergence signals.

6. Momentum & Divergence Signals

Momentum Signals (Buffers 2 & 3):

  • ▲ Aqua Arrow: OBV transitions from Neutral to Strong Bullish

  • ▼ Magenta Arrow: OBV transitions from Neutral to Strong Bearish

Divergence Signals (Buffers 4 & 5):

  • ▲ Lime Green: Bullish divergence detected (regular or hidden)

  • ▼ Orange Red: Bearish divergence detected (regular or hidden)

Technical Specifications

Buffers index (for EA integration) and other specifications available upon purchase and request.


Input Parameters

  • InpSmoothingPeriod (default: 5) - EMA smoothing period

  • InpHysteresis (default: 0.15) - Deadband threshold

  • InpMidpointPeriod (default: 50) - Lookback for midpoint

  • InpFilterMode (default: FILTER_NONE) - Filter selection

  • InpMTF1, InpMTF2, InpMTF3 - MTF timeframes

  • InpMTFRefreshMins (default: 5) - MTF update interval

  • MinDivScore (default: 70.0) - Minimum divergence confidence

    COMMON QUESTIONS & ANSWERS

    Q: What timeframes does this indicator work best on?

    A: The indicator works on all timeframes. Optimal performance:

    • Scalping (M1-M5): SmoothPeriod=3, Hysteresis=0.10, RightBars=1

    • Day Trading (M15-H1): SmoothPeriod=5, Hysteresis=0.15, RightBars=3

    • Swing Trading (H4-D1): SmoothPeriod=8, Hysteresis=0.20, RightBars=5

    Q: Why does the MTF panel sometimes show "LOADING"?

    A: The panel needs to load data from multiple timeframes. It will display "LOADING" until 5+ bars are available on all selected timeframes. This typically resolves within 30 seconds.

    Q: What is the difference between regular and hidden divergence?

    A:

    • Regular Divergence: Signals potential reversal (Price and OBV move in opposite directions)

    • Hidden Divergence: Signals trend continuation (Price and OBV move in same direction but OBV shows momentum weakening)

    Both types are displayed with the same arrow colors but can be distinguished by the price pattern.

    Q: What does the gold midpoint line represent?

    A: The gold line is the dynamic midpoint of OBV's range over the lookback period (default 50 bars). It represents the center of recent volume distribution, calculated as (Highest OBV + Lowest OBV) / 2. It is NOT a static overbought/oversold level.

    Q: How do filters work with the midpoint?

    A:

    • FILTER_TREND: Only buy signals appear when OBV > midpoint; only sell signals appear when OBV < midpoint

    • FILTER_MEAN_REVERSION: Only sell signals appear when OBV > midpoint; only buy signals appear when OBV < midpoint

    • FILTER_NONE: All signals appear regardless of midpoint position

    Q: Can I use this indicator in an Expert Advisor?

    A: Yes. All buffers are accessible via iCustom() calls. Buffer 0 contains raw OBV values, Buffer 2 contains buy signals, Buffer 3 contains sell signals, Buffer 4 contains bullish divergences, and Buffer 5 contains bearish divergences.

    Q: Why does the indicator show magenta when I'm on a timeframe where OBV is bearish?

    A: The MTF panel displays the direction of OBV on each selected timeframe, not the main indicator's color. If OBV is falling on that timeframe, it shows BEAR (Magenta). The main OBV line on your current chart follows the 5-state coloring based on slope and acceleration.

    Q: How often does the MTF panel update?

    A: The panel updates based on InpMTFRefreshMins (default 5 minutes). This prevents excessive CPU usage from recalculating on every tick. You can reduce this to 1 minute for more frequent updates or increase to 15-30 minutes for better performance.

    Q: What is the difference between Weak and Strong states?

    A:

    • Strong states (Aqua/Magenta): Slope is moving in direction WITH acceleration (momentum is increasing)

    • Weak states (SteelBlue/DeepPink): Slope is moving in direction BUT acceleration is opposite (momentum is decreasing)

    Weak states often precede reversals while strong states indicate continuation.

    Q: Can I hide the gold midpoint line?

    A: Yes. Set InpShowMidpoint = false in the input parameters.

    Q: Why do I see arrows that don't seem to match price action?

    A: Arrows appear based on OBV behavior, not price alone. A buy arrow (Aqua) appears when OBV transitions from Neutral to Strong Bullish regardless of price. This indicates underlying buying pressure that may not yet be reflected in price.

    Q: What does the divergence score mean?

    A: The score (0-100) indicates confidence in the divergence:

    • 85-100: Excellent quality (strong signals)

    • 70-84: Good quality (valid trades)

    • 60-69: Average quality (use caution)

    • Below 60: Poor quality (filtered out)

    Scores are based on volume, momentum, and bar distance factors.

    Q: How do I know if a divergence is confirmed?

    A: The indicator uses a Price Action Guard: price must move in the divergence direction within PivotRightBars bars after the divergence appears. This confirmation reduces false signals.

    Q: Does this work in Strategy Tester?

    A: Yes. The MTF panel updates on each new bar in the tester (not on every tick) for optimal performance. All signals are generated correctly.

    Q: What is the hysteresis band and why is it important?

    A: The hysteresis band (InpHysteresis) creates a deadzone around neutral that prevents rapid color changes in flat markets. This reduces false signals and whipsaw entries. Higher values (0.20+) work better in ranging markets; lower values (0.10-) work better in trending markets.

      For questions or support:

      • Email: Ebrah.Ssali@Nnanda.com

      • MQL5 Community: Direct messages

      ⚠️ DISCLAIMER

      This indicator is provided "as is" for informational and educational purposes only. Past performance does not guarantee future results. Always backtest thoroughly and demo trade before using with real money. Trading involves substantial risk of loss.

      KEYWORDS

      OBV, On-Balance Volume, Divergence, Momentum, MTF, Multi-Timeframe, Volume Analysis, Trading Indicator, MT5, Technical Analysis, Hidden Divergence, Regular Divergence, Trend Following, Mean Reversion, Professional Trading Tool

      Рекомендуем также
      Market Structure Evaluator MTF Market Structure Evaluator MTF is an institutional-grade price action indicator designed for Smart Money Concepts (SMC) and Market Structure traders. It automatically tracks Market Structure Breaks ( BOS ) and Change of Character ( CHOCH ) in real-time across multiple timeframes, giving you a complete macro-to-micro view of market trend alignment without cluttering your charts or having to analyse other timeframes. Whether you trade manually or build automated tr
      HA Pullback Resume MT5 Systematic Trend Retracement and Momentum Resumption Engine The HA Pullback Resume indicator for MetaTrader 5 provides an objective analytical framework designed to identify high-probability trend-continuation setups following shallow corrective pullbacks. Active intraday traders and scalpers frequently encounter execution timing errors during trend pauses: entering prematurely before a correction completes, suffering stop-outs from erratic boundary wicks during quiet cons
      AURUM MID-QUANT PRO v5.60 Quantitative Excellence for Gold (XAU/USD) & Volatility Trading Gain a professional edge over institutional markets with AURUM MID-QUANT PRO , an advanced Price Action Pattern Detection and Breakout Engine designed exclusively for MetaTrader 5 . Built specifically to capture the unique volatility of Gold (XAU/USD) and other major financial instruments, this powerful indicator combines high-precision algorithmic pattern recognition with real-time dynamic accumulation z
      ICT Institutional Zones Pro — Trade with Institutional Precision Stop wasting time manually drawing key ICT levels every day. ICT Institutional Zones Pro is a professional-grade MT5 indicator built for traders who use ICT (Inner Circle Trader) and Smart Money Concepts (SMC) to read market structure with precision. This indicator automatically maps the most important institutional levels directly on your chart, helping you instantly identify where smart money is likely accumulating, distributing
      Представляем RSIScalperPro - революционный индикатор на основе RSI для MetaTrader 5, специально разработанный для скальпинга на графике одной минуты. С RSIScalperPro у вас будет мощный инструментарий для точных сигналов входа и выхода, чтобы повысить вашу торговую эффективность. RSIScalperPro использует два различных индикатора RSI, которые предоставляют четкие сигналы для уровней перекупленности и перепроданности. Вы можете настроить временные периоды и ограничительные значения двух RSI в соот
      Epic Sails PRO is a clean, session-anchored VWAP indicator designed to provide a clear institutional price framework — not trade signals. It plots a stable VWAP with non-overlapping volatility bands and a real-time VWAP angle (in degrees) to help traders assess directional bias, slope strength, and market state. This tool is ideal for traders who prefer structure, context, and mechanical confirmation over subjective indicators. Key Features Session-anchored VWAP (resets at user-defined session s
      WaveMaster Oscilloscope transforms your MT5 chart into a professional-grade oscilloscope -  a precision instrument that converts market behavior into a live, multi-channel waveform. Instead of guessing what price is "doing," you simply watch it happen in real time. Inspired by the signal-analysis tools used in advanced electronics laboratories, WaveMaster oscilloscope   reads the pulse of the market and renders it as a beautiful, animated waveform directly on your chart. This is not another lin
      FREE
      A ZigZag indicator for MetaTrader 5 that finds swing highs and lows, spots W-bottom and M-top patterns, and gives a BUY or SELL signal when the second leg of a pattern forms at an H1 swing point and price breaks the trendline. 1. Key advantages See the structure at a glance. Clear red ZigZag lines join the major swings, with a down arrow on every swing high and an up arrow on every swing low. Trade with the higher timeframe. On M1, M5 or M15, a signal only appears when the second leg sits on an
      There is a strong correlation between tick volume and real volume.  This is important for 2 reasons: Real volume is a very important indicator because, among many other benefits, it provides strong confirmations of the emergence/dissipation of trends. Real volume is not available in Forex, instead, one has to make do with tick volume. Unfortunately, tick volume is highly broker dependent.  Additionally, it is often not used effectively to define indicators.  Virtually all indicators that use
      Man Trend использует в своей основе процесс выявления скорости изменения роста цены и позволяет найти точки входа и выхода с рынка.  Индикатор был создан на основе оригинальных индикаторов поиска экстремумов, индикатор хорошо подходит для определения разворота или большого резкого рывка в одну из сторон благодаря ему вы будете знать когда такое произойдет он вас уведомит появлением точки синего цвета на покупку красного на продажу. Это фундаментальный технический индикатор, который позволяет
      INSTITUTIONAL STRUCTURE PRO Market Structure + Swings + Fair Value Gaps with SOR Priority Institutional Structure Pro is an advanced market structure indicator based on institutional analysis. The system automatically identifies: Structural highs and lows Structure breakouts (SOR – Structure Override / priority breakout) Bullish and bearish fair value gaps (FVG) Real inefficiency zones with precise rectangles All directly on the chart, with no delay and no repainting. What Does the
      FREE
      The Premium RangeXpert Extension with Multi-Timeframe Trading Signals for Forex, Gold & Bitcoin RangeXpert+ is the premium extension of the well-known RangeXpert — one of the Top-10 free indicators on the market, with over 10,000 downloads and an extremely active community. While the free version delivers precise breakout signals on a single chart, RangeXpert+ provides exactly what professional traders demand: a complete multi-timeframe cockpit directly in your chart, perfectly optimized for h
      Bid Price Timer Indicator — Точность и умный контроль цены! Повышайте точность своей торговли с Bid Price Timer Indicator — мощным инструментом, созданным для трейдеров, которые ценят время, точность и ясность в каждом движении рынка. Ключевые особенности: Фиксированный таймер – Всегда отображается справа на графике (можно настроить X_Offset). Динамическое слежение за ценой – Таймер плавно движется вверх и вниз , следуя за Bid ценой в реальном времени. Автоматическое позицион
      Linear Trend Predictor - Трендовый индикатор сочетающий в себе точки для входа и линии поддержки направления. Работает по принципу пробития ценового канала High/Low. Алгоритм индикатора фильтрует рыночный шум, учитывает волатильность и рыночную динамику. Возможности индикатора Методами сглаживания показывает рыночную тенденцию и точки входа для открытия ордеров BUY или SELL. Подходит для определения краткосрочных и долгосрочных движений рынка, анализируя графики на любых таймфреймах. Адаптивн
      ForeCastX AI — индикатор для MetaTrader 5. На графике отображаются окраска тренда по свингам, стрелки покупки и продажи, зоны спроса и предложения, панель силы покупателей и продавцов по нескольким таймфреймам и необязательная проекция пути. Проекция — визуальная схема по текущей структуре и панели. Это не прогноз цены и не самостоятельный торговый сигнал. На графике Свечи окрашены по текущему свинговому тренду Стрелки при пробое подтвержденного свингового максимума или минимума Прямоугольники с
      Этот индикатор на панели инструментов зоны спроса и предложения с несколькими временными рамками и несколькими символами отправляет предупреждения, когда цена достигает зоны спроса / предложения. Также можно использовать его для предупреждения об обычных двойных вершинах / основаниях вместо зон. Его можно использовать на всех таймфреймах от M1 до MN.       Одновременно на панели управления может отображаться не более 9 таймфреймов.   Можно использовать фильтры RSI, дивергенции (MACD, RSI или Awe
      Anchored VWAP Trading Indicator Struggling to identify true market value and key support/resistance levels? The Anchored VWAP Trading Indicator helps you track price based on real traded volume, giving you a clear edge in your trading decisions. This tool allows you to anchor VWAP from any point on the chart, making it ideal for analyzing trends, reversals, and institutional activity. Key Features Anchored VWAP from any candle Accurate volume-weighted price calculation Works on all symbol
      DRB Dynamic Range Breakout DRB Dynamic Range Breakout — это индикатор для MT5 без перерисовки, разработанный для определения структурированных зон ценовой реакции и формирования подтверждённых сигналов на покупку и продажу. Сигналы подтверждаются только после закрытия свечи. После подтверждения они не перерисовываются, не исчезают и не перемещаются на другую свечу. Для каждого сигнала могут отображаться ориентировочная цена входа, уровень стоп-лосса и до десяти настраиваемых целей по прибыли. Ос
      Relative Volume (RVOL) Indicator See When Volume Really Matters Not all volume is equal. The Relative Volume (RVOL) Indicator helps you quickly identify when the market is experiencing unusually high trading activity compared with its recent average. Instead of simply showing how much volume is trading, RVOL puts current volume into context—making it easier to spot moments when buyers or sellers may be becoming more active. Key Features Identify High-Volume Bullish Moves Quickly spot candles
      Develop this indicator for periods of 30 minutes or more, focus on getting market trends right and making sure they are met. MFOP v8.1 gets straight to the point: it scans the market and tells you exactly when there is enough strength to enter a trade. This indicator doesn't do magic, it uses mathematical algorithms to filter out market noise, not enter into false breakouts and show you clear BUY (blue arrow) and SELL (red arrow) opportunities. It is designed and optimized specifically to take
      CorrelationRadarPRO
      Gabriel Balbino De Oliveira
      Correlation Radar PRO — Профессиональная панель межрыночной корреляции для MetaTrader 5 Краткое описание: Уберите рыночный шум и находите ценовые расхождения за секунды. Correlation Radar PRO рассчитывает историческую, месячную, недельную и текущую корреляцию нескольких активов и позволяет накладывать свечи прямо на текущий график без смены основного символа. Полное описание: Ручное переключение между графиками для поиска межрыночных связей отнимает драгоценное время и приводит к упущенным сделк
      SMC Vision
      Kriangkrai Pongtiwat
      SMC ProVision 2.0 — Professional Smart Money Concept Analysis Stop guessing. Start reading the market like institutions do. SMC ProVision maps the full smart money footprint directly on your chart — with a clean, minimal design that won't clutter your screen. Market Structure — BOS / CHoCH with HH・HL・LH・LL labels Order Blocks — Standard & Refined with mitigation tracking Breaker Blocks — Auto-converted from mitigated OBs Fair Value Gaps — Fill percentage & mitigation status Liquidity —
      FREE
      Sigma VWAP Bands Sigma VWAP Bands (Rolling) is a technical analysis indicator that plots upper and lower bands based on the statistical deviation of price from a rolling Volume-Weighted Average Price (VWAP). The indicator is designed to visualize price dispersion around VWAP using a user-defined lookback window and a configurable standard deviation multiplier. Parameters Lookback Period Number of bars used for VWAP and standard deviation calculations. Sigma Factor Multiplier applied to the cal
      DYNAMIC SR TREND CHANNEL Dynamic SR Trend Channel is a simple indicator for trend detection as well as resistance/support levels on the current timeframe. It shows you areas where to expect possible change in trend direction and trend continuation. It works with any trading system (both price action and other trading system that use indicators) and is also very good for renko charting system as well. In an uptrend, the red line (main line) serves as the support and the blue line serves as the r
      ROC acceleration-deceleration is the manual system for medium-term scalping. Indicator based on custom ROC system which defines bullish/bearish market and especially  acceleration-deceleration of tendention in the market's main direction. Buy arrow is plotted during bearish market when current trend decelerates and sell  arrow is plotted during bullish market when current trend decelerates. Main Indicator's Features Signals are not repaint,non-late or disappear(exept cases when system recalculat
      Fibo Shadow (FISH) – The Precision Entry & Zero Floating Indicator for MT5 Освойте искусство точного трейдинга с Fibo Shadow. Устали гадать, где войти в рынок? Испытываете трудности с широкими стоп-лоссами и пропуском «идеального» входа? Встречайте Fibo Shadow (FISH) — профессиональный индикатор, разработанный для автоматизации поиска точек входа по уровням коррекции Фибоначчи с высокой вероятностью. Fibo Shadow — это не просто очередной инструмент Фибоначчи; это динамический движок Price Action
      Этот индикатор является наиболее распространенным индикатором, который мы используем каждый день, включая наши наиболее часто используемые стратегии, ICT и SMC, лимиты стоп-лоссов и лимиты ликвидности, которые возникают в часы открытия и закрытия бирж, а также объем бирж с Фибоначчи и увеличением и уменьшением масштаба, и наиболее распространенные действия, которые вы хотите видеть, такие как выбор движения биржи, которое вы хотите видеть, и вытягивание Фибоначчи, являются полностью автоматическ
      Modern Spike Indicator Features: 1. Support and Resistance Lines: Displays dynamic horizontal dashed lines on the chart representing current support and resistance levels calculated from recent price swings. 2. Spike Detection Arrows: Shows up arrows (green) for potential upward spikes and down arrows (red) for potential downward spikes, triggered when price breaks S/R levels with RSI confirmation. 3. Trend Analysis: Incorporates ADX (Average Directional Index) to determine market trend stre
      Veltrion Smart Fibonacci   is a clean automatic Fibonacci structure overlay for MetaTrader 5. It automatically detects recent swing highs and swing lows, then draws key Fibonacci retracement levels directly on the chart. The indicator is designed to help traders visualize market structure, retracement zones, and the golden zone without manually drawing Fibonacci tools. Key Features Automatic swing high and swing low detection Clean Fibonacci retracement overlay Horizontal Fibonacci levels for a
      Brilliant Reversals MultiCurrency Scanner MT5 — это современный торговый индикатор, разработанный для трейдеров, стремящихся определить потенциальные точки разворота по нескольким валютным парам. Используя передовые алгоритмы, этот инструмент предоставляет мгновенные аналитические данные, что делает его незаменимым как для новичков, так и для опытных трейдеров, стремящихся оптимизировать свои торговые стратегии. Этот индикатор наделяет трейдеров возможностью получать сигналы на покупку и продажу
      С этим продуктом покупают
      Trend Sniper X
      Sarvarbek Abduvoxobov
      4.9 (42)
      Trend Sniper X — это трендовый индикатор для MetaTrader 5, работающий на нескольких таймфреймах, который помогает трейдерам точно и ясно определять направление тренда и потенциальные точки разворота. для MT4: https://www.mql5.com/en/market/product/193245 Информация о цене: Текущая цена является промо-ценой и может измениться по мере выхода предстоящих обновлений и новых функций. Бонусное предложение: Чтобы получить БЕСПЛАТНЫЙ авто-трейд советник Assistant EA для этого индикатора, пожалуйста, на
      Smart Trend Trading System — MetaTrader 5 После покупки напишите мне на MQL5, чтобы БЕСПЛАТНО получить Smart Universal Expert Advisor, а также доступ к онлайн-курсу, руководство в формате PDF и доступ к закрытой группе. STTS объединяет направление тренда, сигналы входа и выхода, зоны разворота и важные ценовые уровни прямо на графике. Торгуйте по системе вручную или подключите отдельный совместимый советник для автоматического исполнения с выбранными вами настройками. ОДНА СИСТЕМА. ЧЕТЫРЕ ТОРГОВ
      SuperScalp Pro
      Van Minh Nguyen
      4.56 (36)
      SuperScalp Pro - Professional Multi-Layer Confluence Scalping System SuperScalp Pro — это продвинутый индикатор для скальпинга, который улучшает классический Supertrend с помощью нескольких интеллектуальных фильтров подтверждения. Он помогает определять торговые возможности Buy/Sell с более высокой вероятностью, значительно сокращая количество ложных сигналов. Чёткие стрелки Buy и Sell отображаются непосредственно на графике, а уровни Stop Loss и Take Profit на основе ATR автоматически рассчитыв
      M1 SNIPER   — это простая в использовании торговая система. Это стрелочный индикатор, разработанный для тайм фрейма M1. Индикатор можно использовать как отдельную систему для скальпинга на тайм фрейме M1, а также как часть вашей существующей торговой системы. Хотя эта торговая система была разработана специально для торговли на M1, ее можно использовать и с другими тайм фреймами. Первоначально я разработал этот метод для торговли XAUUSD и BTCUSD. Но я считаю этот метод полезным и для торговли на
      Entry Points Pro — топ-1 индикатор по количеству отзывов (600 отзывов и 31 000 скачиваний обеих версий). Индикатор даёт самые перспективные точки входа в сделки без перерисовки на любых инструментах. Индикатор покажет заранее стрелкой точку входа в сделку, укажет цену входа и нарисует на графике уровень входа и стопа, а так же рассчитает рабочий лот под твой депозит и риск, а панель статистики поможет выбрать самый перспективный инструмент и таймфрейм .  Тебе остаётся поставить отложенный ордер
      Adaptive Price Action Engine Купи индикатор — получи советник (EA) к нему бесплатно Самооптимизирующийся мульти-таймфреймовый анализ тренда и свечных моделей Рынок постоянно меняется — и не каждая модель Price Action имеет одинаковую ценность в разных рыночных режимах. Adaptive Price Action Engine создан для адаптации к изменяющимся рыночным условиям, объединяя трендовую структуру, мульти-таймфреймовый анализ, свечные модели и статистическую оптимизацию в единой аналитической системе. Два адапти
      Auto Optimized SpeedAngle — это система векторизации импульса институционального уровня, которая исключает подгонку под исторические данные (curve-fitting) за счет непрерывной форвард-оптимизации (Walk-Forward Optimization, WFO). Вместо того чтобы полагаться на статические входные параметры, которые теряют эффективность при смене рыночных режимов, индикатор динамически перекалибрует свои настройки, используя валидацию на вневыборочных данных (Out-of-Sample, OOS). Это гарантирует, что отображаемы
      Neuro Poseidon - новый индикатор от Дарьи Резуевой. Он сочетает точные торговые сигналы с адаптивными уровнями TP/SL , в результате создавая максимально выгодные сделки! TO SWITCH TO   ENG   PLEASE CHOOSE IT IN THE UPPER-RIGHT CORNER OF THE WEBSITE Напишите мне и получите  Neuro Poseidon Assistant  в подарок для автоматизации вашей торговли! Что отличает его от других индикаторов? 1. Доказанная прибыльность на всех активах и таймфреймах 2. На графике присутствуют только подтвержденные сигналы н
      ARIPoint
      Temirlan Kdyrkhan
      1 (4)
      ARIBot is a powerful trading companion designed to generate high-probability entry signals with dynamic TP/SL/DP levels based on volatility. Built-in performance tracking shows win/loss stats, PP1/PP2 hits, and success rates — all updated live. Key Features: Buy/Sell signals with adaptive volatility bands Real-time TP/SL/DP levels based on ATR Built-in MA Filter with optional ATR/StdDev volatility Performance stats panel (Success, Profit/Loss, PP1/PP2) Alerts via popup, sound, push, or email Cus
      Scalper Vault — это мощная, полноценная торговая система, созданная для трейдеров, которые стремятся к стабильным результатам в внутридневной торговле. Этот высокоточный индикатор представляет собой комплексное, самостоятельное торговое решение, обеспечивающее аналитику профессионального (институционального) уровня как для торговли на рынке Forex, так и для работы с бинарными опционами. Пожалуйста, свяжитесь со мной после покупки, чтобы получить мои торговые советы, а также отличный бонус! Исклю
      Gann Made Easy   - это профессиональная, но при этом очень простая в применении Форекс система, основанная на лучших принципах торговли по методам господина У.Д. Ганна. Индикатор дает точные BUY/SELL сигналы, включающие в себя уровни Stop Loss и Take Profit. ПОЖАЛУЙСТА, СВЯЖИТЕСЬ СО МНОЙ ПОСЛЕ ПОКУПКИ, ЧТОБЫ ПОЛУЧИТЬ ТОРГОВЫЕ ИНСТРУКЦИИ И ОТЛИЧНЫЕ ДОПОЛНИТЕЛЬНЫЕ ИНДИКАТОРЫ БЕСПЛАТНО! Вероятно вы уже не раз слышали о торговли по методам Ганна. Как правило теория Ганна отпугивает от себя не только
      Привет, трейдер! Большинство розничных трейдеров полагаются на запаздывающие веб-скрипты. Для торговли с истинным преимуществом необходима институциональная архитектура. Индикатор Astro AI — это не стандартное наложение графика. Это скомпилированная нейронная сеть с двумя агентами, работающая непосредственно на вашем терминале. Вот точная технология, лежащая в основе системы: 1. Агент 1: Аналитик (Графовые нейронные сети — GNN) Рынки — это не просто изолированные ценовые бары; это взаимосвяз
      Каждый покупатель этого индикатора получает дополнительно Бесплатно: Авторскую утилиту "Bomber Utility", которая автоматически сопровождает каждю торговую операцию, устанавливает уровни Стоп Лосс и Тейк профит и закрывает сделки согласно правилам этой стратегии, Сет-файлы для настройки этого индикатора на различных активах, Сет-файлы для настройки Bomber Utility в режимы: "Минимум Риска", "Взвешенный Риск" и "Стратегия Выжидания", Пошаговый видео-мануал, который поможет вам быстро установить, н
      Entry In The Zone and SMC Multi Timeframe is a real-time market analysis tool based on Smart Money Concepts (SMC), designed to analyze market structure, price direction, and key trading zones. It supports both Single-Timeframe and Multi-Timeframe Analysis, providing a clearer view of overall market structure across multiple timeframes, with real-time BUY / SELL signals designed with a strict focus on No-Repaint principles. The signals are designed to help filter unclear setups and evaluate tradi
      PainX GainX Blue Spike Fusion AI Advanced Synthetic Index Spike Detection Indicator for MetaTrader 5 Discover potential spike setups with a clear, organized, and professional trading interface. PainX GainX Blue Spike Fusion AI is a specialized indicator designed for traders who monitor synthetic indices and want a structured way to observe potential price spike opportunities. The indicator combines signal monitoring, market-condition analysis, visual alerts, and event tracking in one convenient
      Volatility Master for MetaTrader is a real-time dashboard tool that scans up to  50 symbols  to identify high-volatility , trending markets instantly. With bullish/bearish signals, customizable alerts, and a user-friendly interface, it helps you avoid range-bound conditions and focus on high-probability trades. Clarity leads to confidence. Trade confidently and protect your capital effectively with this powerful dashboard. We don't offer free or bonus indicators in exchange of reviews from you.
      Unix Scalper — MetaTrader 5 После покупки напишите мне на MQL5, чтобы БЕСПЛАТНО получить Smart Universal Expert Advisor, а также доступ к онлайн-курсу, руководство в формате PDF и доступ к закрытой группе. Найдите торговую ситуацию. Оцените план. Выберите способ торговли. UNIX Scalper объединяет анализ рынка, решения BUY/SELL/WAIT и уровни Entry, Stop Loss, TP1 и TP2 в одной удобной панели. УВИДЬТЕ СИГНАЛ И ТОРГОВЫЙ ПЛАН • Понятные решения: BUY, SELL или WAIT. • Определённые уровни: Entry, Stop
      Atomic Analyst — MetaTrader 5 После покупки напишите мне на MQL5, чтобы БЕСПЛАТНО получить Smart Universal Expert Advisor, а также доступ к онлайн-курсу, руководство в формате PDF и доступ к закрытой группе. Atomic Analyst объединяет анализ ценового движения, направление тренда, сигналы входа и выхода, уровни Stop Loss и несколько уровней Take Profit прямо на графике. УВИДЬТЕ СИГНАЛ. ОЦЕНИТЕ ТОРГОВУЮ СИТУАЦИЮ. Atomic Analyst представляет результаты анализа в понятном визуальном виде: • Стрелки п
      FiboSniper Pro – Multi-Filter Fibonacci System with Auto SL/TP and Control Panel FiboSniper Pro — это технический индикатор, который объединяет динамические Fibonacci Envelopes с несколькими фильтрами подтверждения для формирования отборных сигналов Buy и Sell. Уровни Fibonacci рассчитываются на основе Moving Average и ATR, а затем фильтруются с помощью ADX, EMA, RSI, ATR, Volume, Time и структуры свечи. Индикатор отображает на графике автоматические уровни Stop Loss и Take Profit на основе ATR,
      Quantum TrendPulse
      Bogdan Ion Puscasu
      5 (26)
      Представляем   Quantum TrendPulse   , совершенный торговый инструмент, который объединяет мощь   SuperTrend   ,   RSI   и   Stochastic   в один комплексный индикатор, чтобы максимизировать ваш торговый потенциал. Разработанный для трейдеров, которые ищут точность и эффективность, этот индикатор помогает вам уверенно определять рыночные тренды, сдвиги импульса и оптимальные точки входа и выхода. Основные характеристики: Интеграция SuperTrend:   легко следуйте преобладающим рыночным тенденциям и п
      Этот индикатор является уникальным, качественным и доступным инструментом для торговли, включающим в себя наши собственные разработки и новую формулу. В обновленной версии появилась возможность отображать зоны двух таймфреймов. Это означает, что вам будут доступны зоны не только на старшем ТФ, а сразу с двух таймфреймов - таймфрейма графика и старшего: отображение вложенных зон. Обновление обязательно понравится всем трейдерам, торгующим по зонам спроса и предложения. Важная информация Для макс
      FX Power: Анализируйте силу валют для более эффективной торговли Обзор FX Power — это ваш незаменимый инструмент для понимания реальной силы валют и золота в любых рыночных условиях. Определяя сильные валюты для покупки и слабые для продажи, FX Power упрощает принятие торговых решений и выявляет высоковероятные возможности. Независимо от того, хотите ли вы следовать за трендами или предсказывать развороты с использованием экстремальных значений дельты, этот инструмент идеально адаптируется под
      Сложно найти и дефицит по частоте, дивергенции являются одним из самых надежных торговых сценариев. Этот индикатор автоматически находит и сканирует регулярные и скрытые расхождения, используя ваш любимый осциллятор. [ Руководство по установке | Руководство по обновлению | Устранение неполадок | FAQ | Все продукты ] Легко торговать Находит регулярные и скрытые расхождения Поддерживает много известных генераторов Реализует торговые сигналы на основе прорывов Отображает подходящие уровни стоп-
      DayTrader PRO DayTrader PRO — это передовой торговый индикатор, сочетающий фильтр Лагерра (Laguerre Filter) Джона Элерса с мощным движком автоматической оптимизации. Вместо использования фиксированных параметров индикатор автоматически подбирает оптимальные настройки на основе недавних рыночных условий, что позволяет адаптироваться к изменяющейся волатильности без необходимости ручной корректировки. Индикатор генерирует четкие сигналы на ПОКУПКУ и ПРОДАЖУ, а также адаптивные уровни Stop Loss и T
      Gartley Hunter Multi - Индикатор для поиска гармонических моделей одовременно на десятках торговых инструментов и на всех возможных ценовых диапазонах. Инструкция/Мануал ( Обязательно читайте перед приобретением ) | Версия для МТ4 Преимущества 1. Паттерны: Гартли, Бабочка, Акула, Краб. Летучая мышь, Альтернативная летучая мышь, Глубокий краб, Cypher 2. Одновременный поиск паттернов на десятках торговых инструментов и на всех возможных таймфреймах 3. Поиск паттернов всех возможных размеров. От са
      FX Trend NG: Следующее поколение интеллектуального анализа трендов на разных рынках Обзор FX Trend NG — это профессиональный инструмент анализа трендов и мониторинга рынка с поддержкой нескольких таймфреймов. Он позволяет за секунды получить полное структурное понимание текущего состояния рынка. Вместо переключения между десятками графиков вы мгновенно видите, какие инструменты находятся в тренде, где импульс ослабевает и где наблюдается сильная синхронизация между таймфреймами. Специальное пр
      Лучшее решение для новичка или трейдера-эксперта! Этот индикатор является уникальным, высококачественным и доступным торговым инструментом, поскольку мы включили в него ряд собственных функций и новую формулу. С помощью всего лишь ОДНОГО графика вы можете определить силу валюты для 28 пар Форекс! Представьте, как улучшится ваша торговля, потому что вы сможете точно определить точку запуска нового тренда или возможность скальпирования? Руководство пользователя:   нажмите здесь Это первый, ори
      Лучшее решение для новичка или трейдера-эксперта! Этот индикатор является уникальным, высококачественным и доступным торговым инструментом, поскольку мы включили в него ряд собственных функций и секретную формулу. Всего на ОДНОМ графике он выдает алерты по всем 28 валютным парам. Представьте, как улучшится ваша торговля, ведь вы сможете точно определить точку запуска нового тренда или возможность скальпирования! Построенный на новых базовых алгоритмах, он позволяет еще проще определять и подт
      TREND LINES PRO   помогает понять, где рынок действительно меняет направление. Индикатор показывает реальные развороты тренда и места, где крупные участники входят повторно. Вы видите   BOS-линии   смены тренда и ключевые уровни старших таймфреймов — без сложных настроек и лишнего шума. Сигналы не перерисовываются и остаются на графике после закрытия бара. VERSION MT 4     -     Раскрывает свой максимальный потенциал в связке с индикатором  RFI LEVELS PRO Что показывает индикатор: Реальные смен
      M1 Quantum MT5
      Hamed Dehgani
      4.2 (10)
      Торговые сигналы в реальном времени с использованием M1 Quantum: Сигнал  (Сделка выполнена автоматически с помощью Quantum Trade Assistant , бесплатно включённого в этот продукт.) Последние новости : Выпущена версия 1.64. Теперь для всех сделок Stop Loss размещается за соответствующими зонами поддержки/сопротивления. Функция Smart Close также была улучшена для повышения производительности EA в этой версии. С 9 августа live-сигнал работает на версии 1.64. План цен: Текущая цена: $169 (Предложени
      Другие продукты этого автора
      Cumulative Volume Delta (CVD) MA-X Plus: Совершенная система анализа ордер-флоу Раскройте скрытые механизмы рынка с помощью CVD MA-X Plus. В то время как стандартные индикаторы объема показывают лишь количество проторгованных контрактов, CVD MA-X Plus отвечает на вопросы: Кто побеждает в битве? Когда происходит перелом? И где зафиксированы позиции «умных денег»? Агрегируя тиковую активность (с возможностью переключения на Реальный объем для регулируемых рынков, таких как акции, фьючерсы и золото
      The Ultimate Ichimoku MTF Dashboard: Your All-In-One Trading Edge Transform Your Trading with One Powerful Indicator Imagine having a professional trading assistant that monitors multiple timeframes simultaneously, identifies high-probability entries, warns you of potential reversals, and provides clear risk management guidance-all in one clean, intuitive display. That's exactly what the Ichimoku MTF Dashboard delivers.     Why This Isn't Just Another In
      MTF Connecting Fractals Multi-Timeframe Market Structure. One Glance. Real Decisions. MTF Connecting Fractals is not just another arrow-printing indicator. It’s a complete multi-timeframe market structure intelligence system designed to answer the most important trading questions in real time - clearly, visually, and without clutter. Built around fractals as objective structure anchors, this tool gives traders a decisive edge by combining price action, structural context, proximity risk, and
      QQE Kalman Hybrid  Smarter Trend Detection. Faster Entries. Cleaner Decisions. QQE Kalman Hybrid is built to help you act on what’s happening now. This momentum and trend confirmation indicator combines the proven structure of classic QQE logic with a modern Kalman adaptive engine designed to reduce lag, smooth noise, and surface high-quality trade opportunities earlier. The result is a clean, decision-focused tool that helps traders identify:  What’s the trend structure?  Where’s the best
      FREE
      Critical Market Session Information with a Single Glance Stop juggling multiple tools and squinting at time zone converters. The SessionInfoDisplay Indicator is your new, indispensable trading co-pilot that puts real-time market intelligence directly on your chart.   What It Does: Your Essential Trading Dashboard   This intelligent indicator provides three critical pieces of information at a glance: 1. Real-Time Session Detection    - Automatically identifies which major financial session is act
      FREE
      Clr-Dynamic RSI v SMA Indicator : A Comprehensive Analysis of Features and Advantages The Clr-Dynamic RSI v SMA indicator represents a significant evolutionary leap in technical analysis tools, transforming the classic Relative Strength Index (RSI) from a potentially ambiguous oscillator into a sophisticated, multi-dimensional trading system. At its core, this indicator retains the mathematical foundation of the RSI, measuring the speed and change of price movements, but radically enhances its
      MTF Candlestick Patterns Detector: Ваш ультимативный командный центр Price Action В динамичном мире трейдинга пропуск одного паттерна разворота может стать гранью между прибыльной неделей и упущенной выгодой. MTF Candlestick Patterns Detector — это профессиональный индикатор для MQL5, разработанный для одновременного сканирования, обнаружения и агрегации более 24 легендарных свечных паттернов на всех таймфреймах. Хватит охотиться за графиками и гадать. Позвольте алгоритму самому находить для ва
      MTF VWAP Indicator - Quick Overview   This indicator shows you where institutional money is flowing across multiple timeframes using Volume Weighted Average Price (VWAP) to identify high-probability trading zones. New version has VWAP bands plotting capability if user enabled and display panel (whose background changes colour on confluence) can be toggled on/off.      What It Actually Does:     1. Tracks Smart Money Levels: - Shows Daily, Weekly, and Monthly VWAP lines where big players (banks,
      Indicator Overview This is a sophisticated Multi-Timeframe (MTF) indicator that not only applies the classic Fisher Transform formula but integrates it into a comprehensive trading system featuring a real-time dashboard. The indicator excels at pinpointing reversals through advanced divergence detection and providing a clear, multi-timeframe view of market structure.     How It Works: Core Fisher Logic   1.   Normalization and Signal Generation         The indicator transforms price (using med
      MTF WAD Simplified Indicator - Professional Trading Solution     Overview The MTF WAD Simplified is a sophisticated multi-timeframe volume-based indicator designed to track smart money flow across financial markets. By monitoring the Williams Accumulation/Distribution (WAD) across 8 different timeframes, this tool provides traders with unprecedented insight into institutional accumulation and distribution patterns.     Core Benefits for Traders     1. Smart Money Tracking - Detect Institutional
      RSI v SMA MTF Indicator : Professional Trading Edge in One Tool   Summary The RSI v SMA MTF Indicator is a sophisticated, multi-timeframe momentum analysis tool that transforms the traditional RSI into a powerful, actionable trading system. By combining RSI slope analysis with SMA crossover signals, divergence detection, and real-time multi-timeframe confluence, this indicator provides traders with a more comprehensive view of market momentum across all relevant timeframes.     Core Utility an
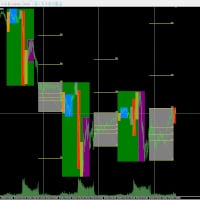
      Cumulative Volume Delta MA-X MTF (с градиентным импульсом) Этот индикатор выполняет мультитаймфреймовый анализ кумулятивной дельты объема (CVD) для платформы MetaTrader 5. Он рассчитывает чистую разницу между давлением покупателей и продавцов, анализируя тиковые данные или реальный объем, что позволяет визуально оценить настроения потока ордеров. Логика и функции индикатора Индикатор использует математический подход к анализу объема: Источники данных: Поддержка как реального объема ( Real Volum
      Cumulative Volume Delta (CVD) MA-X: Интеллектуальный инструмент анализа сентимента ордер-флоу Раскройте скрытые механизмы рынка с помощью Cumulative Volume Delta (CVD) MA-X . В то время как стандартные индикаторы объема показывают только сколько было проторговано, CVD MA-X говорит вам, КТО побеждает в битве между покупателями и продавцами и КОГДА . Агрегируя тиковую ценовую активность и распределение объема, этот индикатор предоставляет кристально чистую карту рыночных убеждений и истощения. П
      Multi-Timeframe Money Flow Index (MTF MFI) with Smart Divergence and Dashboard Unlock the flow of institutional money across every timeframe. Are you tired of guessing the trend only to be trapped by a sudden reversal? The Multi-Timeframe Money Flow Index (MTF MFI) is a professional-grade trading tool designed to provide a bird's-eye view of market liquidity and momentum. By aggregating volume-weighted data from W1 down to M1, this indicator eliminates noise and highlights high-probability tra

      MTF Parabolic SAR Maximize your trading efficiency with the Multi-Timeframe Parabolic SAR Trend and Momentum Dashboard. Designed for serious traders who value clarity over clutter, this tool aggregates price action across six timeframes into a single, sleek visual interface.  By combining that reliable classic Parabolic SAR logic with advanced momentum scoring and risk assessment, this indicator transforms raw data into actionable trade signals.  The Strategic Edge: Why This Indicator? Most tra
      Multi-Timeframe Heiken Ashi (Smoothed with Dashboard) Professional Market Structure Visualization with Weighted Confluence Scoring Transform your trading with crystal-clear multi-timeframe analysis. This indicator combines smoothed Heiken Ashi candles with an intelligent weighted scoring system to give you unprecedented clarity in any market condition. YOUR TRADING QUESTIONS – ANSWERED INSTANTLY: 1. What's the REAL trend direction? Dashboard Reveals:   Higher timeframe (MN1, W1, D1, H4) trend a
      Hybrid BB-LRMA [Trend and Volatility Engine]   Master the markets with the Hybrid BB-LRMA, a professional-grade technical analysis tool that fuses the volatility-tracking power of Bollinger Bands (BB) with the hyper-responsive Linear Regression Moving Average (LRMA) to eliminate lag and pinpoint high-probability entries with arrow Signals   Why Hybrid BB-LRMA? Most moving averages are too slow, and Bollinger Bands alone can be noisy. The Hybrid BB-LRMA solves this by using a gradient-based LRMA
      Hybrid FATL Fractal: Professional Digital-Signal Logic   Simplify the Complexity of Market Structure.   Unlock the power of digital signal processing combined with price action geometry. The Hybrid FATL Fractal is a professional-grade technical analysis tool designed to eliminate market noise and pinpoint high-probability institutional turning points. By merging the Fast Adaptive Trend Line (FATL) algorithm with Dynamic Fractal Breakout logic, this indicator provides a dual-layered filter that a
      VOLUME PROFILE SAF-XII Профессиональный анализ профиля рынка для MT5 (идеальный индикатор для сеточных трейдеров) ЧТО ТАКОЕ ПРОФИЛЬ ОБЪЕМА (VOLUME PROFILE)? Профиль объема — это профессиональный институциональный инструмент, который отображает торговую активность на определенных ценовых уровнях, в отличие от традиционных индикаторов объема, показывающих объем во времени. Он показывает, ГДЕ происходила торговля в выбранном вами окне, помогая определить: ЗОНЫ СПРАВЕДЛИВОЙ СТОИМОСТИ (VAH/VAL) — це
      Fisher Transform MTF Pro v4.03 Professional Multi-Timeframe Trading Decision System Fisher Transform MTF Pro turns complex multi-timeframe data into clear, actionable trade decisions in seconds. It answers instantly:  What’s the trend?  Where’s the entry?  How strong is the setup?  What are the risks?  Should I buy, sell, or wait?  The Edge   Zero-Line Filter (Trend Protection) Prevents counter-trend trades by default:  No buys above zero  No sells below zero This forces alignment with th
      Turtles Professional v2.0 The Legendary Turtle Strategy, Reimagined for the Modern Trader Turtles Pro transforms the iconic 1980s Turtle Trading System into a high-performance, multi-timeframe decision engine. It eliminates guesswork by providing institutional-grade analysis on trend structure, entry quality, and volatility all on a single chart. The Strategic Edge Turtles Professional uses a Smart Weighted Bias Engine to prioritize higher time frames, ensuring your trades align with the d
      Hybrid Hull-LSMA : The Trend Meets Momentum Powerhouse Are you struggling with moving averages that are either too slow to react or too noisy to trust? The Hybrid Hull-LSMA is a solution, engineered to solve the "lag vs. noise" dilemma. By fusing the ultra-smooth Hull Moving Average (HMA) with the predictive Least Squares Moving Average (LSMA), this indicator delivers a high-definition view of market structure and entry timing. Why the Hybrid Hull-LSMA? Standard indicators follow the market; t
      T3 MTF PureMaths : Мультитаймфреймовый индикатор Tillson T3 Торговая система с нулевым запаздыванием, логикой конфлюэнции и интерактивной панелью Преимущество мультитаймфреймовой торговли T3 MTF Pure PureMaths — это профессиональная торговая панель, которая агрегирует рыночную структуру сразу по 8 таймфреймам (от месячного до 5-минутного). Вы получаете мгновенные и точные данные без необходимости переключать графики или производить расчеты в уме. Построенный на чистой математической оптимизации
      Divergent Fisher Transform MT5  Precision Momentum. Intelligent Filtering. EA-Ready Automation. The Divergent Fisher Transform for MT5 is a professional-grade momentum trading indicator designed to help traders answer the most important question in the market: “What should I do right now?” It transforms raw price into high-probability, structured trading decisions using a powerful combination of:  Fisher Transform momentum modeling  Zero-line structural filtering  Multi-level overbought/o
      Divergent Stochastic Filter II Catch Reversals Early, Filter Noise, Trade with Confidence The Edge: Why This Stochastic is Different  Every trader knows the Stochastic oscillator. But knowing when to trust its signals, that's the real challenge. The Divergent Stochastic Filter II transforms this classic indicator into a precision reversal detection system by adding critical elements: divergence intelligence, signal filtering and exhaustion detection.  While standard Stochastic oscillators fire s
      Hybrid FATL-LRMA : Digital Precision Meets Statistical Certainty The Ultimate Trend-Momentum Convergence System with clear action protocols. Why Hybrid FATL-LRMA? The Edge some Traders Miss Are you tired of lagging indicators that signal entries after the move has already happened? Frustrated by noisy oscillators that keep you in chop while trends pass you by? The Hybrid FATL-LRMA is a dual-engine trading system that bridges the gap between high-frequency digital signal processing and stat
      ADX ClrDynamic Slope-Aware, Low-Lag Trend & Momentum Engine Tired of lagging indicators that signal a trend only after the move is over? Traditional ADX calculations are often too slow for modern market volatility. ADX ClrDynamic bridges this gap by combining customizable low-lag smoothing algorithms (EMA, SMA, Wilder, or Hull Acceleration) with slope-aware momentum logic, giving you a lean, high-precision decision engine for timing trend entries and exits. Key Trading Questions Answered What is
      ADX ClrDynamicPro Plus III Multi-Timeframe Trend, Momentum & Divergence Command Center Tired of lagging indicators that signal a trend only after the move is over? ADX ClrDynamicPro Plus III is a complete decision engine for trend, momentum, and reversal traders. By combining customizable smoothing algorithms (EMA, SMA, Wilder, or optional Hull Acceleration) with multi-timeframe (HTF) confirmation, institutional divergence detection, and an embedded subwindow dashboard, this tool delivers clear,
      SERA - Sigma-Enhanced Regression Analysis – The Non-Repaint, Early-Entry MTF Trading System The Problem with Most Regression Tools (And How We Solved It) Traditional regression indicators lie to you. They repaint, they lag, and distort actionable data. Their flaws cost you in false back-tests, late entries/exits and therefore missed profits. Avoid catching a falling knife or chasing a train with SERA, she eliminates ALL three problems. One-Click Trading Style Selection – Choose Conservative, R
      Оптимизированная логика трехцветных полос (Tri-Color Band Logic) приоритизирует видимость ценового действия, сохраняя при этом функцию обнаружения консолидации (Squeeze). 1. Переключатель философии: Торгуйте по-своему Настройка SignalMode позволяет выбрать, как индикатор интерпретирует касания полос. Это отражение вашего торгового стиля: Когда цена касается... Режим BREAKOUT (Трендовик) Режим BOUNCE (Охотник за разворотами) Режим AUTO (Универсал) Верхней полосы BUY – «Импульс ускоряется, вхо
      Фильтр:
      Нет отзывов
      Ответ на отзыв