Bollinger Market Structure and Trend Intelligence

BOLLINGER MARKET & TREND INTELLIGENCE — MT5 Edition

STOP GUESSING WHICH BREAKOUTS ARE REAL.

Most Bollinger breakouts fail. This engine tells you which ones won't — before you risk a single dollar.

You get a quality score, a volatility percentile, and a post-breakout efficiency reading. All locked on bar close. No repainting. No guessing.

The market gives you maybe three clean breakouts a week. This tool makes sure you catch them — and helps you avoid the twelve that would have stopped you out.

THE PROBLEM

You've been here before.

It's 2 AM. You're staring at a chart. Price just closed outside the upper Bollinger Band. Your heart rate jumps. You enter long.

Three candles later, price is back inside the band. Then it collapses. Your stop gets hit. You're left staring at a "confirmed" breakout that reversed the moment you clicked buy.

You tell yourself: "I should have waited for a retest."

But when you wait for retests, the market runs without you. You watch a 200-pip move from the sidelines because you were "being patient."

So you try adding filters. An RSI here. A MACD there. An ADX overlay. Now your chart looks like a Christmas tree. Twelve indicators. Six conflicting signals. And you still don't know if the breakout is real.

The problem isn't your discipline. It isn't your strategy.

The problem is that your tools don't measure what actually matters.

They don't tell you if volatility was compressed before the breakout. They don't score the breakout candle's body and close position. They don't measure post-breakout directional efficiency. They don't distinguish between a genuine channel violation and a liquidity sweep.

What if you could see all of that — in one panel — and make a decision in under three seconds?

THE REVELATION

Bollinger Market & Trend Intelligence is a complete analytical engine for MT5 that transforms raw Bollinger Bands into a multi-dimensional decision system.

Its core promise is simple: Know whether a breakout is worth trading — before you enter.

Here's the fundamental insight that separates this from every other Bollinger indicator on the marketplace:

Most tools evaluate the breakout bar using the current Bollinger Bands — which means the breakout bar itself moves the band it's supposedly breaking. That's circular logic. That's why so many signals repaint or fail.

This engine reads the completed Bollinger Bands from the bar strictly before the evaluated bar. The breakout tests a fixed, pre-existing threshold. It cannot move its own goalpost. The band is locked. The signal is honest.

Think of it as a lie detector for breakouts. Price can scream "I'm breaking out!" — but this engine checks the volatility context, the candle quality, the follow-through, and the efficiency of the move. If the story doesn't hold up, it tells you.

No repainting. No circular logic. No false confidence.

THE DASHBOARD — YOUR ENTIRE MARKET IN ONE GLANCE

When you attach this indicator to your MT5 chart, a clean, color-coded command center appears in the corner you choose. It's designed for dark-themed charts — high contrast, no eye strain, no clutter.

The dashboard is organized into five logical panels. Each panel answers a specific question you're already asking.

Top-left: MARKET STATE. What is volatility doing right now? You see the state — from EXTREME COMPRESSION to EXTREME EXPANSION — in a color-coded readout. Below it, the width percentile tells you exactly where current volatility sits relative to the last 100 bars. The Width/ATR ratio normalizes across symbols and timeframes. Velocity and acceleration show whether volatility is speeding up or slowing down. The "Interpretation" line translates it all into plain English: "Extreme compression releasing strongly" or "Expansion decelerating."

Top-middle: GENERAL TREND. What is the broader structure doing? You get direction, strength score (0-100), state (STRONG UPTREND to STRONG DOWNTREND), confidence level, market structure (HH + HL, LH + LL, etc.), momentum with ADX reading, persistence percentage, and phase (ESTABLISHED UPTREND, TREND DEVELOPING, TREND WEAKENING, etc.). The "Environment" line tells you if the trend is happening under compression or expansion.

Top-right: CURRENT TREND. What is the recent pressure doing? Same comprehensive readout — but over a shorter lookback. This is where you see if the current pressure aligns with or contradicts the broader trend. The "Pressure" insight tells you if momentum is building, fading, or absent.

Bottom-left: BREAKOUT INTELLIGENCE. This is the heart of the system. You see the direction of the most recent breakout, how many bars ago it occurred, its status (BREAKOUT, VALID, RETESTED, FALSE BREAKOUT, SWEPT, BULLISH CONTINUATION, etc.), its quality score (MARGINAL to EXCELLENT), the breakout candle type (STRONG BULLISH, BEARISH, etc.), body percentage, close position percentage, distance from the channel in ATR multiples, and your current price position within the channel. The "Signal" insight condenses it all into one actionable line.

Bottom-right: POST-BREAKOUT. What happened after the breakout? This panel measures the actual follow-through. You see the post-breakout state (BULLISH, BEARISH, RANGING), momentum, progression (HIGHER, LOWER CHANNEL, SIDEWAYS), bars analyzed, bullish movement in points, bearish movement in points, net change, efficiency percentage, and the bull/bear/range bar distribution.

Bottom: FINAL ASSESSMENT. The system synthesizes everything into a final deduction paragraph. It tells you the relationship between general and current trend, the market environment, and what to watch for next. A large, color-coded FINAL BIAS badge gives you the bottom line: BULLISH, BEARISH, EMERGING BULLISH, BULLISH STRUCTURE / CORRECTION, etc. — with a LONG/SHORT/NEUTRAL tag and the current volatility state.

Every panel uses a carefully chosen ultraviolet palette — indigo, plum, bronze — that stands out on dark charts without being garish. Bullish readings glow lime green. Bearish readings burn tomato red. Warning states flash gold. You understand the entire market in under three seconds.

THE ENGINE ROOM — WHAT'S ACTUALLY UNDER THE HOOD

This isn't a simple Bollinger Bands plot with some arrows. It's a seven-phase analytical engine. Here's what each phase does — and why it matters to your bottom line.

PHASE 1: THE FIXED THRESHOLD

What it does: Reads the completed Bollinger Bands from the bar before the evaluated bar. The breakout bar tests a fixed, pre-existing band.

Why it matters to you: This is the single most important architectural decision in the entire indicator. It eliminates the circular logic that causes repainting and false signals in almost every other Bollinger breakout tool.

Without it: You'd be trading breakouts that only exist because the breakout bar itself moved the band. That's not a signal. That's a mirage.

PHASE 2: THE VOLATILITY ENGINE

What it does: Calculates Bollinger Band width, normalizes it against ATR, then computes a percentile rank over your chosen lookback (default: 100 bars). It also calculates width velocity (how fast width is changing) and acceleration (how fast velocity is changing). A hysteresis mechanism prevents state-flipping when readings hover near thresholds.

Why it matters to you: Volatility context is everything. A breakout from EXTREME COMPRESSION is a different animal than a breakout from EXTREME EXPANSION. This engine tells you which one you're looking at — and whether the compression is deepening, holding, or releasing.

Without it: You'd treat every breakout the same. You'd enter breakouts from exhausted expansion moves and wonder why they fail.

PHASE 3: THE PERSISTENT BREAKOUT ENGINE

What it does: Scans up to 3,000 bars (configurable) to find the most recent qualifying breakout. Stores it persistently with absolute bar indexing. Tracks whether it's been confirmed (price held outside the channel for N bars), retired (price returned inside for N bars), or aged out.

Why it matters to you: You always see the most recent breakout — even if it happened 200 bars ago. The engine remembers. You don't have to scroll back or wonder.

Without it: You'd miss the context of the last breakout. You'd see a new signal without knowing how the previous one resolved.

PHASE 4: BREAKOUT INTELLIGENCE

What it does: Scores the breakout candle itself. Measures body percentage (how much of the candle's range is body vs. wick) and close position (where the close sits within the range). Classifies the candle as STRONG BULLISH, STRONG BEARISH, BULLISH, BEARISH, or NEUTRAL. Also calculates the breakout distance from the channel in ATR multiples.

Why it matters to you: A breakout with a 70% body and a close at the extreme high is a different signal than a breakout with a 20% body and a long upper wick. This engine distinguishes them. The quality score (MARGINAL to EXCELLENT) synthesizes candle quality, distance, and confirmation into one readable metric.

Without it: You'd treat a weak, wicky breakout the same as a strong, decisive one. You'd get chopped up.

PHASE 5: TREND & STRUCTURE SCORING

What it does: Runs two independent trend assessments — General Trend (default: 50-bar lookback) and Current Trend (default: 20-bar lookback). Each assessment combines EMA alignment (fast vs. slow), EMA slope normalized by ATR, ADX with directional indicators, market structure (higher highs/lows vs. lower highs/lows), and persistence (percentage of bars closing above/below the fast EMA). The result is a 0-100 score, a direction, a state (STRONG UPTREND to STRONG DOWNTREND), a confidence level, a momentum reading, a phase, and a structure classification.

Why it matters to you: You see both the forest and the trees. The General Trend tells you the broader context. The Current Trend tells you what's happening right now. When they align, you have conviction. When they diverge, you have a correction or a developing reversal.

Without it: You'd trade breakouts without knowing if they're with or against the broader trend. You'd fight the market.

PHASE 6: BREAKOUT VALIDATION

What it does: After a breakout is stored, the engine tracks every subsequent bar. It detects:

  • Confirmation: Price held outside the channel for N bars (default: 1).

  • Retest: Price returned to within 0.25 ATR of the channel and held.

  • False breakout: Price closed back inside the channel.

  • Sweep: A wick exceeded the channel by 35%+ of the candle's range, then reversed.

Why it matters to you: Most breakouts fail. This engine tells you how they fail — and whether the failure is a clean rejection (false breakout) or a liquidity grab (sweep). That distinction changes how you manage your trade.

Without it: You'd see a breakout, enter, and get stopped out without understanding why. You'd never learn to distinguish between a genuine failure and a stop hunt.

PHASE 7: DASHBOARD & ALERTS

What it does: Renders the entire analytical output as a clean, color-coded dashboard. Optional alerts notify you when a new breakout is detected, with the direction, status, post-breakout state, and net change.

Why it matters to you: You don't have to interpret raw numbers. The dashboard tells you what matters. The alerts keep you informed without staring at the screen.

Without it: You'd have to manually check every symbol and timeframe. You'd miss breakouts while looking elsewhere.

THE PROOF STACK

No repainting. Every signal is locked on bar close. The breakout bar cannot move its own threshold. What you see in history is what you would have seen in real time.

Works on any timeframe, any symbol, any account type. Forex, indices, crypto, commodities. M1 to MN. The ATR normalization ensures the readings are comparable across instruments.

Zero external dependencies. No DLLs. No web requests. No third-party libraries. Everything runs inside MT5.

Built-in hysteresis. The volatility state machine uses a 3% hysteresis band to prevent state-flipping when readings hover near thresholds. You won't see "COMPRESSION" and "BALANCED" alternating every bar.

ATR normalization throughout. Width/ATR ratio, breakout distance in ATR, retest distance in ATR, EMA slope in ATR — every metric that could be distorted by symbol volatility is normalized.

Persistent breakout tracking. The engine scans up to 3,000 bars to find the most recent breakout. It stores it with absolute bar indexing and tracks its lifecycle. You always have context.

Configurable everything. Over 40 parameters organized into logical groups. Defaults are optimized out of the box. Tweak only if you want to match your specific style.

Optional alerts. Popup notifications and sound alerts when a new breakout is detected. Primed on attachment so historical events don't trigger false notifications.

Breakout chart label. A text label appears on the chart at the breakout bar, showing direction and status. Optional — you can turn it off.

MT5 native. Built specifically for MetaTrader 5 — not a ported MT4 version. Uses the full MT5 indicator architecture.

USE CASES — WHEN THIS ENGINE EARNS ITS KEEP

The Compression Coil. The market has been ranging for three days. The MARKET STATE panel flashes "EXTREME COMPRESSION" with positive acceleration. The GENERAL TREND panel shows a bullish structure. The CURRENT TREND panel shows neutral pressure. You know a violent move is loading. The BREAKOUT INTELLIGENCE panel tells you the moment it fires — and whether the breakout candle is strong or weak. You enter with confidence because you saw the coil before the spring.

The Failed Breakout Avoidance. Price closes above the upper band. Your old self would have entered immediately. But the BREAKOUT INTELLIGENCE panel shows "WEAK" quality — the candle has a 25% body and a long upper wick. The POST-BREAKOUT panel shows "RANGING" with 40% efficiency. You stay flat. Two bars later, the status flips to "FALSE BREAKOUT." You saved yourself a stop-out.

The Retest Entry. Price breaks out bullishly. The status reads "BREAKOUT" — not yet confirmed. You wait. Two bars later, price pulls back to within 0.25 ATR of the channel. The status flips to "RETESTED." The POST-BREAKOUT panel shows "BULLISH" with 80% efficiency. You enter on the retest with a tight stop just below the channel. This is the highest-probability entry — and the engine told you exactly when it happened.

The Sweep Reversal. Price spikes below the lower band, then closes back inside. The status reads "SWEPT." The BREAKOUT INTELLIGENCE panel shows a bearish direction, but the POST-BREAKOUT panel shows "BULLISH" progression. You recognize this as a liquidity grab — a stop hunt. You enter long against the sweep, targeting the upper channel. The engine gave you the confidence to take the other side of the trap.

The Trend Alignment Entry. The GENERAL TREND panel shows "BULLISH | STRONG UPTREND." The CURRENT TREND panel shows "BULLISH | ESTABLISHED UPTREND." The MARKET STATE panel shows "BALANCED" volatility. The FINAL BIAS badge reads "BULLISH" with a "LONG" tag. Price breaks out bullishly. The breakout quality reads "EXCELLENT." This is the highest-conviction setup the engine can produce. You size up.

The Divergence Warning. The GENERAL TREND panel shows "BULLISH." The CURRENT TREND panel shows "BEARISH." The FINAL ASSESSMENT paragraph reads: "The broader structure is bullish, but the current trend has turned bearish. This indicates an active correction or developing reversal." You're holding a long position. You tighten your stop. The engine warned you before the reversal became obvious.

THE WORKFLOW — FROM CHART OPEN TO TRADE DECISION

Step 1: Attach the indicator. Drag it onto your MT5 chart. The dashboard appears in your chosen corner. The engine begins analyzing on the next bar open.

Step 2: Read the FINAL BIAS badge. This is your bottom line. BULLISH, BEARISH, or something more nuanced. It takes one second.

Step 3: Check the MARKET STATE panel. Is volatility compressed, balanced, or expanded? Is it accelerating or decelerating? This tells you what kind of move to expect.

Step 4: Check the BREAKOUT INTELLIGENCE panel. Is there an active breakout? What's its status? Its quality? Its distance from the channel? If there's no breakout, you wait.

Step 5: Check the POST-BREAKOUT panel. If there's an active breakout, what's the follow-through? Is it bullish, bearish, or ranging? What's the efficiency? This tells you if the breakout has legs.

Step 6: Make your decision. If the bias aligns with the breakout direction, the quality is strong, and the post-breakout response is efficient — you have a trade. If not, you wait. The engine gives you the confidence to act — or the discipline to stay flat.

Total time: under 30 seconds. No math. No cross-referencing. No guesswork.

PARAMETER OVERVIEW — SIMPLE, LOGICAL, FORGIVING

All parameters are organized into seven groups. Defaults are optimized out of the box. You can trade this indicator for months without changing a single setting. But if you want to tune it to your style, here's what each group controls.

Phase 1 — Bollinger. The core band settings. Period (default: 20), standard deviations (default: 2.0). Adjust these if you want faster or slower bands.

Phase 2 — Volatility. The width lookback (default: 100), ATR period (default: 14), velocity and acceleration bars (default: 3 each), width smoothing (default: 3), and the percentile thresholds for compression and expansion states. The hysteresis setting (default: 3%) prevents state-flipping.

Phase 3 — Breakout. Minimum breakout distance in ATR (default: 0.05), strong breakout threshold (default: 0.50), confirmation bars (default: 1), retirement rules, and scan lookback (default: 3,000 bars). Keep Last Breakout Visible (default: true) ensures the most recent event stays in the panels even after it ages out.

Phase 4 — Intelligence. Strong body percentage (default: 60%), strong close percentage (default: 75%), ranging move threshold (default: 0.10 ATR), directional majority (default: 60%), and directional efficiency (default: 50%). These control how the engine scores breakout candles and post-breakout movement.

Phase 5 — Trend. General trend lookback (default: 50), current trend lookback (default: 20), slope lookback (default: 10), neutral slope threshold (default: 0.02 ATR), ADX period (default: 14), fast EMA (default: 20), slow EMA (default: 50), and ADX thresholds for trend and strong trend (default: 20 and 30).

Phase 6 — Validation. Retest ATR distance (default: 0.25) and sweep wick percentage (default: 35%). These control how the engine detects retests and liquidity sweeps.

Phase 7 — Dashboard. Show/hide dashboard, corner placement, panel width, font size, offsets, insight wrap characters, breakout label visibility, and alert enable/disable.

Default settings are optimized out of the box. Tweak only if you want to match your specific style.

THE UPGRADE PATH — FOR TRADERS WHO WANT TO GO FURTHER

Bollinger Market & Trend Intelligence is a complete standalone system. But for you — if you want to go further — it pairs naturally with complementary tools.

If you trade breakouts across multiple symbols, consider adding a multi-symbol scanner to your workflow. It alerts you when any symbol on your watchlist enters EXTREME COMPRESSION — so you can focus on the charts that matter.

If you want to automate your breakout entries, consider a trade management EA that can read the indicator's output and execute with predefined risk parameters. The engine's non-repainting signals make it suitable for automation.

These are not required. They are simply the next logical step for you if you want to build a complete ecosystem around this analytical core.

THE CLOSE — WHAT YOU DO NEXT

You've seen what this engine does.

It reads the completed Bollinger Bands from the bar before the breakout — so the breakout bar can't move its own threshold. It scores volatility context, candle quality, post-breakout efficiency, and trend alignment. It tells you whether a breakout is worth trading — before you risk a single dollar.

And when you buy, you don't just get the indicator.

You get the complete user guide — free.

Every panel explained. Every reading decoded. Every parameter documented. Plus worked examples showing you exactly how to read the dashboard in live market conditions.

You'll know what "EXTREME COMPRESSION releasing strongly" means for your next trade. You'll know why a "SWEPT" signal is different from a "FALSE BREAKOUT." You'll know when to trust an "EXCELLENT" quality score — and when to stay flat.

No guesswork. No learning curve. You attach it, you read the guide, you understand it.

The market won't wait for you to feel ready. Breakouts happen whether you're prepared or not. The only question is whether you'll have the context to act on them.

Click "Buy" to add Bollinger Market & Trend Intelligence to your MT5 today — and get the full user guide instantly. Or download the free demo and test it on your own charts before committing. See the dashboard. Read the signals. Watch how it scores breakouts in real time.

Lifetime updates. Direct developer support. Zero risk to try.

Bollinger Breakout Intelligence | Volatility Compression Detector | Multi-Timeframe Trend Analysis | No Repaint Dashboard | Post-Breakout Efficiency Scoring | MT5 Indicator


Рекомендуем также
RBreaker Gold Indicators — это краткосрочная внутридневная торговая стратегия для фьючерсов на золото, которая сочетает в себе два подхода: трендовое следование и внутридневные развороты. Она позволяет не только получать прибыль при трендовом движении, но и своевременно фиксировать прибыль при развороте рынка, открывая позиции в новом направлении. Данная стратегия на протяжении 15 лет подряд входила в десятку самых прибыльных торговых стратегий по версии американского журнала Futures Truth. Она
Limitless MT5  - это универсальный индикатор который подойдет каждому как начинающему так и опытному трейдеру работает на всех валютных парах криптовалютах сыре акциях Limitless MT5 - уже настроен и не требует дополнительной настройки   А теперь главное Почему  Limitless MT5 ? 1 полное отсутствие перерисовки  2 два года тестирования лучшими специалистами в трейдинге 3 точность правильных сигналов превышает 80% 4 хорошо показал себя в торговле во время выхода новостей Правила торговли  1 сигнал н
Indicator Name: Fibaction – price action candle Detector Description: Fibo Signal Boxes is a powerful Smart Money Concept (SMC)-inspired indicator that auto-detects price action candles. bullish hammers and shooting stars, then draws precise Fibonacci entry zones and multiple take-profit levels directly on the chart. as for the SL personally i use 40 pips rules  Key Features: Detects bullish hammer and shooting star reversal candles. Automatically draws Fibonacci entry and TP boxes. as
Unlock the Market's Hidden Blueprint with Advanced Pattern Recognizer Tired of staring at charts, struggling to spot high-probability trading opportunities? What if you had a professional analyst scanning the markets 24/7, drawing perfect trendlines, and calculating precise profit targets for you? Introducing Advanced Pattern Recognizer for MetaTrader 5 – Your Automated Technical Analysis Powerhouse. This isn't just another indicator. It's a sophisticated algorithmic engine designed to do the he
WanaScalper
Isaac Wanasolo
1 (1)
A scalping indicator based on mathematical patterns, which on average gives signals with relatively small SL, and also occasionally helps to catch big moves in the markets (more information in the video) This indicator has three main types of notifications: The first type warns of a possible/upcoming signal on the next bar The second type indicates the presence of a ready signal to enter the market/open a position The third type is for SL and TP levels - you will be notified every time price re
Your Trend Friend
Luigi Nunes Labigalini
5 (1)
The trend is your friend! Look at the color of the indicator and trade on that direction. It does not  repaint. After each candle is closed, that's the color of the trend. You can focus on shorter faster trends or major trends, just test what's most suitable for the symbol and timeframe you trade. Simply change the "Length" parameter and the indicator will automatically adapt. You can also change the color, thickness and style of the lines. Download and give it a try! There are big movements w
IVISTscalp5
Vadym Zhukovskyi
5 (6)
[iVISTscalp5]:  Лаборатория исследования поведения рынка через время TLV Framework | Liquidity Activation Points Общее описание iVISTscalp5 — это мультиуровневый индикатор таймингов и ценовой структуры, разработанный в рамках проекта VISTmany. Система прогнозирует время, направление и диапазон движения через Liquidity Activation Points (тайминги). Индикатор iVISTscalp5 можно использовать с параметрами по умолчанию для любого финансового инструмента. -----------------------------------------
CosmiCLab SMC FIBO CosmiCLab SMC FIBO — это профессиональный торговый индикатор, основанный на концепциях Smart Money Concepts (SMC), анализе структуры рынка и уровнях Fibonacci. Индикатор автоматически определяет свинги рынка и строит уровни Fibonacci по последнему импульсному движению. Также индикатор определяет ключевые изменения структуры рынка: BOS — Break Of Structure CHOCH — Change Of Character Дополнительно отображаются сигнальные стрелки BUY / SELL при пробое структуры. Индикатор подход
PatternScope — Multi-Pattern Recognition for MT5 PatternScope is a multi-pattern recognition indicator for MetaTrader 5. It scans price action for classic chart patterns, confirms breakouts, and draws clear   Entry, Stop Loss and Take Profit   levels. A compact dashboard shows the latest pattern, bias and Risk:Reward. Patterns:   Double Top/Bottom, Triple Top/Bottom, Head and Shoulders (and inverted), Bullish & Bearish Flag, Pennant, Rising & Falling Wedge, Triangle, Rectangle, Cup and Handle —
Liquidity Order Blocks MT5 Liquidity Order Blocks MT5 is a professional visual indicator for MetaTrader 5 designed to help traders identify and monitor potential bullish and bearish liquidity areas directly on the chart. The indicator detects pivot-based order block zones and displays each zone with a structured visual breakdown of estimated bullish volume, bearish volume, relative strength and delta. Its purpose is to make liquidity areas easier to read, compare and monitor during market analys
PipFinite Trend PRO MT5
Karlo Wilson Vendiola
4.84 (560)
Стратегия пробоя для торговли по тренду, фильтрация и все необходимые функции, встроенные в один инструмент! Интеллектуальный алгоритм индикатора Trend Pro с точностью определяет тренд, отфильтровывает рыночный шум и генерирует входные сигналы и уровни выхода. Новые функции с расширенными правилами статистического расчета улучшают общую производительность этого индикатора. Важная информация Для максимального использования потенциала Trend Pro прочитайте полное описание www.mql5.com/en/blogs/p
Tma Poc Gold
Ignacio Agustin Mene Franco
POC + TMA SCALPER GOLD - Expert Advisor Professional DESCRIPTION: Automated trading system designed specifically for XAU/USD, combining Point of Control (POC) with Triangular Moving Average (TMA) to identify high-volume and trending zones. It uses advanced risk management with dynamic trailing stops and an intelligent grid system. TECHNICA
Индикатор FFx Patterns Alerter дает торговые рекомендации по входу в рынок, по уровням TP 1, TP 2 и SL на основе любого из выбранных паттернов (PinBar, Engulfing, InsideBar, OutsideBar) Предлагаются следующие варианты: Для работы с несколькими парами можно запускать несколько экземпляров индикатора на одном графике. Рекомендации по входу - количество пипсов, которые будут добавлены после пробоя для входа в рынок 3 различных варианта расчета SL - по пипсам, с использованием множителя ATR или по м
Divergent Stochastic Filter II Catch Reversals Early, Filter Noise, Trade with Confidence The Edge: Why This Stochastic is Different  Every trader knows the Stochastic oscillator. But knowing when to trust its signals, that's the real challenge. The Divergent Stochastic Filter II transforms this classic indicator into a precision reversal detection system by adding critical elements: divergence intelligence, signal filtering and exhaustion detection.  While standard Stochastic oscillators fire s
Легендарные уровни Уильяма Ганна в полностью автоматизированном индикаторе для MT5. GANN Master точно определяет ключевые зоны, в которых с наибольшей вероятностью цена может развернуться или продолжить движение, основываясь на данных за день, неделю и месяц. Основные возможности: Однокликовые кнопки выбора периода: нажмите Daily, Weekly или Monthly, чтобы мгновенно построить зоны за текущий день, неделю или месяц Автоматический и ручной режимы • Автоматический : GANN Master сам вычисляет все ур
Structure King AI Signal Structure King AI Signal is a professional MetaTrader 5 trading indicator designed to help traders analyze market structure, trend direction, multi-timeframe confirmation and trade management from one clean dashboard. Key Features • Market Structure & Trend Analysis • BUY / SELL Signals • Multi-Timeframe (HTF) Confirmation • Entry Price Levels • Dynamic Stop Loss (SL) • TP1 / TP2 / TP3 Levels • ATR Volatility Analysis • ADX Trend Strength Filter • Adaptive Market Filter
MarketMagnet
Kelly Adediran Raymond
Готовы ли вы выйти на новый уровень в своем торговом путешествии? Не ищите ничего, кроме MarketMagnet, этого новаторского индикатора, разработанного, чтобы стимулировать ваш торговый успех с волнением и точностью. Основанный на слиянии Momentum и CCI (индекс товарного канала), MarketMagnet предоставляет трейдерам окончательный инструмент для определения направления и цен входа для широкого спектра рекомендуемых валютных пар и инструментов. Если вы новичок, трейдер среднего уровня, у которого ес
RVE Echo Indicator MT5 — Rejection Velocity Echo RVE Echo Indicator is a custom MetaTrader 5 technical indicator designed to detect abnormal price rejection, sharp velocity changes, and possible reversal zones in the market. RVE stands for Rejection Velocity Echo . The indicator studies how strongly price moves compared to its recent rejection behavior, then highlights moments where the current price movement appears unusually aggressive. This can help traders identify possible exhaustion, rejec

Horizontal lines on the chart alternate between solid and dashed styles, representing areas of interest based on significant highs and lows from different timeframes, creating potential confluence between market structures. The indicator is designed to assist each participant in their own market studies, giving users the flexibility to combine the indicator with their personal trading system and analysis methods . The lines should not be used as standalone entry triggers . Instead, they are inte
GDS Renko Pip ST Chart - Pip-Based Renko Chart Indicator for MetaTrader 5 GDS Renko Pip ST Chart is a pip-based Renko chart indicator for MetaTrader 5. It helps traders build and study cleaner Renko price movement using a practical fixed pip or point-based brick structure. This tool is designed as a Renko chart foundation for manual analysis. It does not predict the market, does not generate buy or sell signals and does not decide whether a trade should be opened. Renko EDGE EA Golden Delta | A
The Rainbow Dragon Indicator by Quant Atlas Creator:  https://www.quant-atlas.com/ The Rainbow Dragon is a composite signal engine that aggregates the seven Rainbow indicators — Blue, Green, Indigo, Red, Violet, Yellow, and Orange — into a single confluence-based reading. Rather than relying on any one model, it treats each Rainbow component as an independent voter and fires only when enough of them agree, giving you a diversified, multi-method read on the market instead of a single point of vie
SMC Indicator BOS & CHoCH analyze market structure using Smart Money Concepts The indicator combines BOS (Break of Structure), CHoCH (Change of Character), Fair Value Gaps (FVG), Liquidity Sweep logic and ATR filtering to provide a structured view of market movements and potential trading opportunities. The indicator automatically identifies swing highs and swing lows and monitors structural breaks in the market. BOS (Break of Structure) identifies potential continuation of the current market st
Caicai L&S Yield Histogram Important Notice: This indicator is an integral tool of the automated EA Caicai Long and Short Pair Trading . This indicator visually displays the percentage deviation (Yield %) of a pair's current spread relative to its own historical mean. It is an excellent tool for quickly visualizing the gross financial potential of a market distortion in Long & Short operations. Main Features: Percentage Visualization: Understand the size of the distortion in palpable percentage
STRICTLY FOR BOOM INDEX ONLY!!!!! Here I bring the Maximum Trend Arrows OT1.0 MT5 indicator. This indicator is made up of a combination of different trend indicators for entries and exits, for entries an orange arrow will paint on the chart below the current market and a red flag for closing of trades and it produces buy arrows only. When the orange arrow appears, it will appear along with it's sound to notify you. The 1H timeframe is recommended, don't use it anywhere else than on the 1H timefr
TREND SNIPER PORTFOLIO MT5 Trend Sniper Portfolio is a fully automated, institutional-grade trading algorithm designed specifically to capture high-probability trend reversals and momentum setups on fast-moving indices, with a primary optimization for the proprietary FX Vol 20 (Weltrade Index) . Unlike traditional high-risk grid or martingale systems that drain account equity during prolonged trends, this algorithm operates under a strict mathematical model built on structural price actio
Cycle Projection Pro is a cyclical analysis indicator for MetaTrader 5, designed for the Daily timeframe. It identifies and projects recurring price cycles forward in time, helping you estimate when — not how much — the market may be approaching a turning point. How it works The indicator sums six harmonic cycles with explicit periods — Weekly, Biweekly, Monthly, Quarterly, Semiannual, Annual — each independently adjustable and can be turned on or off. Their combination produces a composite wav
HAS RSI Signal — Профессиональный трендовый индикатор с расчетом SL/TP HAS RSI Signal — это мощный торговый инструмент, объединяющий проверенную классику и современные алгоритмы фильтрации шума. Индикатор анализирует рынок через призму сглаженных свечей Heiken Ashi и осциллятора RSI, предоставляя трейдеру четкие сигналы на вход в моменты разворота тренда или выхода из зон перекупленности/перепроданности. Основные преимущества: Двойная фильтрация: Использование Heiken Ashi Smoothed позволяет искл
PipFinite Exit EDGE MT5
Karlo Wilson Vendiola
4.88 (32)
Должна была состояться прибыльная сделка и вдруг отменилась? При наличии надежной стратегии выход из сделки также важен, как и вход. Exit EDGE помогает максимально увеличить доход от текущей сделки и не потерять выигрышные сделки. Всегда будьте внимательны к сигналу на выход из сделки Отслеживайте все пары и тайм-фреймы в одном графике www.mql5.com/en/blogs/post/726558 Торговля Вы можете закрыть уже открытые сделки, как только получите сигнал Закрывайте заявку на покупку, если вы получили си
Ultra AS MT5
Yaroslav Varankin
3 (2)
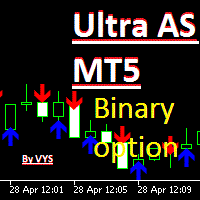
Индикатор предназначен для торговли бинарными опционами. Параметр "period" можно настроить под свою торговую стратегию, что позволяет подобрать нужное количество и качество сигналов. Красная стрелка вниз – это сигнал на продажу, синяя стрелка вверх – сигнал на покупку. Рекомендуемое время экспирации — одна свеча. Открывать сделку можно либо при появлении сигнала, либо на следующей свече. Внимание: сигнал может иногда исчезать на текущей свече, поэтому важно учитывать это при принятии решений. Е
CRT Candle Range Theory HTF MT5.   Ultimate CRT Indicator: Advanced ICT Concepts and Malaysian SnR Trading System Master the Market Maker's Footprints with the Most Advanced Candle Range Theory Indicator Unlock the true power of  Smart Money Concepts (SMC)  and trade precisely like the institutions with the  Ultimate CRT Indicator . Built exclusively for serious traders, this indicator automates the highly effective  Candle Range Theory (CRT) , a core pillar of  ICT Concepts (Inner Circle Trader
С этим продуктом покупают
Этот продукт был обновлен для рынка 2026 года и оптимизирован для последних сборок MT5. УВЕДОМЛЕНИЕ ОБ ИЗМЕНЕНИИ ЦЕНЫ: Smart Trend Trading System сейчас доступен за $99 . Цена увеличится до $199 после следующих 30 покупок . СПЕЦИАЛЬНОЕ ПРЕДЛОЖЕНИЕ: После покупки Smart Trend Trading System отправьте мне личное сообщение, чтобы получить Smart Universal EA БЕСПЛАТНО и превратить сигналы Smart Trend в автоматические сделки. Smart Trend Trading System — это полноценная торговая система без перерисов
Trend Sniper X
Sarvarbek Abduvoxobov
4.88 (33)
Trend Sniper X — это трендовый индикатор для MetaTrader 5, работающий на нескольких таймфреймах, который помогает трейдерам точно и ясно определять направление тренда и потенциальные точки разворота. для MT4: https://www.mql5.com/en/market/product/193245 Информация о цене: Текущая цена является промо-ценой и может измениться по мере выхода предстоящих обновлений и новых функций. Бонусное предложение: Чтобы получить БЕСПЛАТНЫЙ авто-трейд советник Assistant EA для этого индикатора, пожалуйста, на
Neuro Poseidon - новый индикатор от Дарьи Резуевой. Он сочетает точные торговые сигналы с адаптивными уровнями TP/SL , в результате создавая максимально выгодные сделки! TO SWITCH TO   ENG   PLEASE CHOOSE IT IN THE UPPER-RIGHT CORNER OF THE WEBSITE Напишите мне и получите  Neuro Poseidon Assistant  в подарок для автоматизации вашей торговли! Что отличает его от других индикаторов? 1. Доказанная прибыльность на всех активах и таймфреймах 2. На графике присутствуют только подтвержденные сигналы н
SuperScalp Pro
Van Minh Nguyen
4.64 (33)
SuperScalp Pro - Professional Multi-Layer Confluence Scalping System SuperScalp Pro — это продвинутый индикатор для скальпинга, который улучшает классический Supertrend с помощью нескольких интеллектуальных фильтров подтверждения. Он помогает определять торговые возможности Buy/Sell с более высокой вероятностью, значительно сокращая количество ложных сигналов. Чёткие стрелки Buy и Sell отображаются непосредственно на графике, а уровни Stop Loss и Take Profit на основе ATR автоматически рассчитыв
Welcome to ENTRY IN THE ZONE AND SMC MULTI TIMEFRAME Entry In The Zone and SMC Multi Timeframe is a real-time market analysis tool based on Smart Money Concepts (SMC), designed to analyze market structure, price direction, and key trading zones. It supports both Single-Timeframe Analysis and Multi-Timeframe Analysis, providing a clearer view of the overall market structure across multiple timeframes, with real-time BUY / SELL signals that do not repaint. It is designed to help filter trading opp
M1 SNIPER   — это простая в использовании торговая система. Это стрелочный индикатор, разработанный для тайм фрейма M1. Индикатор можно использовать как отдельную систему для скальпинга на тайм фрейме M1, а также как часть вашей существующей торговой системы. Хотя эта торговая система была разработана специально для торговли на M1, ее можно использовать и с другими тайм фреймами. Первоначально я разработал этот метод для торговли XAUUSD и BTCUSD. Но я считаю этот метод полезным и для торговли на
SPECIAL OFFER: Buy UNIX Scalper. Get Smart Universal Expert Advisor FREE. Purchase UNIX Scalper for MT5 and receive Smart Universal Expert Advisor at no additional charge to automate your UNIX Scalper signals. One $99 purchase. Your indicator plus a free automation EA. After purchasing, send me a private message on MQL5 to claim your EA.  UNIX Scalper — Multi-Market Analysis, Trade Planning and Automation Find the setup. See the plan. Choose how to trade it. UNIX Scalper brings market analysis,
Entry Points Pro — топовый индикатор, дающий перспективные точки входа в сделки без перерисовки. Индикатор покажет заранее стрелкой точку входа в сделку, укажет цену входа и нарисует на графике уровень входа и стопа, а так же рассчитает рабочий лот под твой депозит и риск, а панель статистики поможет выбрать самый перспективный инструмент и таймфрейм .  Тебе остаётся поставить отложенный ордер и ждать реализации сделки. Чтобы показать возможности индикатора Entry Points Pro, я провёл публичный
Reversion King Indicator
Eugen-alexandru Zibileanu
5 (7)
Новый король в городе — Индикатор + управление ордерами (TP1 + TP2 + TP3) + опциональный Telegram-сигнал-сендер ВКЛЮЧЁН (БЕСПЛАТНО) (ПОЛНОЦЕННАЯ ТОРГОВАЯ И СИГНАЛЬНАЯ СИСТЕМА) Gold Slayer EA Этот индикатор включает в себя продвинутую стратегию, торговую систему с настраиваемым управлением ордерами и систему mean reversion, которая сочетает расширения Envelope и поддерживается несколькими интеллектуальными фильтрами подтверждения, такими как RSI, для поиска высоковероятных точек разворота с сигн
Этот продукт был обновлен для рынка 2026 года и оптимизирован для последних сборок MT5. УВЕДОМЛЕНИЕ ОБ ИЗМЕНЕНИИ ЦЕНЫ: Atomic Analyst сейчас доступен за $99 . Цена увеличится до $199 после следующих 30 покупок . СПЕЦИАЛЬНОЕ ПРЕДЛОЖЕНИЕ: После покупки Atomic Analyst отправьте мне личное сообщение, чтобы получить Smart Universal EA БЕСПЛАТНО и превратить сигналы Atomic Analyst в автоматические сделки. Atomic Analyst — это индикатор Price Action без перерисовки, без перерисовывания истории и без
Gann Made Easy   - это профессиональная, но при этом очень простая в применении Форекс система, основанная на лучших принципах торговли по методам господина У.Д. Ганна. Индикатор дает точные BUY/SELL сигналы, включающие в себя уровни Stop Loss и Take Profit. ПОЖАЛУЙСТА, СВЯЖИТЕСЬ СО МНОЙ ПОСЛЕ ПОКУПКИ, ЧТОБЫ ПОЛУЧИТЬ ТОРГОВЫЕ ИНСТРУКЦИИ И ОТЛИЧНЫЕ ДОПОЛНИТЕЛЬНЫЕ ИНДИКАТОРЫ БЕСПЛАТНО! Вероятно вы уже не раз слышали о торговли по методам Ганна. Как правило теория Ганна отпугивает от себя не только
UZFX {SSS} Scalping Smart Signals v5.0 MT5 — это высокопроизводительный торговый индикатор без перерисовки, разработанный для скальперов, дейтрейдеров и свинг-трейдеров, которым требуются точные сигналы в режиме реального времени на быстро меняющихся рынках. Разработанный компанией (UZFX-LABS), этот индикатор сочетает в себе анализ ценового действия, подтверждение тренда и интеллектуальную фильтрацию для генерации высоковероятных сигналов на покупку и продажу, предупреждающих сигналов и возможно
Scalper Vault   — это профессиональная торговая система, которая дает вам все необходимое для успешного скальпинга. Этот индикатор представляет собой полную торговую систему, которую могут использовать трейдеры форекс и бинарных опционов. Рекомендуемый тайм фрейм М5. Система дает точные стрелочные сигналы в направлении тренда. Она также предоставляет вам сигналы выхода и рассчитывает рыночные уровни Ганна. Индикатор дает все типы оповещений, включая PUSH-уведомления. Пожалуйста, напишите мне пос
FiboSniper Pro – Multi-Filter Fibonacci System with Auto SL/TP and Control Panel FiboSniper Pro — это технический индикатор, который объединяет динамические Fibonacci Envelopes с несколькими фильтрами подтверждения для формирования отборных сигналов Buy и Sell. Уровни Fibonacci рассчитываются на основе Moving Average и ATR, а затем фильтруются с помощью ADX, EMA, RSI, ATR, Volume, Time и структуры свечи. Индикатор отображает на графике автоматические уровни Stop Loss и Take Profit на основе ATR,
Каждый покупатель этого индикатора получает дополнительно Бесплатно: Авторскую утилиту "Bomber Utility", которая автоматически сопровождает каждю торговую операцию, устанавливает уровни Стоп Лосс и Тейк профит и закрывает сделки согласно правилам этой стратегии, Сет-файлы для настройки этого индикатора на различных активах, Сет-файлы для настройки Bomber Utility в режимы: "Минимум Риска", "Взвешенный Риск" и "Стратегия Выжидания", Пошаговый видео-мануал, который поможет вам быстро установить, н
Currency Strength Wizard   — очень мощный индикатор, предоставляющий вам комплексное решение для успешной торговли. Индикатор рассчитывает силу той или иной форекс-пары, используя данные всех валют на нескольких тайм фреймах. Эти данные представлены в виде простых в использовании индексов валют и линий силы валют, которые вы можете использовать, чтобы увидеть силу той или иной валюты. Все, что вам нужно, это прикрепить индикатор к графику, на котором вы хотите торговать, и индикатор покажет вам
GEM Signal Pro GEM Signal Pro — это трендовый индикатор для MetaTrader 5, созданный для трейдеров, которым нужны более понятные сигналы, более структурированные торговые сетапы и более практичное управление рисками прямо на графике. Вместо того чтобы показывать только простую стрелку, GEM Signal Pro помогает представить всю торговую идею в более наглядной и удобной форме. Когда условия подтверждены, индикатор может отображать на графике цену входа, stop loss и цели take profit, помогая трейдеру
ATSTRONG PRO: Индикатор Структуры Рынка и Пробоев Движок Обнаружения Пробоев | 5 Динамических Целей TP | Живая Панель Дашборда | Без Перерисовки Вводная Цена Текущая Цена: $59 — Цена увеличивается на $10 после каждых 10 продаж. ATSTRONG PRO — это передовой индикатор пробоев и институциональной структуры рынка, разработанный для MetaTrader 5. Он обнаруживает высоковероятные свинговые развороты, идентифицирует кластерные зоны накопления поддержки и сопротивления, а также сигнализирует о сломе с
Power Candles V3 — самооптимизирующийся индикатор силы Power Candles V3 преобразует силу валюты и инструмента в готовый к использованию торговый план на каждом графике, к которому он прикреплен. Вместо того, чтобы просто раскрашивать свечи, он выполняет автоматическую оптимизацию в режиме реального времени в фоновом режиме и предоставляет вам оптимальные значения Stop Loss, Take Profit и порог сигнала для выбранного вами символа. Один клик — и все готово для реальной торговли: на графике появляю
Azimuth Pro
Ottaviano De Cicco
5 (7)
Azimuth Pro V2: Синтетический фрактальный структурный анализ и подтверждённые входы для MT5 Обзор Azimuth Pro — многоуровневый индикатор свинговой структуры от Merkava Labs . Четыре вложенных уровня свингов, привязанный к свингам VWAP, определение ABC-паттернов, трёхтаймфреймная структурная фильтрация и подтверждённые входы на закрытой свече — один график, один рабочий процесс от микро-свингов до макро-циклов. Это не слепой сигнальный продукт. Это рабочий процесс, основанный на структуре, для т
Crystal Heikin Ashi Signals - Professional Trend & Signal Detection Indicator Advanced Heikin Ashi Visualization with Intelligent Signal System for Manual & Automated Trading Final Price: $149 ---------> Price goes up $10 after every 10 sales . Limited slots available — act fast . Overview Crystal Heikin Ashi Signals is a professional-grade MetaTrader 5 indicator that combines pure Heikin Ashi candle visualization with an advanced momentum-shift detection system. Designed for both manual traders
Trend Catcher   анализирует движения рыночных цен, используя комбинацию собственных и индивидуально разработанных адаптивных индикаторов анализа тренда. Он определяет истинное направление рынка, отфильтровывая краткосрочные шумы и фокусируясь на силе импульса, расширении волатильности и поведении ценовой структуры. Он также использует комбинацию сглаживающих и фильтрующих тренд индикаторов, таких как скользящие средние, RSI и фильтры волатильности. Мониторинг реальных операций, а также другие
Crystal Quantum Pro
Muhammad Jawad Shabir
5 (3)
CRYSTAL QUANTUM PRO Institutional Signal & Trade Intelligence for MetaTrader 5 Final Price: 199 USD ----> Price goes up 10 USD after every 10 sales. Limited launch slots available, act fast. Most indicators give you an arrow and leave you alone. A naked arrow is a gamble. Winning consistently requires CONFLUENCE , a clear STOP and TARGET , and honest PROOF that the system works. Crystal Quantum Pro delivers all three in one clean, no-repaint package. Crystal Quantum Pro is a complete decision sy
FX Power: Анализируйте силу валют для более эффективной торговли Обзор FX Power — это ваш незаменимый инструмент для понимания реальной силы валют и золота в любых рыночных условиях. Определяя сильные валюты для покупки и слабые для продажи, FX Power упрощает принятие торговых решений и выявляет высоковероятные возможности. Независимо от того, хотите ли вы следовать за трендами или предсказывать развороты с использованием экстремальных значений дельты, этот инструмент идеально адаптируется под
FX Trend NG: Следующее поколение интеллектуального анализа трендов на разных рынках Обзор FX Trend NG — это профессиональный инструмент анализа трендов и мониторинга рынка с поддержкой нескольких таймфреймов. Он позволяет за секунды получить полное структурное понимание текущего состояния рынка. Вместо переключения между десятками графиков вы мгновенно видите, какие инструменты находятся в тренде, где импульс ослабевает и где наблюдается сильная синхронизация между таймфреймами. Специальное пр
Btmm state engine pro
Garry James Goodchild
5 (4)
BTMM State Engine Pro by G-Labs — Beat The Market Maker indicator for MetaTrader 5. Asian session range, London and New York kill zones, level progression (L1/L2/L3), peak formation detection (PFH/PFL), entry signals, and a multi-pair scanner from one chart. Stop scanning charts one pair at a time. The State Engine tracks the BTMM daily cycle automatically — Asian box, room boundaries, level blocks, peak formations, and filtered entries — while the scanner dashboard shows level, peak status, d
M1 Quantum MT5
Hamed Dehgani
4.27 (11)
Торговые сигналы в реальном времени с использованием M1 Quantum: Сигнал  (Сделка выполнена автоматически с помощью Quantum Trade Assistant , бесплатно включённого в этот продукт.) Последние новости : Выпущена версия 1.64. Теперь для всех сделок Stop Loss размещается за соответствующими зонами поддержки/сопротивления. Функция Smart Close также была улучшена для повышения производительности EA в этой версии. С 9 августа live-сигнал работает на версии 1.64. План цен: Текущая цена: $169 (Предложени
Precision Spike Detector
Francisco Mandomo Simbine
5 (2)
Precision Spike Detector V3 – Institutional-Grade AI Trading System Attention: The price increases by US$50 for every 10 purchases.  Final price: US$599 Precision Spike Detector V3   is a   state-of-the-art, institutional-grade market analysis system   for   MetaTrader 5 , designed to detect   high-probability market movements   in synthetic indices such as   Boom, Crash, GainX, and PainX . After purchase, send me a private message to receive the optimized configuration files,  the installation
Elliott Wave Hunter - SMC Edition Elliott Wave Hunter identifies Elliott Wave 2 and Wave 5 setups and combines them with Smart Money Concepts to filter entries to high-probability zones only. Wave 2 signals mark continuation entries in the direction of the dominant Wave 1 impulse. The indicator waits for the retracement to confirm, locates an Order Block, Fair Value Gap or Liquidity Sweep zone within the impulse, then triggers only when price returns to retest that zone with a qualifying revers
ICT PO3 (Power of 3) AMD Protocol Framework Indicator True Time & Structure Integration   |  Non-Repainting | Real-Time  | Multi-Asset  | MT4 Version Available Full Setup Guide & Strategy Playbook: https://www.mql5.com/en/blogs/post/768683 MT4 Version: https://www.mql5.com/en/market/product/171742 Indicator Overview The ICT PO3 AMD Protocol Framework is a complete structural overlay for MetaTrader 5 that maps the True Daily Cycle directly onto your lower-timeframe execution chart. It project
Другие продукты этого автора
SWING VOLUME PROFILE Swing-Based Volume Profile + Fibonacci + RSI -------------------------------------------------- Auto-detected swings. Volume profile. Fibonacci. RSI. All-in-one. -------------------------------------------------- WHAT THIS INDICATOR DOES Swing Volume Profile (SVP) automatically detects structural swings and displays a volume profile for the most recent completed swing — with Fibonacci retracement and RSI overlay. No manual range selection needed. The indicator finds
FIXED RANGE VOLUME PROFILE Auto-Detecting Volume Profile Indicator with Real-Time Trendline Tracking -------------------------------------------------- FREE INDICATOR Volume distribution. Value areas. High-volume nodes. All from your trendline. -------------------------------------------------- WHAT THIS INDICATOR DOES Fixed Range Volume Profile (FRVP) displays volume distribution over a user-defined range — automatically detecting the latest trendline you draw or drag on the chart. No
SWING DETECTOR WITH RSI AND FIBONACCI Structural Swing Points + Fibonacci Retracement + RSI Overlay -------------------------------------------------- FREE INDICATOR Identify swings. See Fibonacci levels. Check RSI. All in one free indicator. -------------------------------------------------- WHAT THIS INDICATOR DOES This indicator automatically detects structural swing highs and lows using configurable depth and deviation filtering. It connects swings with trend lines, overlays standard
FREE
SWING HIGHS LOWS DETECTOR Swing Detection with Divergence Analysis -------------------------------------------------- Identify swings. Spot divergences. Trade with confluence. -------------------------------------------------- WHAT THIS INDICATOR DOES This indicator automatically detects structural swing highs and lows using configurable depth and deviation filtering. It then analyzes RSI and MACD to detect regular and hidden divergences between consecutive swings of the same type. Diver
FREE
SWING DETECTOR WITH RSI AND FIBONACCI Structural Swing Points + Fibonacci Retracement + RSI Overlay -------------------------------------------------- FREE INDICATOR Identify swings. See Fibonacci levels. Check RSI. All in one free indicator. -------------------------------------------------- WHAT THIS INDICATOR DOES This indicator automatically detects structural swing highs and lows using configurable depth and deviation filtering. It connects swings with trend lines, overlays standard
FREE
SWING HIGHS LOWS DETECTOR Swing Detection with Divergence Analysis -------------------------------------------------- Identify swings. Spot divergences. Trade with confluence. -------------------------------------------------- WHAT THIS INDICATOR DOES This indicator automatically detects structural swing highs and lows using configurable depth and deviation filtering. It then analyzes RSI and MACD to detect regular and hidden divergences between consecutive swings of the same type. Diver
FREE
FIXED RANGE VOLUME PROFILE Auto-Detecting Volume Profile Indicator with Real-Time Trendline Tracking -------------------------------------------------- Volume distribution. Value areas. High-volume nodes. All from your trendline. -------------------------------------------------- WHAT THIS INDICATOR DOES Fixed Range Volume Profile (FRVP) displays volume distribution over a user-defined range — automatically detecting the latest trendline you draw or drag on the chart. No manual range sel
ADAPTIVE SWING DENSITY HEAT MAP Structural Density + Participation Analysis -------------------------------------------------- See where price clusters. See where price fights. -------------------------------------------------- WHAT THIS INDICATOR DOES This indicator analyzes swing point density across price levels, then tracks how price actually interacts with each zone — measuring participation, acceptance, and rejection. The result is a heat map of structural zones, color-coded by den
CONSOLIDATION INTELLIGENCE PRO (MT4) Catch The Next Big Move! Stop Getting Chopped Up in Ranges. Map Institutional Order Density With 5-Tier Heatmaps. Up to 70% of retail losses happen inside messy consolidation ranges. Consolidation Intelligence Pro scans your MT4 charts for overlapping candle accumulation, measures body-to-wick density, and maps real-time 5-Tier Heatmaps directly over high-value consolidation zones. You instantly see where liquidity is stacked, where institutional orders are c
DONCHIAN MARKET & TREND INTELLIGENCE ENGINE (MT4) Multi-Factor Volatility, Trend Structure & Institutional Breakout Validation Dashboard MOST BREAKOUT INDICATORS ARE TRAPPING YOU. They Tell You THAT Price Broke Out. They Never Tell You IF It Will Hold. You have lived this scenario dozens of times: Price spends days coiling inside a tight Donchian band on your MT4 chart. A massive candle punches above the 20-period high. You buy the breakout — expecting momentum. Three candles later, price colla
BOLLINGER MARKET & TREND INTELLIGENCE — MT4 Edition STOP GUESSING WHICH BREAKOUTS ARE REAL. Most Bollinger breakouts fail. This engine tells you which ones won't — before you risk a single dollar. You get a quality score, a volatility percentile, and a post-breakout efficiency reading. All locked on bar close. No repainting. No guessing. The market gives you maybe three clean breakouts a week. This tool makes sure you catch them — and helps you avoid the twelve that would have stopped you out. T
FREE
ADAPTIVE SWING DENSITY HEAT MAP Structural Density + Participation Analysis See where price clusters. See where price fights. -------------------------------------------------- WHAT THIS INDICATOR DOES This indicator analyzes swing point density across price levels, then tracks how price actually interacts with each zone — measuring participation, acceptance, and rejection. The result is a heat map of structural zones, color-coded by density strength: - Red zones = Highest density (80-10
SWING VOLUME PROFILE Swing-Based Volume Profile + Fibonacci + RSI -------------------------------------------------- Auto-detected swings. Volume profile. Fibonacci. RSI. All-in-one. -------------------------------------------------- WHAT THIS INDICATOR DOES Swing Volume Profile (SVP) automatically detects structural swings and displays a volume profile for the most recent completed swing — with Fibonacci retracement and RSI overlay. No manual range selection needed. The indicator finds
CONSOLIDATION INTELLIGENCE PRO Catch The Next Big Move!Stop Getting Chopped Up in Ranges. Map Institutional Order Density With 5-Tier Heatmaps. Up to 70% of retail losses happen inside messy consolidation ranges. Consolidation Intelligence Pro scans your charts for overlapping candle accumulation, measures body-to-wick density, and maps real-time 5-Tier Heatmaps directly over high-value consolidation zones. You instantly see where liquidity is stacked, where institutional orders are concentrate
DONCHIAN MARKET & TREND INTELLIGENCE The Only Donchian Tool That Tells You WHY the Market Is Moving — Not Just Where Most Donchian indicators draw three lines and call it a day. You get an upper band. A middle band. A lower band. And when price pokes above the upper band, you're supposed to just... buy? That's not analysis. That's guessing with extra steps. THE PROBLEM EVERY DONCHIAN TRADER KNOWS You've seen it a hundred times. Price finally breaks above the 20-period high after days of compress
VWAP SNIPER REVERSAL PRO Stop Catching Falling Knives. Trade Institutional Reversals With Multi-Factor Exhaustion & RSI Telemetry. Most mean-reversion tools force you to guess where a market will turn. You buy an "oversold" indicator, only for price to crash through your stop-loss while staying oversold for hours. VWAP Sniper Reversal Pro v2.30 changes the game. It combines continuous rolling institutional VWAP baselines, dual-layer ATR volatility ribbons, volume/wick exhaustion filters, and an
Фильтр:
Нет отзывов
Ответ на отзыв